Free Statistics

of Irreproducible Research!

Author's title

Author*Unverified author*
R Software Modulerwasp_arimabackwardselection.wasp
Title produced by softwareARIMA Backward Selection
Date of computationWed, 29 Dec 2010 18:28:42 +0000
Cite this page as followsStatistical Computations at FreeStatistics.org, Office for Research Development and Education, URL https://freestatistics.org/blog/index.php?v=date/2010/Dec/29/t1293647204uybo8ij03jcayl3.htm/, Retrieved Fri, 03 May 2024 13:08:51 +0000
Statistical Computations at FreeStatistics.org, Office for Research Development and Education, URL https://freestatistics.org/blog/index.php?pk=117020, Retrieved Fri, 03 May 2024 13:08:51 +0000
QR Codes:

Original text written by user:
IsPrivate?No (this computation is public)
User-defined keywords
Estimated Impact93
Family? (F = Feedback message, R = changed R code, M = changed R Module, P = changed Parameters, D = changed Data)
-       [ARIMA Backward Selection] [Paper] [2010-12-29 18:28:42] [d5e0edb7e0239841e94676417b2a1e2e] [Current]
Feedback Forum

Post a new message
Dataseries X:
26548
26752
26967
27034
27056
27476
28497
29085
28720
29067
29249
29672
29761
30066
30315
30571
30757
30742
31310
31381
31470
31226
31081
31061
31114
30828
30418
30195
29877
29192
29876
29409
28458
28340
28164
28438
28053
27599
27226
27119
26625
26541
27023
26631
26154
26029
26008
26632
27010
27041
27244
26976
26715
27017
27714
27655
27103
27088
26968
27770
27616
27481
27279
26918
26503
26547
27467
27305
26259
26048
25743


Summary of computational transaction
Raw Inputview raw input (R code)
Raw Outputview raw output of R engine
Computing time20 seconds
R Server'George Udny Yule' @ 72.249.76.132

\begin{tabular}{lllllllll}
\hline
Summary of computational transaction \tabularnewline
Raw Input & view raw input (R code)  \tabularnewline
Raw Output & view raw output of R engine  \tabularnewline
Computing time & 20 seconds \tabularnewline
R Server & 'George Udny Yule' @ 72.249.76.132 \tabularnewline
\hline
\end{tabular}
%Source: https://freestatistics.org/blog/index.php?pk=117020&T=0

[TABLE]
[ROW][C]Summary of computational transaction[/C][/ROW]
[ROW][C]Raw Input[/C][C]view raw input (R code) [/C][/ROW]
[ROW][C]Raw Output[/C][C]view raw output of R engine [/C][/ROW]
[ROW][C]Computing time[/C][C]20 seconds[/C][/ROW]
[ROW][C]R Server[/C][C]'George Udny Yule' @ 72.249.76.132[/C][/ROW]
[/TABLE]
Source: https://freestatistics.org/blog/index.php?pk=117020&T=0

Globally Unique Identifier (entire table): ba.freestatistics.org/blog/index.php?pk=117020&T=0

As an alternative you can also use a QR Code:  

The GUIDs for individual cells are displayed in the table below:

Summary of computational transaction
Raw Inputview raw input (R code)
Raw Outputview raw output of R engine
Computing time20 seconds
R Server'George Udny Yule' @ 72.249.76.132


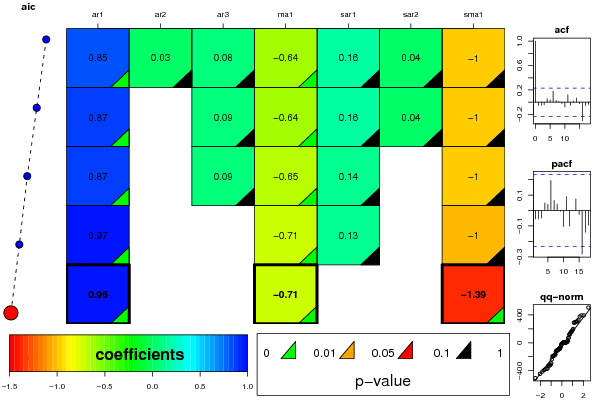
ARIMA Parameter Estimation and Backward Selection
Iterationar1ar2ar3ma1sar1sar2sma1
Estimates ( 1 )0.84750.02560.078-0.63790.16370.0433-0.9996
(p-val)(4e-04 )(0.8876 )(0.6171 )(6e-04 )(0.4391 )(0.8631 )(0.1614 )
Estimates ( 2 )0.866900.0864-0.6450.15620.0369-0.9997
(p-val)(0 )(NA )(0.5458 )(2e-04 )(0.4444 )(0.8805 )(0.159 )
Estimates ( 3 )0.871500.0853-0.6520.14080-0.9963
(p-val)(0 )(NA )(0.5472 )(1e-04 )(0.4197 )(NA )(0.2803 )
Estimates ( 4 )0.966100-0.71490.12680-1.0003
(p-val)(0 )(NA )(NA )(0 )(0.4583 )(NA )(0.3879 )
Estimates ( 5 )0.957400-0.706700-1.3886
(p-val)(0 )(NA )(NA )(0 )(NA )(NA )(0.0053 )
Estimates ( 6 )NANANANANANANA
(p-val)(NA )(NA )(NA )(NA )(NA )(NA )(NA )
Estimates ( 7 )NANANANANANANA
(p-val)(NA )(NA )(NA )(NA )(NA )(NA )(NA )
Estimates ( 8 )NANANANANANANA
(p-val)(NA )(NA )(NA )(NA )(NA )(NA )(NA )
Estimates ( 9 )NANANANANANANA
(p-val)(NA )(NA )(NA )(NA )(NA )(NA )(NA )
Estimates ( 10 )NANANANANANANA
(p-val)(NA )(NA )(NA )(NA )(NA )(NA )(NA )
Estimates ( 11 )NANANANANANANA
(p-val)(NA )(NA )(NA )(NA )(NA )(NA )(NA )
Estimates ( 12 )NANANANANANANA
(p-val)(NA )(NA )(NA )(NA )(NA )(NA )(NA )
Estimates ( 13 )NANANANANANANA
(p-val)(NA )(NA )(NA )(NA )(NA )(NA )(NA )

\begin{tabular}{lllllllll}
\hline
ARIMA Parameter Estimation and Backward Selection \tabularnewline
Iteration & ar1 & ar2 & ar3 & ma1 & sar1 & sar2 & sma1 \tabularnewline
Estimates ( 1 ) & 0.8475 & 0.0256 & 0.078 & -0.6379 & 0.1637 & 0.0433 & -0.9996 \tabularnewline
(p-val) & (4e-04 ) & (0.8876 ) & (0.6171 ) & (6e-04 ) & (0.4391 ) & (0.8631 ) & (0.1614 ) \tabularnewline
Estimates ( 2 ) & 0.8669 & 0 & 0.0864 & -0.645 & 0.1562 & 0.0369 & -0.9997 \tabularnewline
(p-val) & (0 ) & (NA ) & (0.5458 ) & (2e-04 ) & (0.4444 ) & (0.8805 ) & (0.159 ) \tabularnewline
Estimates ( 3 ) & 0.8715 & 0 & 0.0853 & -0.652 & 0.1408 & 0 & -0.9963 \tabularnewline
(p-val) & (0 ) & (NA ) & (0.5472 ) & (1e-04 ) & (0.4197 ) & (NA ) & (0.2803 ) \tabularnewline
Estimates ( 4 ) & 0.9661 & 0 & 0 & -0.7149 & 0.1268 & 0 & -1.0003 \tabularnewline
(p-val) & (0 ) & (NA ) & (NA ) & (0 ) & (0.4583 ) & (NA ) & (0.3879 ) \tabularnewline
Estimates ( 5 ) & 0.9574 & 0 & 0 & -0.7067 & 0 & 0 & -1.3886 \tabularnewline
(p-val) & (0 ) & (NA ) & (NA ) & (0 ) & (NA ) & (NA ) & (0.0053 ) \tabularnewline
Estimates ( 6 ) & NA & NA & NA & NA & NA & NA & NA \tabularnewline
(p-val) & (NA ) & (NA ) & (NA ) & (NA ) & (NA ) & (NA ) & (NA ) \tabularnewline
Estimates ( 7 ) & NA & NA & NA & NA & NA & NA & NA \tabularnewline
(p-val) & (NA ) & (NA ) & (NA ) & (NA ) & (NA ) & (NA ) & (NA ) \tabularnewline
Estimates ( 8 ) & NA & NA & NA & NA & NA & NA & NA \tabularnewline
(p-val) & (NA ) & (NA ) & (NA ) & (NA ) & (NA ) & (NA ) & (NA ) \tabularnewline
Estimates ( 9 ) & NA & NA & NA & NA & NA & NA & NA \tabularnewline
(p-val) & (NA ) & (NA ) & (NA ) & (NA ) & (NA ) & (NA ) & (NA ) \tabularnewline
Estimates ( 10 ) & NA & NA & NA & NA & NA & NA & NA \tabularnewline
(p-val) & (NA ) & (NA ) & (NA ) & (NA ) & (NA ) & (NA ) & (NA ) \tabularnewline
Estimates ( 11 ) & NA & NA & NA & NA & NA & NA & NA \tabularnewline
(p-val) & (NA ) & (NA ) & (NA ) & (NA ) & (NA ) & (NA ) & (NA ) \tabularnewline
Estimates ( 12 ) & NA & NA & NA & NA & NA & NA & NA \tabularnewline
(p-val) & (NA ) & (NA ) & (NA ) & (NA ) & (NA ) & (NA ) & (NA ) \tabularnewline
Estimates ( 13 ) & NA & NA & NA & NA & NA & NA & NA \tabularnewline
(p-val) & (NA ) & (NA ) & (NA ) & (NA ) & (NA ) & (NA ) & (NA ) \tabularnewline
\hline
\end{tabular}
%Source: https://freestatistics.org/blog/index.php?pk=117020&T=1

[TABLE]
[ROW][C]ARIMA Parameter Estimation and Backward Selection[/C][/ROW]
[ROW][C]Iteration[/C][C]ar1[/C][C]ar2[/C][C]ar3[/C][C]ma1[/C][C]sar1[/C][C]sar2[/C][C]sma1[/C][/ROW]
[ROW][C]Estimates ( 1 )[/C][C]0.8475[/C][C]0.0256[/C][C]0.078[/C][C]-0.6379[/C][C]0.1637[/C][C]0.0433[/C][C]-0.9996[/C][/ROW]
[ROW][C](p-val)[/C][C](4e-04 )[/C][C](0.8876 )[/C][C](0.6171 )[/C][C](6e-04 )[/C][C](0.4391 )[/C][C](0.8631 )[/C][C](0.1614 )[/C][/ROW]
[ROW][C]Estimates ( 2 )[/C][C]0.8669[/C][C]0[/C][C]0.0864[/C][C]-0.645[/C][C]0.1562[/C][C]0.0369[/C][C]-0.9997[/C][/ROW]
[ROW][C](p-val)[/C][C](0 )[/C][C](NA )[/C][C](0.5458 )[/C][C](2e-04 )[/C][C](0.4444 )[/C][C](0.8805 )[/C][C](0.159 )[/C][/ROW]
[ROW][C]Estimates ( 3 )[/C][C]0.8715[/C][C]0[/C][C]0.0853[/C][C]-0.652[/C][C]0.1408[/C][C]0[/C][C]-0.9963[/C][/ROW]
[ROW][C](p-val)[/C][C](0 )[/C][C](NA )[/C][C](0.5472 )[/C][C](1e-04 )[/C][C](0.4197 )[/C][C](NA )[/C][C](0.2803 )[/C][/ROW]
[ROW][C]Estimates ( 4 )[/C][C]0.9661[/C][C]0[/C][C]0[/C][C]-0.7149[/C][C]0.1268[/C][C]0[/C][C]-1.0003[/C][/ROW]
[ROW][C](p-val)[/C][C](0 )[/C][C](NA )[/C][C](NA )[/C][C](0 )[/C][C](0.4583 )[/C][C](NA )[/C][C](0.3879 )[/C][/ROW]
[ROW][C]Estimates ( 5 )[/C][C]0.9574[/C][C]0[/C][C]0[/C][C]-0.7067[/C][C]0[/C][C]0[/C][C]-1.3886[/C][/ROW]
[ROW][C](p-val)[/C][C](0 )[/C][C](NA )[/C][C](NA )[/C][C](0 )[/C][C](NA )[/C][C](NA )[/C][C](0.0053 )[/C][/ROW]
[ROW][C]Estimates ( 6 )[/C][C]NA[/C][C]NA[/C][C]NA[/C][C]NA[/C][C]NA[/C][C]NA[/C][C]NA[/C][/ROW]
[ROW][C](p-val)[/C][C](NA )[/C][C](NA )[/C][C](NA )[/C][C](NA )[/C][C](NA )[/C][C](NA )[/C][C](NA )[/C][/ROW]
[ROW][C]Estimates ( 7 )[/C][C]NA[/C][C]NA[/C][C]NA[/C][C]NA[/C][C]NA[/C][C]NA[/C][C]NA[/C][/ROW]
[ROW][C](p-val)[/C][C](NA )[/C][C](NA )[/C][C](NA )[/C][C](NA )[/C][C](NA )[/C][C](NA )[/C][C](NA )[/C][/ROW]
[ROW][C]Estimates ( 8 )[/C][C]NA[/C][C]NA[/C][C]NA[/C][C]NA[/C][C]NA[/C][C]NA[/C][C]NA[/C][/ROW]
[ROW][C](p-val)[/C][C](NA )[/C][C](NA )[/C][C](NA )[/C][C](NA )[/C][C](NA )[/C][C](NA )[/C][C](NA )[/C][/ROW]
[ROW][C]Estimates ( 9 )[/C][C]NA[/C][C]NA[/C][C]NA[/C][C]NA[/C][C]NA[/C][C]NA[/C][C]NA[/C][/ROW]
[ROW][C](p-val)[/C][C](NA )[/C][C](NA )[/C][C](NA )[/C][C](NA )[/C][C](NA )[/C][C](NA )[/C][C](NA )[/C][/ROW]
[ROW][C]Estimates ( 10 )[/C][C]NA[/C][C]NA[/C][C]NA[/C][C]NA[/C][C]NA[/C][C]NA[/C][C]NA[/C][/ROW]
[ROW][C](p-val)[/C][C](NA )[/C][C](NA )[/C][C](NA )[/C][C](NA )[/C][C](NA )[/C][C](NA )[/C][C](NA )[/C][/ROW]
[ROW][C]Estimates ( 11 )[/C][C]NA[/C][C]NA[/C][C]NA[/C][C]NA[/C][C]NA[/C][C]NA[/C][C]NA[/C][/ROW]
[ROW][C](p-val)[/C][C](NA )[/C][C](NA )[/C][C](NA )[/C][C](NA )[/C][C](NA )[/C][C](NA )[/C][C](NA )[/C][/ROW]
[ROW][C]Estimates ( 12 )[/C][C]NA[/C][C]NA[/C][C]NA[/C][C]NA[/C][C]NA[/C][C]NA[/C][C]NA[/C][/ROW]
[ROW][C](p-val)[/C][C](NA )[/C][C](NA )[/C][C](NA )[/C][C](NA )[/C][C](NA )[/C][C](NA )[/C][C](NA )[/C][/ROW]
[ROW][C]Estimates ( 13 )[/C][C]NA[/C][C]NA[/C][C]NA[/C][C]NA[/C][C]NA[/C][C]NA[/C][C]NA[/C][/ROW]
[ROW][C](p-val)[/C][C](NA )[/C][C](NA )[/C][C](NA )[/C][C](NA )[/C][C](NA )[/C][C](NA )[/C][C](NA )[/C][/ROW]
[/TABLE]
Source: https://freestatistics.org/blog/index.php?pk=117020&T=1

Globally Unique Identifier (entire table): ba.freestatistics.org/blog/index.php?pk=117020&T=1

As an alternative you can also use a QR Code:  

The GUIDs for individual cells are displayed in the table below:

ARIMA Parameter Estimation and Backward Selection
Iterationar1ar2ar3ma1sar1sar2sma1
Estimates ( 1 )0.84750.02560.078-0.63790.16370.0433-0.9996
(p-val)(4e-04 )(0.8876 )(0.6171 )(6e-04 )(0.4391 )(0.8631 )(0.1614 )
Estimates ( 2 )0.866900.0864-0.6450.15620.0369-0.9997
(p-val)(0 )(NA )(0.5458 )(2e-04 )(0.4444 )(0.8805 )(0.159 )
Estimates ( 3 )0.871500.0853-0.6520.14080-0.9963
(p-val)(0 )(NA )(0.5472 )(1e-04 )(0.4197 )(NA )(0.2803 )
Estimates ( 4 )0.966100-0.71490.12680-1.0003
(p-val)(0 )(NA )(NA )(0 )(0.4583 )(NA )(0.3879 )
Estimates ( 5 )0.957400-0.706700-1.3886
(p-val)(0 )(NA )(NA )(0 )(NA )(NA )(0.0053 )
Estimates ( 6 )NANANANANANANA
(p-val)(NA )(NA )(NA )(NA )(NA )(NA )(NA )
Estimates ( 7 )NANANANANANANA
(p-val)(NA )(NA )(NA )(NA )(NA )(NA )(NA )
Estimates ( 8 )NANANANANANANA
(p-val)(NA )(NA )(NA )(NA )(NA )(NA )(NA )
Estimates ( 9 )NANANANANANANA
(p-val)(NA )(NA )(NA )(NA )(NA )(NA )(NA )
Estimates ( 10 )NANANANANANANA
(p-val)(NA )(NA )(NA )(NA )(NA )(NA )(NA )
Estimates ( 11 )NANANANANANANA
(p-val)(NA )(NA )(NA )(NA )(NA )(NA )(NA )
Estimates ( 12 )NANANANANANANA
(p-val)(NA )(NA )(NA )(NA )(NA )(NA )(NA )
Estimates ( 13 )NANANANANANANA
(p-val)(NA )(NA )(NA )(NA )(NA )(NA )(NA )


Estimated ARIMA Residuals
Value
-85.9957000216453
70.2510795229658
-0.0143861484705009
118.867846417388
75.0433049678085
-392.414837072862
-313.156041993909
-293.511566005601
505.456924205591
-412.732340459047
-122.705294323676
-193.100521414426
148.879309036302
-320.273405329754
-329.159545176645
-55.0390893542287
-89.4564001987583
-445.563692332315
294.936185519017
-371.834328314559
-369.906611724626
289.687015177511
158.066896280805
327.629752821995
-237.342936512439
-177.650979931292
-20.652744827425
168.297359071538
-165.451546975652
300.122755739604
-106.332005408641
-194.488411687466
197.918103199237
15.7601664266127
133.142607633855
391.722815488302
392.28906750519
32.6442830376096
183.644017159469
-377.985307724636
-112.077224664284
308.716251671379
-83.1253255493116
-68.1424837517489
-184.627202902232
-13.2056410802046
-116.013573627134
374.628375322428
-328.454819360483
-92.902190601703
-172.205814477346
-188.23776341911
-108.810223876208
122.663449389041
287.129624300427
-108.966708695014
-507.833860766208
-30.6566638618051
-83.794511561325

\begin{tabular}{lllllllll}
\hline
Estimated ARIMA Residuals \tabularnewline
Value \tabularnewline
-85.9957000216453 \tabularnewline
70.2510795229658 \tabularnewline
-0.0143861484705009 \tabularnewline
118.867846417388 \tabularnewline
75.0433049678085 \tabularnewline
-392.414837072862 \tabularnewline
-313.156041993909 \tabularnewline
-293.511566005601 \tabularnewline
505.456924205591 \tabularnewline
-412.732340459047 \tabularnewline
-122.705294323676 \tabularnewline
-193.100521414426 \tabularnewline
148.879309036302 \tabularnewline
-320.273405329754 \tabularnewline
-329.159545176645 \tabularnewline
-55.0390893542287 \tabularnewline
-89.4564001987583 \tabularnewline
-445.563692332315 \tabularnewline
294.936185519017 \tabularnewline
-371.834328314559 \tabularnewline
-369.906611724626 \tabularnewline
289.687015177511 \tabularnewline
158.066896280805 \tabularnewline
327.629752821995 \tabularnewline
-237.342936512439 \tabularnewline
-177.650979931292 \tabularnewline
-20.652744827425 \tabularnewline
168.297359071538 \tabularnewline
-165.451546975652 \tabularnewline
300.122755739604 \tabularnewline
-106.332005408641 \tabularnewline
-194.488411687466 \tabularnewline
197.918103199237 \tabularnewline
15.7601664266127 \tabularnewline
133.142607633855 \tabularnewline
391.722815488302 \tabularnewline
392.28906750519 \tabularnewline
32.6442830376096 \tabularnewline
183.644017159469 \tabularnewline
-377.985307724636 \tabularnewline
-112.077224664284 \tabularnewline
308.716251671379 \tabularnewline
-83.1253255493116 \tabularnewline
-68.1424837517489 \tabularnewline
-184.627202902232 \tabularnewline
-13.2056410802046 \tabularnewline
-116.013573627134 \tabularnewline
374.628375322428 \tabularnewline
-328.454819360483 \tabularnewline
-92.902190601703 \tabularnewline
-172.205814477346 \tabularnewline
-188.23776341911 \tabularnewline
-108.810223876208 \tabularnewline
122.663449389041 \tabularnewline
287.129624300427 \tabularnewline
-108.966708695014 \tabularnewline
-507.833860766208 \tabularnewline
-30.6566638618051 \tabularnewline
-83.794511561325 \tabularnewline
\hline
\end{tabular}
%Source: https://freestatistics.org/blog/index.php?pk=117020&T=2

[TABLE]
[ROW][C]Estimated ARIMA Residuals[/C][/ROW]
[ROW][C]Value[/C][/ROW]
[ROW][C]-85.9957000216453[/C][/ROW]
[ROW][C]70.2510795229658[/C][/ROW]
[ROW][C]-0.0143861484705009[/C][/ROW]
[ROW][C]118.867846417388[/C][/ROW]
[ROW][C]75.0433049678085[/C][/ROW]
[ROW][C]-392.414837072862[/C][/ROW]
[ROW][C]-313.156041993909[/C][/ROW]
[ROW][C]-293.511566005601[/C][/ROW]
[ROW][C]505.456924205591[/C][/ROW]
[ROW][C]-412.732340459047[/C][/ROW]
[ROW][C]-122.705294323676[/C][/ROW]
[ROW][C]-193.100521414426[/C][/ROW]
[ROW][C]148.879309036302[/C][/ROW]
[ROW][C]-320.273405329754[/C][/ROW]
[ROW][C]-329.159545176645[/C][/ROW]
[ROW][C]-55.0390893542287[/C][/ROW]
[ROW][C]-89.4564001987583[/C][/ROW]
[ROW][C]-445.563692332315[/C][/ROW]
[ROW][C]294.936185519017[/C][/ROW]
[ROW][C]-371.834328314559[/C][/ROW]
[ROW][C]-369.906611724626[/C][/ROW]
[ROW][C]289.687015177511[/C][/ROW]
[ROW][C]158.066896280805[/C][/ROW]
[ROW][C]327.629752821995[/C][/ROW]
[ROW][C]-237.342936512439[/C][/ROW]
[ROW][C]-177.650979931292[/C][/ROW]
[ROW][C]-20.652744827425[/C][/ROW]
[ROW][C]168.297359071538[/C][/ROW]
[ROW][C]-165.451546975652[/C][/ROW]
[ROW][C]300.122755739604[/C][/ROW]
[ROW][C]-106.332005408641[/C][/ROW]
[ROW][C]-194.488411687466[/C][/ROW]
[ROW][C]197.918103199237[/C][/ROW]
[ROW][C]15.7601664266127[/C][/ROW]
[ROW][C]133.142607633855[/C][/ROW]
[ROW][C]391.722815488302[/C][/ROW]
[ROW][C]392.28906750519[/C][/ROW]
[ROW][C]32.6442830376096[/C][/ROW]
[ROW][C]183.644017159469[/C][/ROW]
[ROW][C]-377.985307724636[/C][/ROW]
[ROW][C]-112.077224664284[/C][/ROW]
[ROW][C]308.716251671379[/C][/ROW]
[ROW][C]-83.1253255493116[/C][/ROW]
[ROW][C]-68.1424837517489[/C][/ROW]
[ROW][C]-184.627202902232[/C][/ROW]
[ROW][C]-13.2056410802046[/C][/ROW]
[ROW][C]-116.013573627134[/C][/ROW]
[ROW][C]374.628375322428[/C][/ROW]
[ROW][C]-328.454819360483[/C][/ROW]
[ROW][C]-92.902190601703[/C][/ROW]
[ROW][C]-172.205814477346[/C][/ROW]
[ROW][C]-188.23776341911[/C][/ROW]
[ROW][C]-108.810223876208[/C][/ROW]
[ROW][C]122.663449389041[/C][/ROW]
[ROW][C]287.129624300427[/C][/ROW]
[ROW][C]-108.966708695014[/C][/ROW]
[ROW][C]-507.833860766208[/C][/ROW]
[ROW][C]-30.6566638618051[/C][/ROW]
[ROW][C]-83.794511561325[/C][/ROW]
[/TABLE]
Source: https://freestatistics.org/blog/index.php?pk=117020&T=2

Globally Unique Identifier (entire table): ba.freestatistics.org/blog/index.php?pk=117020&T=2

As an alternative you can also use a QR Code:  

The GUIDs for individual cells are displayed in the table below:

Estimated ARIMA Residuals
Value
-85.9957000216453
70.2510795229658
-0.0143861484705009
118.867846417388
75.0433049678085
-392.414837072862
-313.156041993909
-293.511566005601
505.456924205591
-412.732340459047
-122.705294323676
-193.100521414426
148.879309036302
-320.273405329754
-329.159545176645
-55.0390893542287
-89.4564001987583
-445.563692332315
294.936185519017
-371.834328314559
-369.906611724626
289.687015177511
158.066896280805
327.629752821995
-237.342936512439
-177.650979931292
-20.652744827425
168.297359071538
-165.451546975652
300.122755739604
-106.332005408641
-194.488411687466
197.918103199237
15.7601664266127
133.142607633855
391.722815488302
392.28906750519
32.6442830376096
183.644017159469
-377.985307724636
-112.077224664284
308.716251671379
-83.1253255493116
-68.1424837517489
-184.627202902232
-13.2056410802046
-116.013573627134
374.628375322428
-328.454819360483
-92.902190601703
-172.205814477346
-188.23776341911
-108.810223876208
122.663449389041
287.129624300427
-108.966708695014
-507.833860766208
-30.6566638618051
-83.794511561325


Parameters (Session):
par1 = 1 ; par2 = 1 ; par3 = 0 ; par4 = 12 ;
Parameters (R input):
par1 = FALSE ; par2 = 1 ; par3 = 1 ; par4 = 1 ; par5 = 12 ; par6 = 3 ; par7 = 1 ; par8 = 2 ; par9 = 1 ;
R code (references can be found in the software module):
library(lattice)
if (par1 == 'TRUE') par1 <- TRUE
if (par1 == 'FALSE') par1 <- FALSE
par2 <- as.numeric(par2) #Box-Cox lambda transformation parameter
par3 <- as.numeric(par3) #degree of non-seasonal differencing
par4 <- as.numeric(par4) #degree of seasonal differencing
par5 <- as.numeric(par5) #seasonal period
par6 <- as.numeric(par6) #degree (p) of the non-seasonal AR(p) polynomial
par7 <- as.numeric(par7) #degree (q) of the non-seasonal MA(q) polynomial
par8 <- as.numeric(par8) #degree (P) of the seasonal AR(P) polynomial
par9 <- as.numeric(par9) #degree (Q) of the seasonal MA(Q) polynomial
armaGR <- function(arima.out, names, n){
try1 <- arima.out$coef
try2 <- sqrt(diag(arima.out$var.coef))
try.data.frame <- data.frame(matrix(NA,ncol=4,nrow=length(names)))
dimnames(try.data.frame) <- list(names,c('coef','std','tstat','pv'))
try.data.frame[,1] <- try1
for(i in 1:length(try2)) try.data.frame[which(rownames(try.data.frame)==names(try2)[i]),2] <- try2[i]
try.data.frame[,3] <- try.data.frame[,1] / try.data.frame[,2]
try.data.frame[,4] <- round((1-pt(abs(try.data.frame[,3]),df=n-(length(try2)+1)))*2,5)
vector <- rep(NA,length(names))
vector[is.na(try.data.frame[,4])] <- 0
maxi <- which.max(try.data.frame[,4])
continue <- max(try.data.frame[,4],na.rm=TRUE) > .05
vector[maxi] <- 0
list(summary=try.data.frame,next.vector=vector,continue=continue)
}
arimaSelect <- function(series, order=c(13,0,0), seasonal=list(order=c(2,0,0),period=12), include.mean=F){
nrc <- order[1]+order[3]+seasonal$order[1]+seasonal$order[3]
coeff <- matrix(NA, nrow=nrc*2, ncol=nrc)
pval <- matrix(NA, nrow=nrc*2, ncol=nrc)
mylist <- rep(list(NULL), nrc)
names <- NULL
if(order[1] > 0) names <- paste('ar',1:order[1],sep='')
if(order[3] > 0) names <- c( names , paste('ma',1:order[3],sep='') )
if(seasonal$order[1] > 0) names <- c(names, paste('sar',1:seasonal$order[1],sep=''))
if(seasonal$order[3] > 0) names <- c(names, paste('sma',1:seasonal$order[3],sep=''))
arima.out <- arima(series, order=order, seasonal=seasonal, include.mean=include.mean, method='ML')
mylist[[1]] <- arima.out
last.arma <- armaGR(arima.out, names, length(series))
mystop <- FALSE
i <- 1
coeff[i,] <- last.arma[[1]][,1]
pval [i,] <- last.arma[[1]][,4]
i <- 2
aic <- arima.out$aic
while(!mystop){
mylist[[i]] <- arima.out
arima.out <- arima(series, order=order, seasonal=seasonal, include.mean=include.mean, method='ML', fixed=last.arma$next.vector)
aic <- c(aic, arima.out$aic)
last.arma <- armaGR(arima.out, names, length(series))
mystop <- !last.arma$continue
coeff[i,] <- last.arma[[1]][,1]
pval [i,] <- last.arma[[1]][,4]
i <- i+1
}
list(coeff, pval, mylist, aic=aic)
}
arimaSelectplot <- function(arimaSelect.out,noms,choix){
noms <- names(arimaSelect.out[[3]][[1]]$coef)
coeff <- arimaSelect.out[[1]]
k <- min(which(is.na(coeff[,1])))-1
coeff <- coeff[1:k,]
pval <- arimaSelect.out[[2]][1:k,]
aic <- arimaSelect.out$aic[1:k]
coeff[coeff==0] <- NA
n <- ncol(coeff)
if(missing(choix)) choix <- k
layout(matrix(c(1,1,1,2,
3,3,3,2,
3,3,3,4,
5,6,7,7),nr=4),
widths=c(10,35,45,15),
heights=c(30,30,15,15))
couleurs <- rainbow(75)[1:50]#(50)
ticks <- pretty(coeff)
par(mar=c(1,1,3,1))
plot(aic,k:1-.5,type='o',pch=21,bg='blue',cex=2,axes=F,lty=2,xpd=NA)
points(aic[choix],k-choix+.5,pch=21,cex=4,bg=2,xpd=NA)
title('aic',line=2)
par(mar=c(3,0,0,0))
plot(0,axes=F,xlab='',ylab='',xlim=range(ticks),ylim=c(.1,1))
rect(xleft = min(ticks) + (0:49)/50*(max(ticks)-min(ticks)),
xright = min(ticks) + (1:50)/50*(max(ticks)-min(ticks)),
ytop = rep(1,50),
ybottom= rep(0,50),col=couleurs,border=NA)
axis(1,ticks)
rect(xleft=min(ticks),xright=max(ticks),ytop=1,ybottom=0)
text(mean(coeff,na.rm=T),.5,'coefficients',cex=2,font=2)
par(mar=c(1,1,3,1))
image(1:n,1:k,t(coeff[k:1,]),axes=F,col=couleurs,zlim=range(ticks))
for(i in 1:n) for(j in 1:k) if(!is.na(coeff[j,i])) {
if(pval[j,i]<.01) symb = 'green'
else if( (pval[j,i]<.05) & (pval[j,i]>=.01)) symb = 'orange'
else if( (pval[j,i]<.1) & (pval[j,i]>=.05)) symb = 'red'
else symb = 'black'
polygon(c(i+.5 ,i+.2 ,i+.5 ,i+.5),
c(k-j+0.5,k-j+0.5,k-j+0.8,k-j+0.5),
col=symb)
if(j==choix) {
rect(xleft=i-.5,
xright=i+.5,
ybottom=k-j+1.5,
ytop=k-j+.5,
lwd=4)
text(i,
k-j+1,
round(coeff[j,i],2),
cex=1.2,
font=2)
}
else{
rect(xleft=i-.5,xright=i+.5,ybottom=k-j+1.5,ytop=k-j+.5)
text(i,k-j+1,round(coeff[j,i],2),cex=1.2,font=1)
}
}
axis(3,1:n,noms)
par(mar=c(0.5,0,0,0.5))
plot(0,axes=F,xlab='',ylab='',type='n',xlim=c(0,8),ylim=c(-.2,.8))
cols <- c('green','orange','red','black')
niv <- c('0','0.01','0.05','0.1')
for(i in 0:3){
polygon(c(1+2*i ,1+2*i ,1+2*i-.5 ,1+2*i),
c(.4 ,.7 , .4 , .4),
col=cols[i+1])
text(2*i,0.5,niv[i+1],cex=1.5)
}
text(8,.5,1,cex=1.5)
text(4,0,'p-value',cex=2)
box()
residus <- arimaSelect.out[[3]][[choix]]$res
par(mar=c(1,2,4,1))
acf(residus,main='')
title('acf',line=.5)
par(mar=c(1,2,4,1))
pacf(residus,main='')
title('pacf',line=.5)
par(mar=c(2,2,4,1))
qqnorm(residus,main='')
title('qq-norm',line=.5)
qqline(residus)
residus
}
if (par2 == 0) x <- log(x)
if (par2 != 0) x <- x^par2
(selection <- arimaSelect(x, order=c(par6,par3,par7), seasonal=list(order=c(par8,par4,par9), period=par5)))
bitmap(file='test1.png')
resid <- arimaSelectplot(selection)
dev.off()
resid
bitmap(file='test2.png')
acf(resid,length(resid)/2, main='Residual Autocorrelation Function')
dev.off()
bitmap(file='test3.png')
pacf(resid,length(resid)/2, main='Residual Partial Autocorrelation Function')
dev.off()
bitmap(file='test4.png')
cpgram(resid, main='Residual Cumulative Periodogram')
dev.off()
bitmap(file='test5.png')
hist(resid, main='Residual Histogram', xlab='values of Residuals')
dev.off()
bitmap(file='test6.png')
densityplot(~resid,col='black',main='Residual Density Plot', xlab='values of Residuals')
dev.off()
bitmap(file='test7.png')
qqnorm(resid, main='Residual Normal Q-Q Plot')
qqline(resid)
dev.off()
ncols <- length(selection[[1]][1,])
nrows <- length(selection[[2]][,1])-1
load(file='createtable')
a<-table.start()
a<-table.row.start(a)
a<-table.element(a,'ARIMA Parameter Estimation and Backward Selection', ncols+1,TRUE)
a<-table.row.end(a)
a<-table.row.start(a)
a<-table.element(a,'Iteration', header=TRUE)
for (i in 1:ncols) {
a<-table.element(a,names(selection[[3]][[1]]$coef)[i],header=TRUE)
}
a<-table.row.end(a)
for (j in 1:nrows) {
a<-table.row.start(a)
mydum <- 'Estimates ('
mydum <- paste(mydum,j)
mydum <- paste(mydum,')')
a<-table.element(a,mydum, header=TRUE)
for (i in 1:ncols) {
a<-table.element(a,round(selection[[1]][j,i],4))
}
a<-table.row.end(a)
a<-table.row.start(a)
a<-table.element(a,'(p-val)', header=TRUE)
for (i in 1:ncols) {
mydum <- '('
mydum <- paste(mydum,round(selection[[2]][j,i],4),sep='')
mydum <- paste(mydum,')')
a<-table.element(a,mydum)
}
a<-table.row.end(a)
}
a<-table.end(a)
table.save(a,file='mytable.tab')
a<-table.start()
a<-table.row.start(a)
a<-table.element(a,'Estimated ARIMA Residuals', 1,TRUE)
a<-table.row.end(a)
a<-table.row.start(a)
a<-table.element(a,'Value', 1,TRUE)
a<-table.row.end(a)
for (i in (par4*par5+par3):length(resid)) {
a<-table.row.start(a)
a<-table.element(a,resid[i])
a<-table.row.end(a)
}
a<-table.end(a)
table.save(a,file='mytable1.tab')