Free Statistics

of Irreproducible Research!

Author's title

Author*The author of this computation has been verified*
R Software Modulerwasp_autocorrelation.wasp
Title produced by software(Partial) Autocorrelation Function
Date of computationWed, 29 Dec 2010 18:02:06 +0000
Cite this page as followsStatistical Computations at FreeStatistics.org, Office for Research Development and Education, URL https://freestatistics.org/blog/index.php?v=date/2010/Dec/29/t1293645701996ejqbop7cs02d.htm/, Retrieved Fri, 03 May 2024 14:00:16 +0000
Statistical Computations at FreeStatistics.org, Office for Research Development and Education, URL https://freestatistics.org/blog/index.php?pk=117008, Retrieved Fri, 03 May 2024 14:00:16 +0000
QR Codes:

Original text written by user:
IsPrivate?No (this computation is public)
User-defined keywords
Estimated Impact88
Family? (F = Feedback message, R = changed R code, M = changed R Module, P = changed Parameters, D = changed Data)
-       [(Partial) Autocorrelation Function] [autocorrelation(D=1)] [2010-12-29 18:02:06] [76d5107cfd0c78d23318a36a1ce43bff] [Current]
- RM      [(Partial) Autocorrelation Function] [] [2011-12-21 19:51:40] [3931071255a6f7f4a767409781cc5f7d]
Feedback Forum

Post a new message
Dataseries X:
5.921
4.561
4.399
4.249
4.211
4.081
4.131
4.071
3.841
4.109
4.354
4.402
4.954
4.137
4.561
4.210
4.429
4.190
4.196
4.226
3.878
3.931
4.115
4.679
5.385
4.387
4.552
4.325
4.179
4.054
4.075
4.147
4.046
4.368
4.097
4.821
4.965
4.425
4.601
4.521
4.193
4.039
4.099
4.109
4.024
4.245
4.252
5.136
5.037
4.230
4.408
4.119
4.083
4.010
4.148
3.952
3.843
4.164
4.075
4.708


Summary of computational transaction
Raw Inputview raw input (R code)
Raw Outputview raw output of R engine
Computing time1 seconds
R Server'Gwilym Jenkins' @ www.wessa.org

\begin{tabular}{lllllllll}
\hline
Summary of computational transaction \tabularnewline
Raw Input & view raw input (R code)  \tabularnewline
Raw Output & view raw output of R engine  \tabularnewline
Computing time & 1 seconds \tabularnewline
R Server & 'Gwilym Jenkins' @ www.wessa.org \tabularnewline
\hline
\end{tabular}
%Source: https://freestatistics.org/blog/index.php?pk=117008&T=0

[TABLE]
[ROW][C]Summary of computational transaction[/C][/ROW]
[ROW][C]Raw Input[/C][C]view raw input (R code) [/C][/ROW]
[ROW][C]Raw Output[/C][C]view raw output of R engine [/C][/ROW]
[ROW][C]Computing time[/C][C]1 seconds[/C][/ROW]
[ROW][C]R Server[/C][C]'Gwilym Jenkins' @ www.wessa.org[/C][/ROW]
[/TABLE]
Source: https://freestatistics.org/blog/index.php?pk=117008&T=0

Globally Unique Identifier (entire table): ba.freestatistics.org/blog/index.php?pk=117008&T=0

As an alternative you can also use a QR Code:  

The GUIDs for individual cells are displayed in the table below:

Summary of computational transaction
Raw Inputview raw input (R code)
Raw Outputview raw output of R engine
Computing time1 seconds
R Server'Gwilym Jenkins' @ www.wessa.org


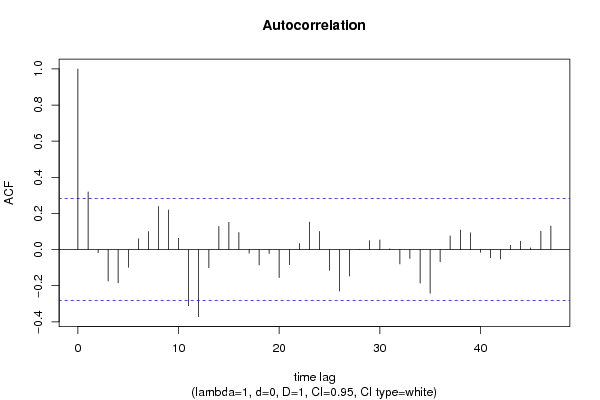
Autocorrelation Function
Time lag kACF(k)T-STATP-value
10.3188242.20890.015995
2-0.017178-0.1190.452881
3-0.174135-1.20640.11678
4-0.184476-1.27810.103682
5-0.098249-0.68070.24967
60.0591040.40950.342002
70.0992940.68790.247405
80.2387581.65420.05231
90.2186851.51510.068154
100.0618820.42870.335019
11-0.310787-2.15320.018178
12-0.371558-2.57420.006594
13-0.100157-0.69390.245543
140.1281540.88790.189517
150.1510071.04620.150352
160.0942430.65290.258457
17-0.020485-0.14190.443866
18-0.08487-0.5880.279646
19-0.021895-0.15170.440033
20-0.154827-1.07270.14439
21-0.084322-0.58420.280911
220.0338130.23430.407888
230.1520831.05370.148657
240.1004550.6960.2449
25-0.115325-0.7990.214115
26-0.229403-1.58940.059273
27-0.146267-1.01340.157984
280.000320.00220.49912
290.0500880.3470.365048
300.0534010.370.356514
310.0042940.02980.488195
32-0.079892-0.55350.291243
33-0.049286-0.34150.367123
34-0.185689-1.28650.102221
35-0.242111-1.67740.049983
36-0.06772-0.46920.320533
370.0756920.52440.301204
380.1077190.74630.229564
390.0929460.64390.261338
40-0.015601-0.10810.457187
41-0.045461-0.3150.377078
42-0.051978-0.36010.36017
430.0236030.16350.435396
440.0465580.32260.374214
450.0088620.06140.475648
460.1019510.70630.241696
470.1299360.90020.186247
48NANANA

\begin{tabular}{lllllllll}
\hline
Autocorrelation Function \tabularnewline
Time lag k & ACF(k) & T-STAT & P-value \tabularnewline
1 & 0.318824 & 2.2089 & 0.015995 \tabularnewline
2 & -0.017178 & -0.119 & 0.452881 \tabularnewline
3 & -0.174135 & -1.2064 & 0.11678 \tabularnewline
4 & -0.184476 & -1.2781 & 0.103682 \tabularnewline
5 & -0.098249 & -0.6807 & 0.24967 \tabularnewline
6 & 0.059104 & 0.4095 & 0.342002 \tabularnewline
7 & 0.099294 & 0.6879 & 0.247405 \tabularnewline
8 & 0.238758 & 1.6542 & 0.05231 \tabularnewline
9 & 0.218685 & 1.5151 & 0.068154 \tabularnewline
10 & 0.061882 & 0.4287 & 0.335019 \tabularnewline
11 & -0.310787 & -2.1532 & 0.018178 \tabularnewline
12 & -0.371558 & -2.5742 & 0.006594 \tabularnewline
13 & -0.100157 & -0.6939 & 0.245543 \tabularnewline
14 & 0.128154 & 0.8879 & 0.189517 \tabularnewline
15 & 0.151007 & 1.0462 & 0.150352 \tabularnewline
16 & 0.094243 & 0.6529 & 0.258457 \tabularnewline
17 & -0.020485 & -0.1419 & 0.443866 \tabularnewline
18 & -0.08487 & -0.588 & 0.279646 \tabularnewline
19 & -0.021895 & -0.1517 & 0.440033 \tabularnewline
20 & -0.154827 & -1.0727 & 0.14439 \tabularnewline
21 & -0.084322 & -0.5842 & 0.280911 \tabularnewline
22 & 0.033813 & 0.2343 & 0.407888 \tabularnewline
23 & 0.152083 & 1.0537 & 0.148657 \tabularnewline
24 & 0.100455 & 0.696 & 0.2449 \tabularnewline
25 & -0.115325 & -0.799 & 0.214115 \tabularnewline
26 & -0.229403 & -1.5894 & 0.059273 \tabularnewline
27 & -0.146267 & -1.0134 & 0.157984 \tabularnewline
28 & 0.00032 & 0.0022 & 0.49912 \tabularnewline
29 & 0.050088 & 0.347 & 0.365048 \tabularnewline
30 & 0.053401 & 0.37 & 0.356514 \tabularnewline
31 & 0.004294 & 0.0298 & 0.488195 \tabularnewline
32 & -0.079892 & -0.5535 & 0.291243 \tabularnewline
33 & -0.049286 & -0.3415 & 0.367123 \tabularnewline
34 & -0.185689 & -1.2865 & 0.102221 \tabularnewline
35 & -0.242111 & -1.6774 & 0.049983 \tabularnewline
36 & -0.06772 & -0.4692 & 0.320533 \tabularnewline
37 & 0.075692 & 0.5244 & 0.301204 \tabularnewline
38 & 0.107719 & 0.7463 & 0.229564 \tabularnewline
39 & 0.092946 & 0.6439 & 0.261338 \tabularnewline
40 & -0.015601 & -0.1081 & 0.457187 \tabularnewline
41 & -0.045461 & -0.315 & 0.377078 \tabularnewline
42 & -0.051978 & -0.3601 & 0.36017 \tabularnewline
43 & 0.023603 & 0.1635 & 0.435396 \tabularnewline
44 & 0.046558 & 0.3226 & 0.374214 \tabularnewline
45 & 0.008862 & 0.0614 & 0.475648 \tabularnewline
46 & 0.101951 & 0.7063 & 0.241696 \tabularnewline
47 & 0.129936 & 0.9002 & 0.186247 \tabularnewline
48 & NA & NA & NA \tabularnewline
\hline
\end{tabular}
%Source: https://freestatistics.org/blog/index.php?pk=117008&T=1

[TABLE]
[ROW][C]Autocorrelation Function[/C][/ROW]
[ROW][C]Time lag k[/C][C]ACF(k)[/C][C]T-STAT[/C][C]P-value[/C][/ROW]
[ROW][C]1[/C][C]0.318824[/C][C]2.2089[/C][C]0.015995[/C][/ROW]
[ROW][C]2[/C][C]-0.017178[/C][C]-0.119[/C][C]0.452881[/C][/ROW]
[ROW][C]3[/C][C]-0.174135[/C][C]-1.2064[/C][C]0.11678[/C][/ROW]
[ROW][C]4[/C][C]-0.184476[/C][C]-1.2781[/C][C]0.103682[/C][/ROW]
[ROW][C]5[/C][C]-0.098249[/C][C]-0.6807[/C][C]0.24967[/C][/ROW]
[ROW][C]6[/C][C]0.059104[/C][C]0.4095[/C][C]0.342002[/C][/ROW]
[ROW][C]7[/C][C]0.099294[/C][C]0.6879[/C][C]0.247405[/C][/ROW]
[ROW][C]8[/C][C]0.238758[/C][C]1.6542[/C][C]0.05231[/C][/ROW]
[ROW][C]9[/C][C]0.218685[/C][C]1.5151[/C][C]0.068154[/C][/ROW]
[ROW][C]10[/C][C]0.061882[/C][C]0.4287[/C][C]0.335019[/C][/ROW]
[ROW][C]11[/C][C]-0.310787[/C][C]-2.1532[/C][C]0.018178[/C][/ROW]
[ROW][C]12[/C][C]-0.371558[/C][C]-2.5742[/C][C]0.006594[/C][/ROW]
[ROW][C]13[/C][C]-0.100157[/C][C]-0.6939[/C][C]0.245543[/C][/ROW]
[ROW][C]14[/C][C]0.128154[/C][C]0.8879[/C][C]0.189517[/C][/ROW]
[ROW][C]15[/C][C]0.151007[/C][C]1.0462[/C][C]0.150352[/C][/ROW]
[ROW][C]16[/C][C]0.094243[/C][C]0.6529[/C][C]0.258457[/C][/ROW]
[ROW][C]17[/C][C]-0.020485[/C][C]-0.1419[/C][C]0.443866[/C][/ROW]
[ROW][C]18[/C][C]-0.08487[/C][C]-0.588[/C][C]0.279646[/C][/ROW]
[ROW][C]19[/C][C]-0.021895[/C][C]-0.1517[/C][C]0.440033[/C][/ROW]
[ROW][C]20[/C][C]-0.154827[/C][C]-1.0727[/C][C]0.14439[/C][/ROW]
[ROW][C]21[/C][C]-0.084322[/C][C]-0.5842[/C][C]0.280911[/C][/ROW]
[ROW][C]22[/C][C]0.033813[/C][C]0.2343[/C][C]0.407888[/C][/ROW]
[ROW][C]23[/C][C]0.152083[/C][C]1.0537[/C][C]0.148657[/C][/ROW]
[ROW][C]24[/C][C]0.100455[/C][C]0.696[/C][C]0.2449[/C][/ROW]
[ROW][C]25[/C][C]-0.115325[/C][C]-0.799[/C][C]0.214115[/C][/ROW]
[ROW][C]26[/C][C]-0.229403[/C][C]-1.5894[/C][C]0.059273[/C][/ROW]
[ROW][C]27[/C][C]-0.146267[/C][C]-1.0134[/C][C]0.157984[/C][/ROW]
[ROW][C]28[/C][C]0.00032[/C][C]0.0022[/C][C]0.49912[/C][/ROW]
[ROW][C]29[/C][C]0.050088[/C][C]0.347[/C][C]0.365048[/C][/ROW]
[ROW][C]30[/C][C]0.053401[/C][C]0.37[/C][C]0.356514[/C][/ROW]
[ROW][C]31[/C][C]0.004294[/C][C]0.0298[/C][C]0.488195[/C][/ROW]
[ROW][C]32[/C][C]-0.079892[/C][C]-0.5535[/C][C]0.291243[/C][/ROW]
[ROW][C]33[/C][C]-0.049286[/C][C]-0.3415[/C][C]0.367123[/C][/ROW]
[ROW][C]34[/C][C]-0.185689[/C][C]-1.2865[/C][C]0.102221[/C][/ROW]
[ROW][C]35[/C][C]-0.242111[/C][C]-1.6774[/C][C]0.049983[/C][/ROW]
[ROW][C]36[/C][C]-0.06772[/C][C]-0.4692[/C][C]0.320533[/C][/ROW]
[ROW][C]37[/C][C]0.075692[/C][C]0.5244[/C][C]0.301204[/C][/ROW]
[ROW][C]38[/C][C]0.107719[/C][C]0.7463[/C][C]0.229564[/C][/ROW]
[ROW][C]39[/C][C]0.092946[/C][C]0.6439[/C][C]0.261338[/C][/ROW]
[ROW][C]40[/C][C]-0.015601[/C][C]-0.1081[/C][C]0.457187[/C][/ROW]
[ROW][C]41[/C][C]-0.045461[/C][C]-0.315[/C][C]0.377078[/C][/ROW]
[ROW][C]42[/C][C]-0.051978[/C][C]-0.3601[/C][C]0.36017[/C][/ROW]
[ROW][C]43[/C][C]0.023603[/C][C]0.1635[/C][C]0.435396[/C][/ROW]
[ROW][C]44[/C][C]0.046558[/C][C]0.3226[/C][C]0.374214[/C][/ROW]
[ROW][C]45[/C][C]0.008862[/C][C]0.0614[/C][C]0.475648[/C][/ROW]
[ROW][C]46[/C][C]0.101951[/C][C]0.7063[/C][C]0.241696[/C][/ROW]
[ROW][C]47[/C][C]0.129936[/C][C]0.9002[/C][C]0.186247[/C][/ROW]
[ROW][C]48[/C][C]NA[/C][C]NA[/C][C]NA[/C][/ROW]
[/TABLE]
Source: https://freestatistics.org/blog/index.php?pk=117008&T=1

Globally Unique Identifier (entire table): ba.freestatistics.org/blog/index.php?pk=117008&T=1

As an alternative you can also use a QR Code:  

The GUIDs for individual cells are displayed in the table below:

Autocorrelation Function
Time lag kACF(k)T-STATP-value
10.3188242.20890.015995
2-0.017178-0.1190.452881
3-0.174135-1.20640.11678
4-0.184476-1.27810.103682
5-0.098249-0.68070.24967
60.0591040.40950.342002
70.0992940.68790.247405
80.2387581.65420.05231
90.2186851.51510.068154
100.0618820.42870.335019
11-0.310787-2.15320.018178
12-0.371558-2.57420.006594
13-0.100157-0.69390.245543
140.1281540.88790.189517
150.1510071.04620.150352
160.0942430.65290.258457
17-0.020485-0.14190.443866
18-0.08487-0.5880.279646
19-0.021895-0.15170.440033
20-0.154827-1.07270.14439
21-0.084322-0.58420.280911
220.0338130.23430.407888
230.1520831.05370.148657
240.1004550.6960.2449
25-0.115325-0.7990.214115
26-0.229403-1.58940.059273
27-0.146267-1.01340.157984
280.000320.00220.49912
290.0500880.3470.365048
300.0534010.370.356514
310.0042940.02980.488195
32-0.079892-0.55350.291243
33-0.049286-0.34150.367123
34-0.185689-1.28650.102221
35-0.242111-1.67740.049983
36-0.06772-0.46920.320533
370.0756920.52440.301204
380.1077190.74630.229564
390.0929460.64390.261338
40-0.015601-0.10810.457187
41-0.045461-0.3150.377078
42-0.051978-0.36010.36017
430.0236030.16350.435396
440.0465580.32260.374214
450.0088620.06140.475648
460.1019510.70630.241696
470.1299360.90020.186247
48NANANA


Partial Autocorrelation Function
Time lag kPACF(k)T-STATP-value
10.3188242.20890.015995
2-0.132272-0.91640.182017
3-0.142485-0.98720.164256
4-0.093507-0.64780.260089
5-0.029244-0.20260.420148
60.0728980.50510.307916
70.0170870.11840.453128
80.2042451.4150.081755
90.1151320.79770.214499
100.0083010.05750.477189
11-0.305787-2.11860.019665
12-0.162765-1.12770.132532
130.1062760.73630.232566
140.0836210.57930.282533
15-0.039762-0.27550.392067
16-0.06973-0.48310.31561
17-0.051955-0.360.36023
18-0.040814-0.28280.389286
190.1461121.01230.158237
20-0.060268-0.41750.33907
210.0666430.46170.323186
22-0.057868-0.40090.345128
23-0.044525-0.30850.379525
24-0.034851-0.24150.405116
25-0.117008-0.81070.210783
26-0.055618-0.38530.350846
27-0.045337-0.31410.377402
280.0444520.3080.379718
29-0.077339-0.53580.297279
300.0403240.27940.390579
31-0.051718-0.35830.360839
32-0.141756-0.98210.165484
330.0414220.2870.387681
34-0.132102-0.91520.182323
35-0.119843-0.83030.20524
36-0.044846-0.31070.378687
37-0.069484-0.48140.316211
38-0.093629-0.64870.259819
390.0919990.63740.263451
400.0117490.08140.467731
410.056910.39430.347559
42-0.002833-0.01960.492212
430.0265920.18420.427302
440.0707090.48990.313222
45-0.094865-0.65720.257081
460.0017130.01190.49529
47-0.027998-0.1940.423506
48NANANA

\begin{tabular}{lllllllll}
\hline
Partial Autocorrelation Function \tabularnewline
Time lag k & PACF(k) & T-STAT & P-value \tabularnewline
1 & 0.318824 & 2.2089 & 0.015995 \tabularnewline
2 & -0.132272 & -0.9164 & 0.182017 \tabularnewline
3 & -0.142485 & -0.9872 & 0.164256 \tabularnewline
4 & -0.093507 & -0.6478 & 0.260089 \tabularnewline
5 & -0.029244 & -0.2026 & 0.420148 \tabularnewline
6 & 0.072898 & 0.5051 & 0.307916 \tabularnewline
7 & 0.017087 & 0.1184 & 0.453128 \tabularnewline
8 & 0.204245 & 1.415 & 0.081755 \tabularnewline
9 & 0.115132 & 0.7977 & 0.214499 \tabularnewline
10 & 0.008301 & 0.0575 & 0.477189 \tabularnewline
11 & -0.305787 & -2.1186 & 0.019665 \tabularnewline
12 & -0.162765 & -1.1277 & 0.132532 \tabularnewline
13 & 0.106276 & 0.7363 & 0.232566 \tabularnewline
14 & 0.083621 & 0.5793 & 0.282533 \tabularnewline
15 & -0.039762 & -0.2755 & 0.392067 \tabularnewline
16 & -0.06973 & -0.4831 & 0.31561 \tabularnewline
17 & -0.051955 & -0.36 & 0.36023 \tabularnewline
18 & -0.040814 & -0.2828 & 0.389286 \tabularnewline
19 & 0.146112 & 1.0123 & 0.158237 \tabularnewline
20 & -0.060268 & -0.4175 & 0.33907 \tabularnewline
21 & 0.066643 & 0.4617 & 0.323186 \tabularnewline
22 & -0.057868 & -0.4009 & 0.345128 \tabularnewline
23 & -0.044525 & -0.3085 & 0.379525 \tabularnewline
24 & -0.034851 & -0.2415 & 0.405116 \tabularnewline
25 & -0.117008 & -0.8107 & 0.210783 \tabularnewline
26 & -0.055618 & -0.3853 & 0.350846 \tabularnewline
27 & -0.045337 & -0.3141 & 0.377402 \tabularnewline
28 & 0.044452 & 0.308 & 0.379718 \tabularnewline
29 & -0.077339 & -0.5358 & 0.297279 \tabularnewline
30 & 0.040324 & 0.2794 & 0.390579 \tabularnewline
31 & -0.051718 & -0.3583 & 0.360839 \tabularnewline
32 & -0.141756 & -0.9821 & 0.165484 \tabularnewline
33 & 0.041422 & 0.287 & 0.387681 \tabularnewline
34 & -0.132102 & -0.9152 & 0.182323 \tabularnewline
35 & -0.119843 & -0.8303 & 0.20524 \tabularnewline
36 & -0.044846 & -0.3107 & 0.378687 \tabularnewline
37 & -0.069484 & -0.4814 & 0.316211 \tabularnewline
38 & -0.093629 & -0.6487 & 0.259819 \tabularnewline
39 & 0.091999 & 0.6374 & 0.263451 \tabularnewline
40 & 0.011749 & 0.0814 & 0.467731 \tabularnewline
41 & 0.05691 & 0.3943 & 0.347559 \tabularnewline
42 & -0.002833 & -0.0196 & 0.492212 \tabularnewline
43 & 0.026592 & 0.1842 & 0.427302 \tabularnewline
44 & 0.070709 & 0.4899 & 0.313222 \tabularnewline
45 & -0.094865 & -0.6572 & 0.257081 \tabularnewline
46 & 0.001713 & 0.0119 & 0.49529 \tabularnewline
47 & -0.027998 & -0.194 & 0.423506 \tabularnewline
48 & NA & NA & NA \tabularnewline
\hline
\end{tabular}
%Source: https://freestatistics.org/blog/index.php?pk=117008&T=2

[TABLE]
[ROW][C]Partial Autocorrelation Function[/C][/ROW]
[ROW][C]Time lag k[/C][C]PACF(k)[/C][C]T-STAT[/C][C]P-value[/C][/ROW]
[ROW][C]1[/C][C]0.318824[/C][C]2.2089[/C][C]0.015995[/C][/ROW]
[ROW][C]2[/C][C]-0.132272[/C][C]-0.9164[/C][C]0.182017[/C][/ROW]
[ROW][C]3[/C][C]-0.142485[/C][C]-0.9872[/C][C]0.164256[/C][/ROW]
[ROW][C]4[/C][C]-0.093507[/C][C]-0.6478[/C][C]0.260089[/C][/ROW]
[ROW][C]5[/C][C]-0.029244[/C][C]-0.2026[/C][C]0.420148[/C][/ROW]
[ROW][C]6[/C][C]0.072898[/C][C]0.5051[/C][C]0.307916[/C][/ROW]
[ROW][C]7[/C][C]0.017087[/C][C]0.1184[/C][C]0.453128[/C][/ROW]
[ROW][C]8[/C][C]0.204245[/C][C]1.415[/C][C]0.081755[/C][/ROW]
[ROW][C]9[/C][C]0.115132[/C][C]0.7977[/C][C]0.214499[/C][/ROW]
[ROW][C]10[/C][C]0.008301[/C][C]0.0575[/C][C]0.477189[/C][/ROW]
[ROW][C]11[/C][C]-0.305787[/C][C]-2.1186[/C][C]0.019665[/C][/ROW]
[ROW][C]12[/C][C]-0.162765[/C][C]-1.1277[/C][C]0.132532[/C][/ROW]
[ROW][C]13[/C][C]0.106276[/C][C]0.7363[/C][C]0.232566[/C][/ROW]
[ROW][C]14[/C][C]0.083621[/C][C]0.5793[/C][C]0.282533[/C][/ROW]
[ROW][C]15[/C][C]-0.039762[/C][C]-0.2755[/C][C]0.392067[/C][/ROW]
[ROW][C]16[/C][C]-0.06973[/C][C]-0.4831[/C][C]0.31561[/C][/ROW]
[ROW][C]17[/C][C]-0.051955[/C][C]-0.36[/C][C]0.36023[/C][/ROW]
[ROW][C]18[/C][C]-0.040814[/C][C]-0.2828[/C][C]0.389286[/C][/ROW]
[ROW][C]19[/C][C]0.146112[/C][C]1.0123[/C][C]0.158237[/C][/ROW]
[ROW][C]20[/C][C]-0.060268[/C][C]-0.4175[/C][C]0.33907[/C][/ROW]
[ROW][C]21[/C][C]0.066643[/C][C]0.4617[/C][C]0.323186[/C][/ROW]
[ROW][C]22[/C][C]-0.057868[/C][C]-0.4009[/C][C]0.345128[/C][/ROW]
[ROW][C]23[/C][C]-0.044525[/C][C]-0.3085[/C][C]0.379525[/C][/ROW]
[ROW][C]24[/C][C]-0.034851[/C][C]-0.2415[/C][C]0.405116[/C][/ROW]
[ROW][C]25[/C][C]-0.117008[/C][C]-0.8107[/C][C]0.210783[/C][/ROW]
[ROW][C]26[/C][C]-0.055618[/C][C]-0.3853[/C][C]0.350846[/C][/ROW]
[ROW][C]27[/C][C]-0.045337[/C][C]-0.3141[/C][C]0.377402[/C][/ROW]
[ROW][C]28[/C][C]0.044452[/C][C]0.308[/C][C]0.379718[/C][/ROW]
[ROW][C]29[/C][C]-0.077339[/C][C]-0.5358[/C][C]0.297279[/C][/ROW]
[ROW][C]30[/C][C]0.040324[/C][C]0.2794[/C][C]0.390579[/C][/ROW]
[ROW][C]31[/C][C]-0.051718[/C][C]-0.3583[/C][C]0.360839[/C][/ROW]
[ROW][C]32[/C][C]-0.141756[/C][C]-0.9821[/C][C]0.165484[/C][/ROW]
[ROW][C]33[/C][C]0.041422[/C][C]0.287[/C][C]0.387681[/C][/ROW]
[ROW][C]34[/C][C]-0.132102[/C][C]-0.9152[/C][C]0.182323[/C][/ROW]
[ROW][C]35[/C][C]-0.119843[/C][C]-0.8303[/C][C]0.20524[/C][/ROW]
[ROW][C]36[/C][C]-0.044846[/C][C]-0.3107[/C][C]0.378687[/C][/ROW]
[ROW][C]37[/C][C]-0.069484[/C][C]-0.4814[/C][C]0.316211[/C][/ROW]
[ROW][C]38[/C][C]-0.093629[/C][C]-0.6487[/C][C]0.259819[/C][/ROW]
[ROW][C]39[/C][C]0.091999[/C][C]0.6374[/C][C]0.263451[/C][/ROW]
[ROW][C]40[/C][C]0.011749[/C][C]0.0814[/C][C]0.467731[/C][/ROW]
[ROW][C]41[/C][C]0.05691[/C][C]0.3943[/C][C]0.347559[/C][/ROW]
[ROW][C]42[/C][C]-0.002833[/C][C]-0.0196[/C][C]0.492212[/C][/ROW]
[ROW][C]43[/C][C]0.026592[/C][C]0.1842[/C][C]0.427302[/C][/ROW]
[ROW][C]44[/C][C]0.070709[/C][C]0.4899[/C][C]0.313222[/C][/ROW]
[ROW][C]45[/C][C]-0.094865[/C][C]-0.6572[/C][C]0.257081[/C][/ROW]
[ROW][C]46[/C][C]0.001713[/C][C]0.0119[/C][C]0.49529[/C][/ROW]
[ROW][C]47[/C][C]-0.027998[/C][C]-0.194[/C][C]0.423506[/C][/ROW]
[ROW][C]48[/C][C]NA[/C][C]NA[/C][C]NA[/C][/ROW]
[/TABLE]
Source: https://freestatistics.org/blog/index.php?pk=117008&T=2

Globally Unique Identifier (entire table): ba.freestatistics.org/blog/index.php?pk=117008&T=2

As an alternative you can also use a QR Code:  

The GUIDs for individual cells are displayed in the table below:

Partial Autocorrelation Function
Time lag kPACF(k)T-STATP-value
10.3188242.20890.015995
2-0.132272-0.91640.182017
3-0.142485-0.98720.164256
4-0.093507-0.64780.260089
5-0.029244-0.20260.420148
60.0728980.50510.307916
70.0170870.11840.453128
80.2042451.4150.081755
90.1151320.79770.214499
100.0083010.05750.477189
11-0.305787-2.11860.019665
12-0.162765-1.12770.132532
130.1062760.73630.232566
140.0836210.57930.282533
15-0.039762-0.27550.392067
16-0.06973-0.48310.31561
17-0.051955-0.360.36023
18-0.040814-0.28280.389286
190.1461121.01230.158237
20-0.060268-0.41750.33907
210.0666430.46170.323186
22-0.057868-0.40090.345128
23-0.044525-0.30850.379525
24-0.034851-0.24150.405116
25-0.117008-0.81070.210783
26-0.055618-0.38530.350846
27-0.045337-0.31410.377402
280.0444520.3080.379718
29-0.077339-0.53580.297279
300.0403240.27940.390579
31-0.051718-0.35830.360839
32-0.141756-0.98210.165484
330.0414220.2870.387681
34-0.132102-0.91520.182323
35-0.119843-0.83030.20524
36-0.044846-0.31070.378687
37-0.069484-0.48140.316211
38-0.093629-0.64870.259819
390.0919990.63740.263451
400.0117490.08140.467731
410.056910.39430.347559
42-0.002833-0.01960.492212
430.0265920.18420.427302
440.0707090.48990.313222
45-0.094865-0.65720.257081
460.0017130.01190.49529
47-0.027998-0.1940.423506
48NANANA


Parameters (Session):
par1 = 48 ; par2 = 1 ; par3 = 0 ; par4 = 1 ; par5 = 12 ; par6 = White Noise ; par7 = 0.95 ;
Parameters (R input):
par1 = 48 ; par2 = 1 ; par3 = 0 ; par4 = 1 ; par5 = 12 ; par6 = White Noise ; par7 = 0.95 ; par8 = ;
R code (references can be found in the software module):
if (par1 == 'Default') {
par1 = 10*log10(length(x))
} else {
par1 <- as.numeric(par1)
}
par2 <- as.numeric(par2)
par3 <- as.numeric(par3)
par4 <- as.numeric(par4)
par5 <- as.numeric(par5)
if (par6 == 'White Noise') par6 <- 'white' else par6 <- 'ma'
par7 <- as.numeric(par7)
if (par8 != '') par8 <- as.numeric(par8)
ox <- x
if (par8 == '') {
if (par2 == 0) {
x <- log(x)
} else {
x <- (x ^ par2 - 1) / par2
}
} else {
x <- log(x,base=par8)
}
if (par3 > 0) x <- diff(x,lag=1,difference=par3)
if (par4 > 0) x <- diff(x,lag=par5,difference=par4)
bitmap(file='picts.png')
op <- par(mfrow=c(2,1))
plot(ox,type='l',main='Original Time Series',xlab='time',ylab='value')
if (par8=='') {
mytitle <- paste('Working Time Series (lambda=',par2,', d=',par3,', D=',par4,')',sep='')
mysub <- paste('(lambda=',par2,', d=',par3,', D=',par4,', CI=', par7, ', CI type=',par6,')',sep='')
} else {
mytitle <- paste('Working Time Series (base=',par8,', d=',par3,', D=',par4,')',sep='')
mysub <- paste('(base=',par8,', d=',par3,', D=',par4,', CI=', par7, ', CI type=',par6,')',sep='')
}
plot(x,type='l', main=mytitle,xlab='time',ylab='value')
par(op)
dev.off()
bitmap(file='pic1.png')
racf <- acf(x, par1, main='Autocorrelation', xlab='time lag', ylab='ACF', ci.type=par6, ci=par7, sub=mysub)
dev.off()
bitmap(file='pic2.png')
rpacf <- pacf(x,par1,main='Partial Autocorrelation',xlab='lags',ylab='PACF',sub=mysub)
dev.off()
(myacf <- c(racf$acf))
(mypacf <- c(rpacf$acf))
lengthx <- length(x)
sqrtn <- sqrt(lengthx)
load(file='createtable')
a<-table.start()
a<-table.row.start(a)
a<-table.element(a,'Autocorrelation Function',4,TRUE)
a<-table.row.end(a)
a<-table.row.start(a)
a<-table.element(a,'Time lag k',header=TRUE)
a<-table.element(a,hyperlink('basics.htm','ACF(k)','click here for more information about the Autocorrelation Function'),header=TRUE)
a<-table.element(a,'T-STAT',header=TRUE)
a<-table.element(a,'P-value',header=TRUE)
a<-table.row.end(a)
for (i in 2:(par1+1)) {
a<-table.row.start(a)
a<-table.element(a,i-1,header=TRUE)
a<-table.element(a,round(myacf[i],6))
mytstat <- myacf[i]*sqrtn
a<-table.element(a,round(mytstat,4))
a<-table.element(a,round(1-pt(abs(mytstat),lengthx),6))
a<-table.row.end(a)
}
a<-table.end(a)
table.save(a,file='mytable.tab')
a<-table.start()
a<-table.row.start(a)
a<-table.element(a,'Partial Autocorrelation Function',4,TRUE)
a<-table.row.end(a)
a<-table.row.start(a)
a<-table.element(a,'Time lag k',header=TRUE)
a<-table.element(a,hyperlink('basics.htm','PACF(k)','click here for more information about the Partial Autocorrelation Function'),header=TRUE)
a<-table.element(a,'T-STAT',header=TRUE)
a<-table.element(a,'P-value',header=TRUE)
a<-table.row.end(a)
for (i in 1:par1) {
a<-table.row.start(a)
a<-table.element(a,i,header=TRUE)
a<-table.element(a,round(mypacf[i],6))
mytstat <- mypacf[i]*sqrtn
a<-table.element(a,round(mytstat,4))
a<-table.element(a,round(1-pt(abs(mytstat),lengthx),6))
a<-table.row.end(a)
}
a<-table.end(a)
table.save(a,file='mytable1.tab')