Free Statistics

of Irreproducible Research!

Author's title

Author*Unverified author*
R Software Modulerwasp_autocorrelation.wasp
Title produced by software(Partial) Autocorrelation Function
Date of computationWed, 29 Dec 2010 15:52:57 +0000
Cite this page as followsStatistical Computations at FreeStatistics.org, Office for Research Development and Education, URL https://freestatistics.org/blog/index.php?v=date/2010/Dec/29/t1293637854fhnk5zrr9oqiemi.htm/, Retrieved Fri, 03 May 2024 06:25:44 +0000
Statistical Computations at FreeStatistics.org, Office for Research Development and Education, URL https://freestatistics.org/blog/index.php?pk=116923, Retrieved Fri, 03 May 2024 06:25:44 +0000
QR Codes:

Original text written by user:
IsPrivate?No (this computation is public)
User-defined keywords
Estimated Impact105
Family? (F = Feedback message, R = changed R code, M = changed R Module, P = changed Parameters, D = changed Data)
-       [(Partial) Autocorrelation Function] [Paper] [2010-12-29 15:52:57] [d5e0edb7e0239841e94676417b2a1e2e] [Current]
Feedback Forum

Post a new message
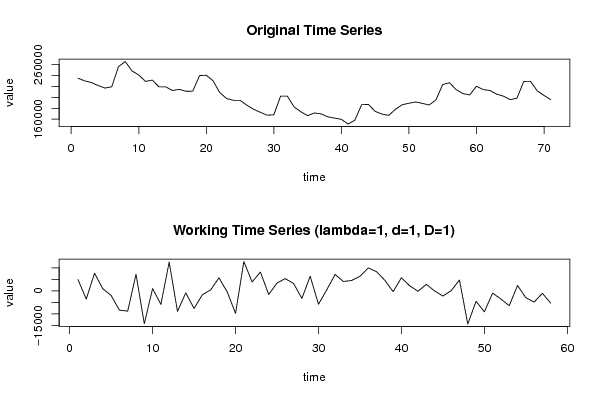
Dataseries X:
235243
230354
227184
221678
217142
219452
256446
265845
248624
241114
229245
231805
219277
219313
212610
214771
211142
211457
240048
240636
230580
208795
197922
194596
194581
185686
178106
172608
167302
168053
202300
202388
182516
173476
166444
171297
169701
164182
161914
159612
151001
158114
186530
187069
174330
169362
166827
178037
186413
189226
191563
188906
186005
195309
223532
226899
214126
206903
204442
220375
214320
212588
205816
202196
195722
198563
229139
229527
211868
203555
195770


Summary of computational transaction
Raw Inputview raw input (R code)
Raw Outputview raw output of R engine
Computing time1 seconds
R Server'Gwilym Jenkins' @ www.wessa.org

\begin{tabular}{lllllllll}
\hline
Summary of computational transaction \tabularnewline
Raw Input & view raw input (R code)  \tabularnewline
Raw Output & view raw output of R engine  \tabularnewline
Computing time & 1 seconds \tabularnewline
R Server & 'Gwilym Jenkins' @ www.wessa.org \tabularnewline
\hline
\end{tabular}
%Source: https://freestatistics.org/blog/index.php?pk=116923&T=0

[TABLE]
[ROW][C]Summary of computational transaction[/C][/ROW]
[ROW][C]Raw Input[/C][C]view raw input (R code) [/C][/ROW]
[ROW][C]Raw Output[/C][C]view raw output of R engine [/C][/ROW]
[ROW][C]Computing time[/C][C]1 seconds[/C][/ROW]
[ROW][C]R Server[/C][C]'Gwilym Jenkins' @ www.wessa.org[/C][/ROW]
[/TABLE]
Source: https://freestatistics.org/blog/index.php?pk=116923&T=0

Globally Unique Identifier (entire table): ba.freestatistics.org/blog/index.php?pk=116923&T=0

As an alternative you can also use a QR Code:  

The GUIDs for individual cells are displayed in the table below:

Summary of computational transaction
Raw Inputview raw input (R code)
Raw Outputview raw output of R engine
Computing time1 seconds
R Server'Gwilym Jenkins' @ www.wessa.org


Autocorrelation Function
Time lag kACF(k)T-STATP-value
1-0.017922-0.13650.445952
20.3228912.45910.008467
30.0388010.29550.384333
40.3083492.34830.011145
50.1021920.77830.219787
60.0215320.1640.435157
70.0895890.68230.248885
8-0.039839-0.30340.381332
90.1405621.07050.144418
10-0.043934-0.33460.369572
110.1825371.39020.084896
12-0.327976-2.49780.007678
130.005070.03860.484666
14-0.057085-0.43470.332681
150.0179790.13690.445782
16-0.269854-2.05510.022189
17-0.090864-0.6920.245851
18-0.045763-0.34850.364355
19-0.097271-0.74080.230903
20-0.072467-0.55190.291571
21-0.111188-0.84680.200299
22-0.078541-0.59810.276035
23-0.156217-1.18970.119504
24-0.043691-0.33270.370265
25-0.097778-0.74470.229743
26-0.083573-0.63650.263485
27-0.339076-2.58230.00618
280.006470.04930.480434
29-0.113119-0.86150.196259
30-0.10578-0.80560.211882
31-0.103737-0.790.216363
32-0.059403-0.45240.326333
330.0706480.5380.296305
34-0.048092-0.36630.357751
350.0879210.66960.25289
36-0.038527-0.29340.385127
370.054760.4170.339094
38-0.031713-0.24150.405001
390.1580021.20330.116872
40-0.012258-0.09340.462973
410.063820.4860.314386
420.1006360.76640.223268
430.1110510.84570.200586
440.0709730.54050.295456
45-0.039234-0.29880.383082
460.0558630.42540.336044
470.001330.01010.495976
480.0002220.00170.49933

\begin{tabular}{lllllllll}
\hline
Autocorrelation Function \tabularnewline
Time lag k & ACF(k) & T-STAT & P-value \tabularnewline
1 & -0.017922 & -0.1365 & 0.445952 \tabularnewline
2 & 0.322891 & 2.4591 & 0.008467 \tabularnewline
3 & 0.038801 & 0.2955 & 0.384333 \tabularnewline
4 & 0.308349 & 2.3483 & 0.011145 \tabularnewline
5 & 0.102192 & 0.7783 & 0.219787 \tabularnewline
6 & 0.021532 & 0.164 & 0.435157 \tabularnewline
7 & 0.089589 & 0.6823 & 0.248885 \tabularnewline
8 & -0.039839 & -0.3034 & 0.381332 \tabularnewline
9 & 0.140562 & 1.0705 & 0.144418 \tabularnewline
10 & -0.043934 & -0.3346 & 0.369572 \tabularnewline
11 & 0.182537 & 1.3902 & 0.084896 \tabularnewline
12 & -0.327976 & -2.4978 & 0.007678 \tabularnewline
13 & 0.00507 & 0.0386 & 0.484666 \tabularnewline
14 & -0.057085 & -0.4347 & 0.332681 \tabularnewline
15 & 0.017979 & 0.1369 & 0.445782 \tabularnewline
16 & -0.269854 & -2.0551 & 0.022189 \tabularnewline
17 & -0.090864 & -0.692 & 0.245851 \tabularnewline
18 & -0.045763 & -0.3485 & 0.364355 \tabularnewline
19 & -0.097271 & -0.7408 & 0.230903 \tabularnewline
20 & -0.072467 & -0.5519 & 0.291571 \tabularnewline
21 & -0.111188 & -0.8468 & 0.200299 \tabularnewline
22 & -0.078541 & -0.5981 & 0.276035 \tabularnewline
23 & -0.156217 & -1.1897 & 0.119504 \tabularnewline
24 & -0.043691 & -0.3327 & 0.370265 \tabularnewline
25 & -0.097778 & -0.7447 & 0.229743 \tabularnewline
26 & -0.083573 & -0.6365 & 0.263485 \tabularnewline
27 & -0.339076 & -2.5823 & 0.00618 \tabularnewline
28 & 0.00647 & 0.0493 & 0.480434 \tabularnewline
29 & -0.113119 & -0.8615 & 0.196259 \tabularnewline
30 & -0.10578 & -0.8056 & 0.211882 \tabularnewline
31 & -0.103737 & -0.79 & 0.216363 \tabularnewline
32 & -0.059403 & -0.4524 & 0.326333 \tabularnewline
33 & 0.070648 & 0.538 & 0.296305 \tabularnewline
34 & -0.048092 & -0.3663 & 0.357751 \tabularnewline
35 & 0.087921 & 0.6696 & 0.25289 \tabularnewline
36 & -0.038527 & -0.2934 & 0.385127 \tabularnewline
37 & 0.05476 & 0.417 & 0.339094 \tabularnewline
38 & -0.031713 & -0.2415 & 0.405001 \tabularnewline
39 & 0.158002 & 1.2033 & 0.116872 \tabularnewline
40 & -0.012258 & -0.0934 & 0.462973 \tabularnewline
41 & 0.06382 & 0.486 & 0.314386 \tabularnewline
42 & 0.100636 & 0.7664 & 0.223268 \tabularnewline
43 & 0.111051 & 0.8457 & 0.200586 \tabularnewline
44 & 0.070973 & 0.5405 & 0.295456 \tabularnewline
45 & -0.039234 & -0.2988 & 0.383082 \tabularnewline
46 & 0.055863 & 0.4254 & 0.336044 \tabularnewline
47 & 0.00133 & 0.0101 & 0.495976 \tabularnewline
48 & 0.000222 & 0.0017 & 0.49933 \tabularnewline
\hline
\end{tabular}
%Source: https://freestatistics.org/blog/index.php?pk=116923&T=1

[TABLE]
[ROW][C]Autocorrelation Function[/C][/ROW]
[ROW][C]Time lag k[/C][C]ACF(k)[/C][C]T-STAT[/C][C]P-value[/C][/ROW]
[ROW][C]1[/C][C]-0.017922[/C][C]-0.1365[/C][C]0.445952[/C][/ROW]
[ROW][C]2[/C][C]0.322891[/C][C]2.4591[/C][C]0.008467[/C][/ROW]
[ROW][C]3[/C][C]0.038801[/C][C]0.2955[/C][C]0.384333[/C][/ROW]
[ROW][C]4[/C][C]0.308349[/C][C]2.3483[/C][C]0.011145[/C][/ROW]
[ROW][C]5[/C][C]0.102192[/C][C]0.7783[/C][C]0.219787[/C][/ROW]
[ROW][C]6[/C][C]0.021532[/C][C]0.164[/C][C]0.435157[/C][/ROW]
[ROW][C]7[/C][C]0.089589[/C][C]0.6823[/C][C]0.248885[/C][/ROW]
[ROW][C]8[/C][C]-0.039839[/C][C]-0.3034[/C][C]0.381332[/C][/ROW]
[ROW][C]9[/C][C]0.140562[/C][C]1.0705[/C][C]0.144418[/C][/ROW]
[ROW][C]10[/C][C]-0.043934[/C][C]-0.3346[/C][C]0.369572[/C][/ROW]
[ROW][C]11[/C][C]0.182537[/C][C]1.3902[/C][C]0.084896[/C][/ROW]
[ROW][C]12[/C][C]-0.327976[/C][C]-2.4978[/C][C]0.007678[/C][/ROW]
[ROW][C]13[/C][C]0.00507[/C][C]0.0386[/C][C]0.484666[/C][/ROW]
[ROW][C]14[/C][C]-0.057085[/C][C]-0.4347[/C][C]0.332681[/C][/ROW]
[ROW][C]15[/C][C]0.017979[/C][C]0.1369[/C][C]0.445782[/C][/ROW]
[ROW][C]16[/C][C]-0.269854[/C][C]-2.0551[/C][C]0.022189[/C][/ROW]
[ROW][C]17[/C][C]-0.090864[/C][C]-0.692[/C][C]0.245851[/C][/ROW]
[ROW][C]18[/C][C]-0.045763[/C][C]-0.3485[/C][C]0.364355[/C][/ROW]
[ROW][C]19[/C][C]-0.097271[/C][C]-0.7408[/C][C]0.230903[/C][/ROW]
[ROW][C]20[/C][C]-0.072467[/C][C]-0.5519[/C][C]0.291571[/C][/ROW]
[ROW][C]21[/C][C]-0.111188[/C][C]-0.8468[/C][C]0.200299[/C][/ROW]
[ROW][C]22[/C][C]-0.078541[/C][C]-0.5981[/C][C]0.276035[/C][/ROW]
[ROW][C]23[/C][C]-0.156217[/C][C]-1.1897[/C][C]0.119504[/C][/ROW]
[ROW][C]24[/C][C]-0.043691[/C][C]-0.3327[/C][C]0.370265[/C][/ROW]
[ROW][C]25[/C][C]-0.097778[/C][C]-0.7447[/C][C]0.229743[/C][/ROW]
[ROW][C]26[/C][C]-0.083573[/C][C]-0.6365[/C][C]0.263485[/C][/ROW]
[ROW][C]27[/C][C]-0.339076[/C][C]-2.5823[/C][C]0.00618[/C][/ROW]
[ROW][C]28[/C][C]0.00647[/C][C]0.0493[/C][C]0.480434[/C][/ROW]
[ROW][C]29[/C][C]-0.113119[/C][C]-0.8615[/C][C]0.196259[/C][/ROW]
[ROW][C]30[/C][C]-0.10578[/C][C]-0.8056[/C][C]0.211882[/C][/ROW]
[ROW][C]31[/C][C]-0.103737[/C][C]-0.79[/C][C]0.216363[/C][/ROW]
[ROW][C]32[/C][C]-0.059403[/C][C]-0.4524[/C][C]0.326333[/C][/ROW]
[ROW][C]33[/C][C]0.070648[/C][C]0.538[/C][C]0.296305[/C][/ROW]
[ROW][C]34[/C][C]-0.048092[/C][C]-0.3663[/C][C]0.357751[/C][/ROW]
[ROW][C]35[/C][C]0.087921[/C][C]0.6696[/C][C]0.25289[/C][/ROW]
[ROW][C]36[/C][C]-0.038527[/C][C]-0.2934[/C][C]0.385127[/C][/ROW]
[ROW][C]37[/C][C]0.05476[/C][C]0.417[/C][C]0.339094[/C][/ROW]
[ROW][C]38[/C][C]-0.031713[/C][C]-0.2415[/C][C]0.405001[/C][/ROW]
[ROW][C]39[/C][C]0.158002[/C][C]1.2033[/C][C]0.116872[/C][/ROW]
[ROW][C]40[/C][C]-0.012258[/C][C]-0.0934[/C][C]0.462973[/C][/ROW]
[ROW][C]41[/C][C]0.06382[/C][C]0.486[/C][C]0.314386[/C][/ROW]
[ROW][C]42[/C][C]0.100636[/C][C]0.7664[/C][C]0.223268[/C][/ROW]
[ROW][C]43[/C][C]0.111051[/C][C]0.8457[/C][C]0.200586[/C][/ROW]
[ROW][C]44[/C][C]0.070973[/C][C]0.5405[/C][C]0.295456[/C][/ROW]
[ROW][C]45[/C][C]-0.039234[/C][C]-0.2988[/C][C]0.383082[/C][/ROW]
[ROW][C]46[/C][C]0.055863[/C][C]0.4254[/C][C]0.336044[/C][/ROW]
[ROW][C]47[/C][C]0.00133[/C][C]0.0101[/C][C]0.495976[/C][/ROW]
[ROW][C]48[/C][C]0.000222[/C][C]0.0017[/C][C]0.49933[/C][/ROW]
[/TABLE]
Source: https://freestatistics.org/blog/index.php?pk=116923&T=1

Globally Unique Identifier (entire table): ba.freestatistics.org/blog/index.php?pk=116923&T=1

As an alternative you can also use a QR Code:  

The GUIDs for individual cells are displayed in the table below:

Autocorrelation Function
Time lag kACF(k)T-STATP-value
1-0.017922-0.13650.445952
20.3228912.45910.008467
30.0388010.29550.384333
40.3083492.34830.011145
50.1021920.77830.219787
60.0215320.1640.435157
70.0895890.68230.248885
8-0.039839-0.30340.381332
90.1405621.07050.144418
10-0.043934-0.33460.369572
110.1825371.39020.084896
12-0.327976-2.49780.007678
130.005070.03860.484666
14-0.057085-0.43470.332681
150.0179790.13690.445782
16-0.269854-2.05510.022189
17-0.090864-0.6920.245851
18-0.045763-0.34850.364355
19-0.097271-0.74080.230903
20-0.072467-0.55190.291571
21-0.111188-0.84680.200299
22-0.078541-0.59810.276035
23-0.156217-1.18970.119504
24-0.043691-0.33270.370265
25-0.097778-0.74470.229743
26-0.083573-0.63650.263485
27-0.339076-2.58230.00618
280.006470.04930.480434
29-0.113119-0.86150.196259
30-0.10578-0.80560.211882
31-0.103737-0.790.216363
32-0.059403-0.45240.326333
330.0706480.5380.296305
34-0.048092-0.36630.357751
350.0879210.66960.25289
36-0.038527-0.29340.385127
370.054760.4170.339094
38-0.031713-0.24150.405001
390.1580021.20330.116872
40-0.012258-0.09340.462973
410.063820.4860.314386
420.1006360.76640.223268
430.1110510.84570.200586
440.0709730.54050.295456
45-0.039234-0.29880.383082
460.0558630.42540.336044
470.001330.01010.495976
480.0002220.00170.49933


Partial Autocorrelation Function
Time lag kPACF(k)T-STATP-value
1-0.017922-0.13650.445952
20.3226742.45740.008503
30.0541580.41250.340762
40.2307681.75750.042057
50.1064190.81050.210493
6-0.145647-1.10920.135958
70.007220.0550.47817
8-0.104021-0.79220.215736
90.0683760.52070.302266
100.0303380.2310.409045
110.1472511.12140.133363
12-0.35552-2.70760.004445
13-0.180043-1.37120.087803
140.103140.78550.217681
150.0457650.34850.36435
16-0.173312-1.31990.096026
170.0146110.11130.455892
180.0125640.09570.462049
19-0.082966-0.63190.264983
20-0.003604-0.02740.489098
210.0740650.56410.287443
22-0.111536-0.84940.199568
23-0.024732-0.18840.425628
24-0.081877-0.62360.267681
25-0.105848-0.80610.211736
260.0421820.32130.374587
27-0.252126-1.92010.029881
28-0.124478-0.9480.173533
290.0492220.37490.354566
30-0.029934-0.2280.410236
310.0307820.23440.407738
32-0.006248-0.04760.481106
330.1206060.91850.181078
34-0.009185-0.070.472236
350.0163550.12460.450652
360.007260.05530.478047
37-0.040262-0.30660.380114
38-0.00138-0.01050.495825
39-0.062771-0.4780.317207
40-0.117273-0.89310.18774
410.0897790.68370.248433
420.0833470.63470.264044
43-0.127996-0.97480.166856
44-0.098153-0.74750.228888
45-0.018609-0.14170.443896
46-0.1369-1.04260.150731
470.0266610.2030.419906
480.0098320.07490.470283

\begin{tabular}{lllllllll}
\hline
Partial Autocorrelation Function \tabularnewline
Time lag k & PACF(k) & T-STAT & P-value \tabularnewline
1 & -0.017922 & -0.1365 & 0.445952 \tabularnewline
2 & 0.322674 & 2.4574 & 0.008503 \tabularnewline
3 & 0.054158 & 0.4125 & 0.340762 \tabularnewline
4 & 0.230768 & 1.7575 & 0.042057 \tabularnewline
5 & 0.106419 & 0.8105 & 0.210493 \tabularnewline
6 & -0.145647 & -1.1092 & 0.135958 \tabularnewline
7 & 0.00722 & 0.055 & 0.47817 \tabularnewline
8 & -0.104021 & -0.7922 & 0.215736 \tabularnewline
9 & 0.068376 & 0.5207 & 0.302266 \tabularnewline
10 & 0.030338 & 0.231 & 0.409045 \tabularnewline
11 & 0.147251 & 1.1214 & 0.133363 \tabularnewline
12 & -0.35552 & -2.7076 & 0.004445 \tabularnewline
13 & -0.180043 & -1.3712 & 0.087803 \tabularnewline
14 & 0.10314 & 0.7855 & 0.217681 \tabularnewline
15 & 0.045765 & 0.3485 & 0.36435 \tabularnewline
16 & -0.173312 & -1.3199 & 0.096026 \tabularnewline
17 & 0.014611 & 0.1113 & 0.455892 \tabularnewline
18 & 0.012564 & 0.0957 & 0.462049 \tabularnewline
19 & -0.082966 & -0.6319 & 0.264983 \tabularnewline
20 & -0.003604 & -0.0274 & 0.489098 \tabularnewline
21 & 0.074065 & 0.5641 & 0.287443 \tabularnewline
22 & -0.111536 & -0.8494 & 0.199568 \tabularnewline
23 & -0.024732 & -0.1884 & 0.425628 \tabularnewline
24 & -0.081877 & -0.6236 & 0.267681 \tabularnewline
25 & -0.105848 & -0.8061 & 0.211736 \tabularnewline
26 & 0.042182 & 0.3213 & 0.374587 \tabularnewline
27 & -0.252126 & -1.9201 & 0.029881 \tabularnewline
28 & -0.124478 & -0.948 & 0.173533 \tabularnewline
29 & 0.049222 & 0.3749 & 0.354566 \tabularnewline
30 & -0.029934 & -0.228 & 0.410236 \tabularnewline
31 & 0.030782 & 0.2344 & 0.407738 \tabularnewline
32 & -0.006248 & -0.0476 & 0.481106 \tabularnewline
33 & 0.120606 & 0.9185 & 0.181078 \tabularnewline
34 & -0.009185 & -0.07 & 0.472236 \tabularnewline
35 & 0.016355 & 0.1246 & 0.450652 \tabularnewline
36 & 0.00726 & 0.0553 & 0.478047 \tabularnewline
37 & -0.040262 & -0.3066 & 0.380114 \tabularnewline
38 & -0.00138 & -0.0105 & 0.495825 \tabularnewline
39 & -0.062771 & -0.478 & 0.317207 \tabularnewline
40 & -0.117273 & -0.8931 & 0.18774 \tabularnewline
41 & 0.089779 & 0.6837 & 0.248433 \tabularnewline
42 & 0.083347 & 0.6347 & 0.264044 \tabularnewline
43 & -0.127996 & -0.9748 & 0.166856 \tabularnewline
44 & -0.098153 & -0.7475 & 0.228888 \tabularnewline
45 & -0.018609 & -0.1417 & 0.443896 \tabularnewline
46 & -0.1369 & -1.0426 & 0.150731 \tabularnewline
47 & 0.026661 & 0.203 & 0.419906 \tabularnewline
48 & 0.009832 & 0.0749 & 0.470283 \tabularnewline
\hline
\end{tabular}
%Source: https://freestatistics.org/blog/index.php?pk=116923&T=2

[TABLE]
[ROW][C]Partial Autocorrelation Function[/C][/ROW]
[ROW][C]Time lag k[/C][C]PACF(k)[/C][C]T-STAT[/C][C]P-value[/C][/ROW]
[ROW][C]1[/C][C]-0.017922[/C][C]-0.1365[/C][C]0.445952[/C][/ROW]
[ROW][C]2[/C][C]0.322674[/C][C]2.4574[/C][C]0.008503[/C][/ROW]
[ROW][C]3[/C][C]0.054158[/C][C]0.4125[/C][C]0.340762[/C][/ROW]
[ROW][C]4[/C][C]0.230768[/C][C]1.7575[/C][C]0.042057[/C][/ROW]
[ROW][C]5[/C][C]0.106419[/C][C]0.8105[/C][C]0.210493[/C][/ROW]
[ROW][C]6[/C][C]-0.145647[/C][C]-1.1092[/C][C]0.135958[/C][/ROW]
[ROW][C]7[/C][C]0.00722[/C][C]0.055[/C][C]0.47817[/C][/ROW]
[ROW][C]8[/C][C]-0.104021[/C][C]-0.7922[/C][C]0.215736[/C][/ROW]
[ROW][C]9[/C][C]0.068376[/C][C]0.5207[/C][C]0.302266[/C][/ROW]
[ROW][C]10[/C][C]0.030338[/C][C]0.231[/C][C]0.409045[/C][/ROW]
[ROW][C]11[/C][C]0.147251[/C][C]1.1214[/C][C]0.133363[/C][/ROW]
[ROW][C]12[/C][C]-0.35552[/C][C]-2.7076[/C][C]0.004445[/C][/ROW]
[ROW][C]13[/C][C]-0.180043[/C][C]-1.3712[/C][C]0.087803[/C][/ROW]
[ROW][C]14[/C][C]0.10314[/C][C]0.7855[/C][C]0.217681[/C][/ROW]
[ROW][C]15[/C][C]0.045765[/C][C]0.3485[/C][C]0.36435[/C][/ROW]
[ROW][C]16[/C][C]-0.173312[/C][C]-1.3199[/C][C]0.096026[/C][/ROW]
[ROW][C]17[/C][C]0.014611[/C][C]0.1113[/C][C]0.455892[/C][/ROW]
[ROW][C]18[/C][C]0.012564[/C][C]0.0957[/C][C]0.462049[/C][/ROW]
[ROW][C]19[/C][C]-0.082966[/C][C]-0.6319[/C][C]0.264983[/C][/ROW]
[ROW][C]20[/C][C]-0.003604[/C][C]-0.0274[/C][C]0.489098[/C][/ROW]
[ROW][C]21[/C][C]0.074065[/C][C]0.5641[/C][C]0.287443[/C][/ROW]
[ROW][C]22[/C][C]-0.111536[/C][C]-0.8494[/C][C]0.199568[/C][/ROW]
[ROW][C]23[/C][C]-0.024732[/C][C]-0.1884[/C][C]0.425628[/C][/ROW]
[ROW][C]24[/C][C]-0.081877[/C][C]-0.6236[/C][C]0.267681[/C][/ROW]
[ROW][C]25[/C][C]-0.105848[/C][C]-0.8061[/C][C]0.211736[/C][/ROW]
[ROW][C]26[/C][C]0.042182[/C][C]0.3213[/C][C]0.374587[/C][/ROW]
[ROW][C]27[/C][C]-0.252126[/C][C]-1.9201[/C][C]0.029881[/C][/ROW]
[ROW][C]28[/C][C]-0.124478[/C][C]-0.948[/C][C]0.173533[/C][/ROW]
[ROW][C]29[/C][C]0.049222[/C][C]0.3749[/C][C]0.354566[/C][/ROW]
[ROW][C]30[/C][C]-0.029934[/C][C]-0.228[/C][C]0.410236[/C][/ROW]
[ROW][C]31[/C][C]0.030782[/C][C]0.2344[/C][C]0.407738[/C][/ROW]
[ROW][C]32[/C][C]-0.006248[/C][C]-0.0476[/C][C]0.481106[/C][/ROW]
[ROW][C]33[/C][C]0.120606[/C][C]0.9185[/C][C]0.181078[/C][/ROW]
[ROW][C]34[/C][C]-0.009185[/C][C]-0.07[/C][C]0.472236[/C][/ROW]
[ROW][C]35[/C][C]0.016355[/C][C]0.1246[/C][C]0.450652[/C][/ROW]
[ROW][C]36[/C][C]0.00726[/C][C]0.0553[/C][C]0.478047[/C][/ROW]
[ROW][C]37[/C][C]-0.040262[/C][C]-0.3066[/C][C]0.380114[/C][/ROW]
[ROW][C]38[/C][C]-0.00138[/C][C]-0.0105[/C][C]0.495825[/C][/ROW]
[ROW][C]39[/C][C]-0.062771[/C][C]-0.478[/C][C]0.317207[/C][/ROW]
[ROW][C]40[/C][C]-0.117273[/C][C]-0.8931[/C][C]0.18774[/C][/ROW]
[ROW][C]41[/C][C]0.089779[/C][C]0.6837[/C][C]0.248433[/C][/ROW]
[ROW][C]42[/C][C]0.083347[/C][C]0.6347[/C][C]0.264044[/C][/ROW]
[ROW][C]43[/C][C]-0.127996[/C][C]-0.9748[/C][C]0.166856[/C][/ROW]
[ROW][C]44[/C][C]-0.098153[/C][C]-0.7475[/C][C]0.228888[/C][/ROW]
[ROW][C]45[/C][C]-0.018609[/C][C]-0.1417[/C][C]0.443896[/C][/ROW]
[ROW][C]46[/C][C]-0.1369[/C][C]-1.0426[/C][C]0.150731[/C][/ROW]
[ROW][C]47[/C][C]0.026661[/C][C]0.203[/C][C]0.419906[/C][/ROW]
[ROW][C]48[/C][C]0.009832[/C][C]0.0749[/C][C]0.470283[/C][/ROW]
[/TABLE]
Source: https://freestatistics.org/blog/index.php?pk=116923&T=2

Globally Unique Identifier (entire table): ba.freestatistics.org/blog/index.php?pk=116923&T=2

As an alternative you can also use a QR Code:  

The GUIDs for individual cells are displayed in the table below:

Partial Autocorrelation Function
Time lag kPACF(k)T-STATP-value
1-0.017922-0.13650.445952
20.3226742.45740.008503
30.0541580.41250.340762
40.2307681.75750.042057
50.1064190.81050.210493
6-0.145647-1.10920.135958
70.007220.0550.47817
8-0.104021-0.79220.215736
90.0683760.52070.302266
100.0303380.2310.409045
110.1472511.12140.133363
12-0.35552-2.70760.004445
13-0.180043-1.37120.087803
140.103140.78550.217681
150.0457650.34850.36435
16-0.173312-1.31990.096026
170.0146110.11130.455892
180.0125640.09570.462049
19-0.082966-0.63190.264983
20-0.003604-0.02740.489098
210.0740650.56410.287443
22-0.111536-0.84940.199568
23-0.024732-0.18840.425628
24-0.081877-0.62360.267681
25-0.105848-0.80610.211736
260.0421820.32130.374587
27-0.252126-1.92010.029881
28-0.124478-0.9480.173533
290.0492220.37490.354566
30-0.029934-0.2280.410236
310.0307820.23440.407738
32-0.006248-0.04760.481106
330.1206060.91850.181078
34-0.009185-0.070.472236
350.0163550.12460.450652
360.007260.05530.478047
37-0.040262-0.30660.380114
38-0.00138-0.01050.495825
39-0.062771-0.4780.317207
40-0.117273-0.89310.18774
410.0897790.68370.248433
420.0833470.63470.264044
43-0.127996-0.97480.166856
44-0.098153-0.74750.228888
45-0.018609-0.14170.443896
46-0.1369-1.04260.150731
470.0266610.2030.419906
480.0098320.07490.470283


Parameters (Session):
par1 = 1 ; par2 = 1 ; par3 = 0 ; par4 = 12 ;
Parameters (R input):
par1 = 48 ; par2 = 1 ; par3 = 1 ; par4 = 1 ; par5 = 12 ; par6 = White Noise ; par7 = 0.95 ; par8 = ;
R code (references can be found in the software module):
if (par1 == 'Default') {
par1 = 10*log10(length(x))
} else {
par1 <- as.numeric(par1)
}
par2 <- as.numeric(par2)
par3 <- as.numeric(par3)
par4 <- as.numeric(par4)
par5 <- as.numeric(par5)
if (par6 == 'White Noise') par6 <- 'white' else par6 <- 'ma'
par7 <- as.numeric(par7)
if (par8 != '') par8 <- as.numeric(par8)
ox <- x
if (par8 == '') {
if (par2 == 0) {
x <- log(x)
} else {
x <- (x ^ par2 - 1) / par2
}
} else {
x <- log(x,base=par8)
}
if (par3 > 0) x <- diff(x,lag=1,difference=par3)
if (par4 > 0) x <- diff(x,lag=par5,difference=par4)
bitmap(file='picts.png')
op <- par(mfrow=c(2,1))
plot(ox,type='l',main='Original Time Series',xlab='time',ylab='value')
if (par8=='') {
mytitle <- paste('Working Time Series (lambda=',par2,', d=',par3,', D=',par4,')',sep='')
mysub <- paste('(lambda=',par2,', d=',par3,', D=',par4,', CI=', par7, ', CI type=',par6,')',sep='')
} else {
mytitle <- paste('Working Time Series (base=',par8,', d=',par3,', D=',par4,')',sep='')
mysub <- paste('(base=',par8,', d=',par3,', D=',par4,', CI=', par7, ', CI type=',par6,')',sep='')
}
plot(x,type='l', main=mytitle,xlab='time',ylab='value')
par(op)
dev.off()
bitmap(file='pic1.png')
racf <- acf(x, par1, main='Autocorrelation', xlab='time lag', ylab='ACF', ci.type=par6, ci=par7, sub=mysub)
dev.off()
bitmap(file='pic2.png')
rpacf <- pacf(x,par1,main='Partial Autocorrelation',xlab='lags',ylab='PACF',sub=mysub)
dev.off()
(myacf <- c(racf$acf))
(mypacf <- c(rpacf$acf))
lengthx <- length(x)
sqrtn <- sqrt(lengthx)
load(file='createtable')
a<-table.start()
a<-table.row.start(a)
a<-table.element(a,'Autocorrelation Function',4,TRUE)
a<-table.row.end(a)
a<-table.row.start(a)
a<-table.element(a,'Time lag k',header=TRUE)
a<-table.element(a,hyperlink('basics.htm','ACF(k)','click here for more information about the Autocorrelation Function'),header=TRUE)
a<-table.element(a,'T-STAT',header=TRUE)
a<-table.element(a,'P-value',header=TRUE)
a<-table.row.end(a)
for (i in 2:(par1+1)) {
a<-table.row.start(a)
a<-table.element(a,i-1,header=TRUE)
a<-table.element(a,round(myacf[i],6))
mytstat <- myacf[i]*sqrtn
a<-table.element(a,round(mytstat,4))
a<-table.element(a,round(1-pt(abs(mytstat),lengthx),6))
a<-table.row.end(a)
}
a<-table.end(a)
table.save(a,file='mytable.tab')
a<-table.start()
a<-table.row.start(a)
a<-table.element(a,'Partial Autocorrelation Function',4,TRUE)
a<-table.row.end(a)
a<-table.row.start(a)
a<-table.element(a,'Time lag k',header=TRUE)
a<-table.element(a,hyperlink('basics.htm','PACF(k)','click here for more information about the Partial Autocorrelation Function'),header=TRUE)
a<-table.element(a,'T-STAT',header=TRUE)
a<-table.element(a,'P-value',header=TRUE)
a<-table.row.end(a)
for (i in 1:par1) {
a<-table.row.start(a)
a<-table.element(a,i,header=TRUE)
a<-table.element(a,round(mypacf[i],6))
mytstat <- mypacf[i]*sqrtn
a<-table.element(a,round(mytstat,4))
a<-table.element(a,round(1-pt(abs(mytstat),lengthx),6))
a<-table.row.end(a)
}
a<-table.end(a)
table.save(a,file='mytable1.tab')