Free Statistics

of Irreproducible Research!

Author's title

Author*The author of this computation has been verified*
R Software Modulerwasp_autocorrelation.wasp
Title produced by software(Partial) Autocorrelation Function
Date of computationWed, 29 Dec 2010 15:07:58 +0000
Cite this page as followsStatistical Computations at FreeStatistics.org, Office for Research Development and Education, URL https://freestatistics.org/blog/index.php?v=date/2010/Dec/29/t129363514326r98529xh8o6pu.htm/, Retrieved Fri, 03 May 2024 04:58:32 +0000
Statistical Computations at FreeStatistics.org, Office for Research Development and Education, URL https://freestatistics.org/blog/index.php?pk=116898, Retrieved Fri, 03 May 2024 04:58:32 +0000
QR Codes:

Original text written by user:
IsPrivate?No (this computation is public)
User-defined keywords
Estimated Impact118
Family? (F = Feedback message, R = changed R code, M = changed R Module, P = changed Parameters, D = changed Data)
-     [Spectral Analysis] [Paper] [2010-12-29 14:04:15] [f9c71f724b8f3da7e2789afe36ffff39]
- RMPD    [(Partial) Autocorrelation Function] [Paper: ACF (18t/m24)] [2010-12-29 15:07:58] [35c3410767ea63f72c8afa35bf7b6164] [Current]
Feedback Forum

Post a new message
Dataseries X:
49915
47469
45652
43492
41087
42931
67256
72316
65624
59450
52851
51214
44092
43752
40320
40551
38329
39530
59648
61031
55560
43877
38510
36085
35994
32617
30001
27894
26083
28817
48742
49915
40264
34276
30426
30793
29855
28081
26820
25782
22654
27373
43675
45096
38145
34017
31537
33814
36531
36935
36497
35110
33137
37407
53963
56602
49694
43957
41723
45599
42503
42153
39098
37449
34748
36548
53639
55289
47774
42156
38019


Summary of computational transaction
Raw Inputview raw input (R code)
Raw Outputview raw output of R engine
Computing time3 seconds
R Server'RServer@AstonUniversity' @ vre.aston.ac.uk

\begin{tabular}{lllllllll}
\hline
Summary of computational transaction \tabularnewline
Raw Input & view raw input (R code)  \tabularnewline
Raw Output & view raw output of R engine  \tabularnewline
Computing time & 3 seconds \tabularnewline
R Server & 'RServer@AstonUniversity' @ vre.aston.ac.uk \tabularnewline
\hline
\end{tabular}
%Source: https://freestatistics.org/blog/index.php?pk=116898&T=0

[TABLE]
[ROW][C]Summary of computational transaction[/C][/ROW]
[ROW][C]Raw Input[/C][C]view raw input (R code) [/C][/ROW]
[ROW][C]Raw Output[/C][C]view raw output of R engine [/C][/ROW]
[ROW][C]Computing time[/C][C]3 seconds[/C][/ROW]
[ROW][C]R Server[/C][C]'RServer@AstonUniversity' @ vre.aston.ac.uk[/C][/ROW]
[/TABLE]
Source: https://freestatistics.org/blog/index.php?pk=116898&T=0

Globally Unique Identifier (entire table): ba.freestatistics.org/blog/index.php?pk=116898&T=0

As an alternative you can also use a QR Code:  

The GUIDs for individual cells are displayed in the table below:

Summary of computational transaction
Raw Inputview raw input (R code)
Raw Outputview raw output of R engine
Computing time3 seconds
R Server'RServer@AstonUniversity' @ vre.aston.ac.uk


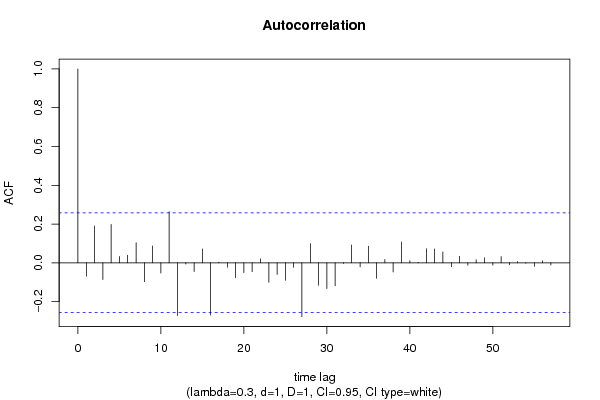
Autocorrelation Function
Time lag kACF(k)T-STATP-value
1-0.068946-0.52510.300766
20.1904651.45050.076148
3-0.086052-0.65540.257416
40.1977091.50570.068784
50.0324580.24720.402816
60.0389330.29650.383951
70.1034790.78810.216931
8-0.097331-0.74120.230767
90.0869290.6620.255285
10-0.052799-0.40210.344542
110.2637552.00870.024616
12-0.271785-2.06990.021465
13-0.005818-0.04430.482405
14-0.044745-0.34080.367254
150.0711150.54160.295086
16-0.269555-2.05290.022303
170.0027280.02080.491747
18-0.023328-0.17770.429805
19-0.076939-0.5860.280091
20-0.050058-0.38120.352212
21-0.045582-0.34710.364872
220.0203030.15460.438829
23-0.099959-0.76130.224792
24-0.059889-0.45610.32501
25-0.089828-0.68410.248316
26-0.023044-0.17550.430651
27-0.277741-2.11520.019359
280.0984730.750.228158
29-0.116147-0.88460.190026
30-0.132195-1.00680.159115
31-0.118439-0.9020.185392
32-0.003406-0.02590.489696
330.0922660.70270.242534
34-0.020228-0.15410.439052
350.085920.65430.257738
36-0.079883-0.60840.272659
370.017590.1340.446949
38-0.047787-0.36390.358615
390.1076240.81960.207888
400.0104910.07990.468297
410.0024760.01890.492512
420.0725360.55240.291393
430.0717750.54660.293368
440.0562580.42850.334955
45-0.020818-0.15850.437289
460.0333540.2540.400191
47-0.012768-0.09720.461437
480.015510.11810.45319
490.026230.19980.421181
50-0.011982-0.09130.463803
510.0319420.24330.404331
52-0.010183-0.07760.469226
530.0069210.05270.479071
54-0.001681-0.01280.494915
55-0.017457-0.13290.447347
560.0105450.08030.468133
57-0.011416-0.08690.465507
58NANANA
59NANANA
60NANANA

\begin{tabular}{lllllllll}
\hline
Autocorrelation Function \tabularnewline
Time lag k & ACF(k) & T-STAT & P-value \tabularnewline
1 & -0.068946 & -0.5251 & 0.300766 \tabularnewline
2 & 0.190465 & 1.4505 & 0.076148 \tabularnewline
3 & -0.086052 & -0.6554 & 0.257416 \tabularnewline
4 & 0.197709 & 1.5057 & 0.068784 \tabularnewline
5 & 0.032458 & 0.2472 & 0.402816 \tabularnewline
6 & 0.038933 & 0.2965 & 0.383951 \tabularnewline
7 & 0.103479 & 0.7881 & 0.216931 \tabularnewline
8 & -0.097331 & -0.7412 & 0.230767 \tabularnewline
9 & 0.086929 & 0.662 & 0.255285 \tabularnewline
10 & -0.052799 & -0.4021 & 0.344542 \tabularnewline
11 & 0.263755 & 2.0087 & 0.024616 \tabularnewline
12 & -0.271785 & -2.0699 & 0.021465 \tabularnewline
13 & -0.005818 & -0.0443 & 0.482405 \tabularnewline
14 & -0.044745 & -0.3408 & 0.367254 \tabularnewline
15 & 0.071115 & 0.5416 & 0.295086 \tabularnewline
16 & -0.269555 & -2.0529 & 0.022303 \tabularnewline
17 & 0.002728 & 0.0208 & 0.491747 \tabularnewline
18 & -0.023328 & -0.1777 & 0.429805 \tabularnewline
19 & -0.076939 & -0.586 & 0.280091 \tabularnewline
20 & -0.050058 & -0.3812 & 0.352212 \tabularnewline
21 & -0.045582 & -0.3471 & 0.364872 \tabularnewline
22 & 0.020303 & 0.1546 & 0.438829 \tabularnewline
23 & -0.099959 & -0.7613 & 0.224792 \tabularnewline
24 & -0.059889 & -0.4561 & 0.32501 \tabularnewline
25 & -0.089828 & -0.6841 & 0.248316 \tabularnewline
26 & -0.023044 & -0.1755 & 0.430651 \tabularnewline
27 & -0.277741 & -2.1152 & 0.019359 \tabularnewline
28 & 0.098473 & 0.75 & 0.228158 \tabularnewline
29 & -0.116147 & -0.8846 & 0.190026 \tabularnewline
30 & -0.132195 & -1.0068 & 0.159115 \tabularnewline
31 & -0.118439 & -0.902 & 0.185392 \tabularnewline
32 & -0.003406 & -0.0259 & 0.489696 \tabularnewline
33 & 0.092266 & 0.7027 & 0.242534 \tabularnewline
34 & -0.020228 & -0.1541 & 0.439052 \tabularnewline
35 & 0.08592 & 0.6543 & 0.257738 \tabularnewline
36 & -0.079883 & -0.6084 & 0.272659 \tabularnewline
37 & 0.01759 & 0.134 & 0.446949 \tabularnewline
38 & -0.047787 & -0.3639 & 0.358615 \tabularnewline
39 & 0.107624 & 0.8196 & 0.207888 \tabularnewline
40 & 0.010491 & 0.0799 & 0.468297 \tabularnewline
41 & 0.002476 & 0.0189 & 0.492512 \tabularnewline
42 & 0.072536 & 0.5524 & 0.291393 \tabularnewline
43 & 0.071775 & 0.5466 & 0.293368 \tabularnewline
44 & 0.056258 & 0.4285 & 0.334955 \tabularnewline
45 & -0.020818 & -0.1585 & 0.437289 \tabularnewline
46 & 0.033354 & 0.254 & 0.400191 \tabularnewline
47 & -0.012768 & -0.0972 & 0.461437 \tabularnewline
48 & 0.01551 & 0.1181 & 0.45319 \tabularnewline
49 & 0.02623 & 0.1998 & 0.421181 \tabularnewline
50 & -0.011982 & -0.0913 & 0.463803 \tabularnewline
51 & 0.031942 & 0.2433 & 0.404331 \tabularnewline
52 & -0.010183 & -0.0776 & 0.469226 \tabularnewline
53 & 0.006921 & 0.0527 & 0.479071 \tabularnewline
54 & -0.001681 & -0.0128 & 0.494915 \tabularnewline
55 & -0.017457 & -0.1329 & 0.447347 \tabularnewline
56 & 0.010545 & 0.0803 & 0.468133 \tabularnewline
57 & -0.011416 & -0.0869 & 0.465507 \tabularnewline
58 & NA & NA & NA \tabularnewline
59 & NA & NA & NA \tabularnewline
60 & NA & NA & NA \tabularnewline
\hline
\end{tabular}
%Source: https://freestatistics.org/blog/index.php?pk=116898&T=1

[TABLE]
[ROW][C]Autocorrelation Function[/C][/ROW]
[ROW][C]Time lag k[/C][C]ACF(k)[/C][C]T-STAT[/C][C]P-value[/C][/ROW]
[ROW][C]1[/C][C]-0.068946[/C][C]-0.5251[/C][C]0.300766[/C][/ROW]
[ROW][C]2[/C][C]0.190465[/C][C]1.4505[/C][C]0.076148[/C][/ROW]
[ROW][C]3[/C][C]-0.086052[/C][C]-0.6554[/C][C]0.257416[/C][/ROW]
[ROW][C]4[/C][C]0.197709[/C][C]1.5057[/C][C]0.068784[/C][/ROW]
[ROW][C]5[/C][C]0.032458[/C][C]0.2472[/C][C]0.402816[/C][/ROW]
[ROW][C]6[/C][C]0.038933[/C][C]0.2965[/C][C]0.383951[/C][/ROW]
[ROW][C]7[/C][C]0.103479[/C][C]0.7881[/C][C]0.216931[/C][/ROW]
[ROW][C]8[/C][C]-0.097331[/C][C]-0.7412[/C][C]0.230767[/C][/ROW]
[ROW][C]9[/C][C]0.086929[/C][C]0.662[/C][C]0.255285[/C][/ROW]
[ROW][C]10[/C][C]-0.052799[/C][C]-0.4021[/C][C]0.344542[/C][/ROW]
[ROW][C]11[/C][C]0.263755[/C][C]2.0087[/C][C]0.024616[/C][/ROW]
[ROW][C]12[/C][C]-0.271785[/C][C]-2.0699[/C][C]0.021465[/C][/ROW]
[ROW][C]13[/C][C]-0.005818[/C][C]-0.0443[/C][C]0.482405[/C][/ROW]
[ROW][C]14[/C][C]-0.044745[/C][C]-0.3408[/C][C]0.367254[/C][/ROW]
[ROW][C]15[/C][C]0.071115[/C][C]0.5416[/C][C]0.295086[/C][/ROW]
[ROW][C]16[/C][C]-0.269555[/C][C]-2.0529[/C][C]0.022303[/C][/ROW]
[ROW][C]17[/C][C]0.002728[/C][C]0.0208[/C][C]0.491747[/C][/ROW]
[ROW][C]18[/C][C]-0.023328[/C][C]-0.1777[/C][C]0.429805[/C][/ROW]
[ROW][C]19[/C][C]-0.076939[/C][C]-0.586[/C][C]0.280091[/C][/ROW]
[ROW][C]20[/C][C]-0.050058[/C][C]-0.3812[/C][C]0.352212[/C][/ROW]
[ROW][C]21[/C][C]-0.045582[/C][C]-0.3471[/C][C]0.364872[/C][/ROW]
[ROW][C]22[/C][C]0.020303[/C][C]0.1546[/C][C]0.438829[/C][/ROW]
[ROW][C]23[/C][C]-0.099959[/C][C]-0.7613[/C][C]0.224792[/C][/ROW]
[ROW][C]24[/C][C]-0.059889[/C][C]-0.4561[/C][C]0.32501[/C][/ROW]
[ROW][C]25[/C][C]-0.089828[/C][C]-0.6841[/C][C]0.248316[/C][/ROW]
[ROW][C]26[/C][C]-0.023044[/C][C]-0.1755[/C][C]0.430651[/C][/ROW]
[ROW][C]27[/C][C]-0.277741[/C][C]-2.1152[/C][C]0.019359[/C][/ROW]
[ROW][C]28[/C][C]0.098473[/C][C]0.75[/C][C]0.228158[/C][/ROW]
[ROW][C]29[/C][C]-0.116147[/C][C]-0.8846[/C][C]0.190026[/C][/ROW]
[ROW][C]30[/C][C]-0.132195[/C][C]-1.0068[/C][C]0.159115[/C][/ROW]
[ROW][C]31[/C][C]-0.118439[/C][C]-0.902[/C][C]0.185392[/C][/ROW]
[ROW][C]32[/C][C]-0.003406[/C][C]-0.0259[/C][C]0.489696[/C][/ROW]
[ROW][C]33[/C][C]0.092266[/C][C]0.7027[/C][C]0.242534[/C][/ROW]
[ROW][C]34[/C][C]-0.020228[/C][C]-0.1541[/C][C]0.439052[/C][/ROW]
[ROW][C]35[/C][C]0.08592[/C][C]0.6543[/C][C]0.257738[/C][/ROW]
[ROW][C]36[/C][C]-0.079883[/C][C]-0.6084[/C][C]0.272659[/C][/ROW]
[ROW][C]37[/C][C]0.01759[/C][C]0.134[/C][C]0.446949[/C][/ROW]
[ROW][C]38[/C][C]-0.047787[/C][C]-0.3639[/C][C]0.358615[/C][/ROW]
[ROW][C]39[/C][C]0.107624[/C][C]0.8196[/C][C]0.207888[/C][/ROW]
[ROW][C]40[/C][C]0.010491[/C][C]0.0799[/C][C]0.468297[/C][/ROW]
[ROW][C]41[/C][C]0.002476[/C][C]0.0189[/C][C]0.492512[/C][/ROW]
[ROW][C]42[/C][C]0.072536[/C][C]0.5524[/C][C]0.291393[/C][/ROW]
[ROW][C]43[/C][C]0.071775[/C][C]0.5466[/C][C]0.293368[/C][/ROW]
[ROW][C]44[/C][C]0.056258[/C][C]0.4285[/C][C]0.334955[/C][/ROW]
[ROW][C]45[/C][C]-0.020818[/C][C]-0.1585[/C][C]0.437289[/C][/ROW]
[ROW][C]46[/C][C]0.033354[/C][C]0.254[/C][C]0.400191[/C][/ROW]
[ROW][C]47[/C][C]-0.012768[/C][C]-0.0972[/C][C]0.461437[/C][/ROW]
[ROW][C]48[/C][C]0.01551[/C][C]0.1181[/C][C]0.45319[/C][/ROW]
[ROW][C]49[/C][C]0.02623[/C][C]0.1998[/C][C]0.421181[/C][/ROW]
[ROW][C]50[/C][C]-0.011982[/C][C]-0.0913[/C][C]0.463803[/C][/ROW]
[ROW][C]51[/C][C]0.031942[/C][C]0.2433[/C][C]0.404331[/C][/ROW]
[ROW][C]52[/C][C]-0.010183[/C][C]-0.0776[/C][C]0.469226[/C][/ROW]
[ROW][C]53[/C][C]0.006921[/C][C]0.0527[/C][C]0.479071[/C][/ROW]
[ROW][C]54[/C][C]-0.001681[/C][C]-0.0128[/C][C]0.494915[/C][/ROW]
[ROW][C]55[/C][C]-0.017457[/C][C]-0.1329[/C][C]0.447347[/C][/ROW]
[ROW][C]56[/C][C]0.010545[/C][C]0.0803[/C][C]0.468133[/C][/ROW]
[ROW][C]57[/C][C]-0.011416[/C][C]-0.0869[/C][C]0.465507[/C][/ROW]
[ROW][C]58[/C][C]NA[/C][C]NA[/C][C]NA[/C][/ROW]
[ROW][C]59[/C][C]NA[/C][C]NA[/C][C]NA[/C][/ROW]
[ROW][C]60[/C][C]NA[/C][C]NA[/C][C]NA[/C][/ROW]
[/TABLE]
Source: https://freestatistics.org/blog/index.php?pk=116898&T=1

Globally Unique Identifier (entire table): ba.freestatistics.org/blog/index.php?pk=116898&T=1

As an alternative you can also use a QR Code:  

The GUIDs for individual cells are displayed in the table below:

Autocorrelation Function
Time lag kACF(k)T-STATP-value
1-0.068946-0.52510.300766
20.1904651.45050.076148
3-0.086052-0.65540.257416
40.1977091.50570.068784
50.0324580.24720.402816
60.0389330.29650.383951
70.1034790.78810.216931
8-0.097331-0.74120.230767
90.0869290.6620.255285
10-0.052799-0.40210.344542
110.2637552.00870.024616
12-0.271785-2.06990.021465
13-0.005818-0.04430.482405
14-0.044745-0.34080.367254
150.0711150.54160.295086
16-0.269555-2.05290.022303
170.0027280.02080.491747
18-0.023328-0.17770.429805
19-0.076939-0.5860.280091
20-0.050058-0.38120.352212
21-0.045582-0.34710.364872
220.0203030.15460.438829
23-0.099959-0.76130.224792
24-0.059889-0.45610.32501
25-0.089828-0.68410.248316
26-0.023044-0.17550.430651
27-0.277741-2.11520.019359
280.0984730.750.228158
29-0.116147-0.88460.190026
30-0.132195-1.00680.159115
31-0.118439-0.9020.185392
32-0.003406-0.02590.489696
330.0922660.70270.242534
34-0.020228-0.15410.439052
350.085920.65430.257738
36-0.079883-0.60840.272659
370.017590.1340.446949
38-0.047787-0.36390.358615
390.1076240.81960.207888
400.0104910.07990.468297
410.0024760.01890.492512
420.0725360.55240.291393
430.0717750.54660.293368
440.0562580.42850.334955
45-0.020818-0.15850.437289
460.0333540.2540.400191
47-0.012768-0.09720.461437
480.015510.11810.45319
490.026230.19980.421181
50-0.011982-0.09130.463803
510.0319420.24330.404331
52-0.010183-0.07760.469226
530.0069210.05270.479071
54-0.001681-0.01280.494915
55-0.017457-0.13290.447347
560.0105450.08030.468133
57-0.011416-0.08690.465507
58NANANA
59NANANA
60NANANA


Partial Autocorrelation Function
Time lag kPACF(k)T-STATP-value
1-0.068946-0.52510.300766
20.1865991.42110.080322
3-0.06507-0.49560.311041
40.1616231.23090.111667
50.079920.60870.272566
6-0.024448-0.18620.426474
70.1210230.92170.180256
8-0.124942-0.95150.172641
90.0285110.21710.414432
10-0.002294-0.01750.49306
110.2020551.53880.064645
12-0.242065-1.84350.035182
13-0.116798-0.88950.188703
140.0776160.59110.278372
15-0.009672-0.07370.470768
16-0.290582-2.2130.015423
170.0558330.42520.336128
180.055590.42340.336799
19-0.077193-0.58790.279445
20-0.045256-0.34470.3658
210.039360.29980.382717
22-0.028125-0.21420.415572
230.0796710.60680.273189
24-0.14992-1.14180.129123
25-0.138294-1.05320.148305
260.0468540.35680.361258
27-0.169503-1.29090.100931
28-0.047585-0.36240.359187
29-0.054653-0.41620.339391
30-0.157407-1.19880.117745
31-0.02299-0.17510.43081
32-0.071457-0.54420.294194
330.1416791.0790.142528
340.0966610.73620.232303
350.0749510.57080.285166
36-0.054254-0.41320.340497
37-0.088702-0.67550.25101
380.0737120.56140.288353
39-0.053357-0.40640.342989
40-0.080958-0.61660.26997
410.0660260.50280.308492
420.0332160.2530.400596
43-0.131422-1.00090.16052
44-0.02244-0.17090.432449
45-0.005083-0.03870.484627
46-0.127319-0.96960.168127
470.0490470.37350.355058
48-0.04038-0.30750.379773
49-0.001735-0.01320.49475
500.0355520.27080.39377
51-0.002109-0.01610.49362
52-0.042824-0.32610.372747
53-0.064422-0.49060.312772
54-0.045807-0.34890.364232
55-0.056106-0.42730.335376
56-0.092469-0.70420.242057
57-0.012359-0.09410.462669
58NANANA
59NANANA
60NANANA

\begin{tabular}{lllllllll}
\hline
Partial Autocorrelation Function \tabularnewline
Time lag k & PACF(k) & T-STAT & P-value \tabularnewline
1 & -0.068946 & -0.5251 & 0.300766 \tabularnewline
2 & 0.186599 & 1.4211 & 0.080322 \tabularnewline
3 & -0.06507 & -0.4956 & 0.311041 \tabularnewline
4 & 0.161623 & 1.2309 & 0.111667 \tabularnewline
5 & 0.07992 & 0.6087 & 0.272566 \tabularnewline
6 & -0.024448 & -0.1862 & 0.426474 \tabularnewline
7 & 0.121023 & 0.9217 & 0.180256 \tabularnewline
8 & -0.124942 & -0.9515 & 0.172641 \tabularnewline
9 & 0.028511 & 0.2171 & 0.414432 \tabularnewline
10 & -0.002294 & -0.0175 & 0.49306 \tabularnewline
11 & 0.202055 & 1.5388 & 0.064645 \tabularnewline
12 & -0.242065 & -1.8435 & 0.035182 \tabularnewline
13 & -0.116798 & -0.8895 & 0.188703 \tabularnewline
14 & 0.077616 & 0.5911 & 0.278372 \tabularnewline
15 & -0.009672 & -0.0737 & 0.470768 \tabularnewline
16 & -0.290582 & -2.213 & 0.015423 \tabularnewline
17 & 0.055833 & 0.4252 & 0.336128 \tabularnewline
18 & 0.05559 & 0.4234 & 0.336799 \tabularnewline
19 & -0.077193 & -0.5879 & 0.279445 \tabularnewline
20 & -0.045256 & -0.3447 & 0.3658 \tabularnewline
21 & 0.03936 & 0.2998 & 0.382717 \tabularnewline
22 & -0.028125 & -0.2142 & 0.415572 \tabularnewline
23 & 0.079671 & 0.6068 & 0.273189 \tabularnewline
24 & -0.14992 & -1.1418 & 0.129123 \tabularnewline
25 & -0.138294 & -1.0532 & 0.148305 \tabularnewline
26 & 0.046854 & 0.3568 & 0.361258 \tabularnewline
27 & -0.169503 & -1.2909 & 0.100931 \tabularnewline
28 & -0.047585 & -0.3624 & 0.359187 \tabularnewline
29 & -0.054653 & -0.4162 & 0.339391 \tabularnewline
30 & -0.157407 & -1.1988 & 0.117745 \tabularnewline
31 & -0.02299 & -0.1751 & 0.43081 \tabularnewline
32 & -0.071457 & -0.5442 & 0.294194 \tabularnewline
33 & 0.141679 & 1.079 & 0.142528 \tabularnewline
34 & 0.096661 & 0.7362 & 0.232303 \tabularnewline
35 & 0.074951 & 0.5708 & 0.285166 \tabularnewline
36 & -0.054254 & -0.4132 & 0.340497 \tabularnewline
37 & -0.088702 & -0.6755 & 0.25101 \tabularnewline
38 & 0.073712 & 0.5614 & 0.288353 \tabularnewline
39 & -0.053357 & -0.4064 & 0.342989 \tabularnewline
40 & -0.080958 & -0.6166 & 0.26997 \tabularnewline
41 & 0.066026 & 0.5028 & 0.308492 \tabularnewline
42 & 0.033216 & 0.253 & 0.400596 \tabularnewline
43 & -0.131422 & -1.0009 & 0.16052 \tabularnewline
44 & -0.02244 & -0.1709 & 0.432449 \tabularnewline
45 & -0.005083 & -0.0387 & 0.484627 \tabularnewline
46 & -0.127319 & -0.9696 & 0.168127 \tabularnewline
47 & 0.049047 & 0.3735 & 0.355058 \tabularnewline
48 & -0.04038 & -0.3075 & 0.379773 \tabularnewline
49 & -0.001735 & -0.0132 & 0.49475 \tabularnewline
50 & 0.035552 & 0.2708 & 0.39377 \tabularnewline
51 & -0.002109 & -0.0161 & 0.49362 \tabularnewline
52 & -0.042824 & -0.3261 & 0.372747 \tabularnewline
53 & -0.064422 & -0.4906 & 0.312772 \tabularnewline
54 & -0.045807 & -0.3489 & 0.364232 \tabularnewline
55 & -0.056106 & -0.4273 & 0.335376 \tabularnewline
56 & -0.092469 & -0.7042 & 0.242057 \tabularnewline
57 & -0.012359 & -0.0941 & 0.462669 \tabularnewline
58 & NA & NA & NA \tabularnewline
59 & NA & NA & NA \tabularnewline
60 & NA & NA & NA \tabularnewline
\hline
\end{tabular}
%Source: https://freestatistics.org/blog/index.php?pk=116898&T=2

[TABLE]
[ROW][C]Partial Autocorrelation Function[/C][/ROW]
[ROW][C]Time lag k[/C][C]PACF(k)[/C][C]T-STAT[/C][C]P-value[/C][/ROW]
[ROW][C]1[/C][C]-0.068946[/C][C]-0.5251[/C][C]0.300766[/C][/ROW]
[ROW][C]2[/C][C]0.186599[/C][C]1.4211[/C][C]0.080322[/C][/ROW]
[ROW][C]3[/C][C]-0.06507[/C][C]-0.4956[/C][C]0.311041[/C][/ROW]
[ROW][C]4[/C][C]0.161623[/C][C]1.2309[/C][C]0.111667[/C][/ROW]
[ROW][C]5[/C][C]0.07992[/C][C]0.6087[/C][C]0.272566[/C][/ROW]
[ROW][C]6[/C][C]-0.024448[/C][C]-0.1862[/C][C]0.426474[/C][/ROW]
[ROW][C]7[/C][C]0.121023[/C][C]0.9217[/C][C]0.180256[/C][/ROW]
[ROW][C]8[/C][C]-0.124942[/C][C]-0.9515[/C][C]0.172641[/C][/ROW]
[ROW][C]9[/C][C]0.028511[/C][C]0.2171[/C][C]0.414432[/C][/ROW]
[ROW][C]10[/C][C]-0.002294[/C][C]-0.0175[/C][C]0.49306[/C][/ROW]
[ROW][C]11[/C][C]0.202055[/C][C]1.5388[/C][C]0.064645[/C][/ROW]
[ROW][C]12[/C][C]-0.242065[/C][C]-1.8435[/C][C]0.035182[/C][/ROW]
[ROW][C]13[/C][C]-0.116798[/C][C]-0.8895[/C][C]0.188703[/C][/ROW]
[ROW][C]14[/C][C]0.077616[/C][C]0.5911[/C][C]0.278372[/C][/ROW]
[ROW][C]15[/C][C]-0.009672[/C][C]-0.0737[/C][C]0.470768[/C][/ROW]
[ROW][C]16[/C][C]-0.290582[/C][C]-2.213[/C][C]0.015423[/C][/ROW]
[ROW][C]17[/C][C]0.055833[/C][C]0.4252[/C][C]0.336128[/C][/ROW]
[ROW][C]18[/C][C]0.05559[/C][C]0.4234[/C][C]0.336799[/C][/ROW]
[ROW][C]19[/C][C]-0.077193[/C][C]-0.5879[/C][C]0.279445[/C][/ROW]
[ROW][C]20[/C][C]-0.045256[/C][C]-0.3447[/C][C]0.3658[/C][/ROW]
[ROW][C]21[/C][C]0.03936[/C][C]0.2998[/C][C]0.382717[/C][/ROW]
[ROW][C]22[/C][C]-0.028125[/C][C]-0.2142[/C][C]0.415572[/C][/ROW]
[ROW][C]23[/C][C]0.079671[/C][C]0.6068[/C][C]0.273189[/C][/ROW]
[ROW][C]24[/C][C]-0.14992[/C][C]-1.1418[/C][C]0.129123[/C][/ROW]
[ROW][C]25[/C][C]-0.138294[/C][C]-1.0532[/C][C]0.148305[/C][/ROW]
[ROW][C]26[/C][C]0.046854[/C][C]0.3568[/C][C]0.361258[/C][/ROW]
[ROW][C]27[/C][C]-0.169503[/C][C]-1.2909[/C][C]0.100931[/C][/ROW]
[ROW][C]28[/C][C]-0.047585[/C][C]-0.3624[/C][C]0.359187[/C][/ROW]
[ROW][C]29[/C][C]-0.054653[/C][C]-0.4162[/C][C]0.339391[/C][/ROW]
[ROW][C]30[/C][C]-0.157407[/C][C]-1.1988[/C][C]0.117745[/C][/ROW]
[ROW][C]31[/C][C]-0.02299[/C][C]-0.1751[/C][C]0.43081[/C][/ROW]
[ROW][C]32[/C][C]-0.071457[/C][C]-0.5442[/C][C]0.294194[/C][/ROW]
[ROW][C]33[/C][C]0.141679[/C][C]1.079[/C][C]0.142528[/C][/ROW]
[ROW][C]34[/C][C]0.096661[/C][C]0.7362[/C][C]0.232303[/C][/ROW]
[ROW][C]35[/C][C]0.074951[/C][C]0.5708[/C][C]0.285166[/C][/ROW]
[ROW][C]36[/C][C]-0.054254[/C][C]-0.4132[/C][C]0.340497[/C][/ROW]
[ROW][C]37[/C][C]-0.088702[/C][C]-0.6755[/C][C]0.25101[/C][/ROW]
[ROW][C]38[/C][C]0.073712[/C][C]0.5614[/C][C]0.288353[/C][/ROW]
[ROW][C]39[/C][C]-0.053357[/C][C]-0.4064[/C][C]0.342989[/C][/ROW]
[ROW][C]40[/C][C]-0.080958[/C][C]-0.6166[/C][C]0.26997[/C][/ROW]
[ROW][C]41[/C][C]0.066026[/C][C]0.5028[/C][C]0.308492[/C][/ROW]
[ROW][C]42[/C][C]0.033216[/C][C]0.253[/C][C]0.400596[/C][/ROW]
[ROW][C]43[/C][C]-0.131422[/C][C]-1.0009[/C][C]0.16052[/C][/ROW]
[ROW][C]44[/C][C]-0.02244[/C][C]-0.1709[/C][C]0.432449[/C][/ROW]
[ROW][C]45[/C][C]-0.005083[/C][C]-0.0387[/C][C]0.484627[/C][/ROW]
[ROW][C]46[/C][C]-0.127319[/C][C]-0.9696[/C][C]0.168127[/C][/ROW]
[ROW][C]47[/C][C]0.049047[/C][C]0.3735[/C][C]0.355058[/C][/ROW]
[ROW][C]48[/C][C]-0.04038[/C][C]-0.3075[/C][C]0.379773[/C][/ROW]
[ROW][C]49[/C][C]-0.001735[/C][C]-0.0132[/C][C]0.49475[/C][/ROW]
[ROW][C]50[/C][C]0.035552[/C][C]0.2708[/C][C]0.39377[/C][/ROW]
[ROW][C]51[/C][C]-0.002109[/C][C]-0.0161[/C][C]0.49362[/C][/ROW]
[ROW][C]52[/C][C]-0.042824[/C][C]-0.3261[/C][C]0.372747[/C][/ROW]
[ROW][C]53[/C][C]-0.064422[/C][C]-0.4906[/C][C]0.312772[/C][/ROW]
[ROW][C]54[/C][C]-0.045807[/C][C]-0.3489[/C][C]0.364232[/C][/ROW]
[ROW][C]55[/C][C]-0.056106[/C][C]-0.4273[/C][C]0.335376[/C][/ROW]
[ROW][C]56[/C][C]-0.092469[/C][C]-0.7042[/C][C]0.242057[/C][/ROW]
[ROW][C]57[/C][C]-0.012359[/C][C]-0.0941[/C][C]0.462669[/C][/ROW]
[ROW][C]58[/C][C]NA[/C][C]NA[/C][C]NA[/C][/ROW]
[ROW][C]59[/C][C]NA[/C][C]NA[/C][C]NA[/C][/ROW]
[ROW][C]60[/C][C]NA[/C][C]NA[/C][C]NA[/C][/ROW]
[/TABLE]
Source: https://freestatistics.org/blog/index.php?pk=116898&T=2

Globally Unique Identifier (entire table): ba.freestatistics.org/blog/index.php?pk=116898&T=2

As an alternative you can also use a QR Code:  

The GUIDs for individual cells are displayed in the table below:

Partial Autocorrelation Function
Time lag kPACF(k)T-STATP-value
1-0.068946-0.52510.300766
20.1865991.42110.080322
3-0.06507-0.49560.311041
40.1616231.23090.111667
50.079920.60870.272566
6-0.024448-0.18620.426474
70.1210230.92170.180256
8-0.124942-0.95150.172641
90.0285110.21710.414432
10-0.002294-0.01750.49306
110.2020551.53880.064645
12-0.242065-1.84350.035182
13-0.116798-0.88950.188703
140.0776160.59110.278372
15-0.009672-0.07370.470768
16-0.290582-2.2130.015423
170.0558330.42520.336128
180.055590.42340.336799
19-0.077193-0.58790.279445
20-0.045256-0.34470.3658
210.039360.29980.382717
22-0.028125-0.21420.415572
230.0796710.60680.273189
24-0.14992-1.14180.129123
25-0.138294-1.05320.148305
260.0468540.35680.361258
27-0.169503-1.29090.100931
28-0.047585-0.36240.359187
29-0.054653-0.41620.339391
30-0.157407-1.19880.117745
31-0.02299-0.17510.43081
32-0.071457-0.54420.294194
330.1416791.0790.142528
340.0966610.73620.232303
350.0749510.57080.285166
36-0.054254-0.41320.340497
37-0.088702-0.67550.25101
380.0737120.56140.288353
39-0.053357-0.40640.342989
40-0.080958-0.61660.26997
410.0660260.50280.308492
420.0332160.2530.400596
43-0.131422-1.00090.16052
44-0.02244-0.17090.432449
45-0.005083-0.03870.484627
46-0.127319-0.96960.168127
470.0490470.37350.355058
48-0.04038-0.30750.379773
49-0.001735-0.01320.49475
500.0355520.27080.39377
51-0.002109-0.01610.49362
52-0.042824-0.32610.372747
53-0.064422-0.49060.312772
54-0.045807-0.34890.364232
55-0.056106-0.42730.335376
56-0.092469-0.70420.242057
57-0.012359-0.09410.462669
58NANANA
59NANANA
60NANANA


Parameters (Session):
par1 = 12 ; par2 = 0.5 ; par3 = 1 ; par4 = 1 ; par5 = 12 ; par6 = 2 ; par7 = 1 ; par8 = 0 ; par9 = 1 ; par10 = FALSE ;
Parameters (R input):
par1 = 60 ; par2 = 0.3 ; par3 = 1 ; par4 = 1 ; par5 = 12 ; par6 = White Noise ; par7 = 0.95 ; par8 = ;
R code (references can be found in the software module):
if (par1 == 'Default') {
par1 = 10*log10(length(x))
} else {
par1 <- as.numeric(par1)
}
par2 <- as.numeric(par2)
par3 <- as.numeric(par3)
par4 <- as.numeric(par4)
par5 <- as.numeric(par5)
if (par6 == 'White Noise') par6 <- 'white' else par6 <- 'ma'
par7 <- as.numeric(par7)
if (par8 != '') par8 <- as.numeric(par8)
ox <- x
if (par8 == '') {
if (par2 == 0) {
x <- log(x)
} else {
x <- (x ^ par2 - 1) / par2
}
} else {
x <- log(x,base=par8)
}
if (par3 > 0) x <- diff(x,lag=1,difference=par3)
if (par4 > 0) x <- diff(x,lag=par5,difference=par4)
bitmap(file='picts.png')
op <- par(mfrow=c(2,1))
plot(ox,type='l',main='Original Time Series',xlab='time',ylab='value')
if (par8=='') {
mytitle <- paste('Working Time Series (lambda=',par2,', d=',par3,', D=',par4,')',sep='')
mysub <- paste('(lambda=',par2,', d=',par3,', D=',par4,', CI=', par7, ', CI type=',par6,')',sep='')
} else {
mytitle <- paste('Working Time Series (base=',par8,', d=',par3,', D=',par4,')',sep='')
mysub <- paste('(base=',par8,', d=',par3,', D=',par4,', CI=', par7, ', CI type=',par6,')',sep='')
}
plot(x,type='l', main=mytitle,xlab='time',ylab='value')
par(op)
dev.off()
bitmap(file='pic1.png')
racf <- acf(x, par1, main='Autocorrelation', xlab='time lag', ylab='ACF', ci.type=par6, ci=par7, sub=mysub)
dev.off()
bitmap(file='pic2.png')
rpacf <- pacf(x,par1,main='Partial Autocorrelation',xlab='lags',ylab='PACF',sub=mysub)
dev.off()
(myacf <- c(racf$acf))
(mypacf <- c(rpacf$acf))
lengthx <- length(x)
sqrtn <- sqrt(lengthx)
load(file='createtable')
a<-table.start()
a<-table.row.start(a)
a<-table.element(a,'Autocorrelation Function',4,TRUE)
a<-table.row.end(a)
a<-table.row.start(a)
a<-table.element(a,'Time lag k',header=TRUE)
a<-table.element(a,hyperlink('basics.htm','ACF(k)','click here for more information about the Autocorrelation Function'),header=TRUE)
a<-table.element(a,'T-STAT',header=TRUE)
a<-table.element(a,'P-value',header=TRUE)
a<-table.row.end(a)
for (i in 2:(par1+1)) {
a<-table.row.start(a)
a<-table.element(a,i-1,header=TRUE)
a<-table.element(a,round(myacf[i],6))
mytstat <- myacf[i]*sqrtn
a<-table.element(a,round(mytstat,4))
a<-table.element(a,round(1-pt(abs(mytstat),lengthx),6))
a<-table.row.end(a)
}
a<-table.end(a)
table.save(a,file='mytable.tab')
a<-table.start()
a<-table.row.start(a)
a<-table.element(a,'Partial Autocorrelation Function',4,TRUE)
a<-table.row.end(a)
a<-table.row.start(a)
a<-table.element(a,'Time lag k',header=TRUE)
a<-table.element(a,hyperlink('basics.htm','PACF(k)','click here for more information about the Partial Autocorrelation Function'),header=TRUE)
a<-table.element(a,'T-STAT',header=TRUE)
a<-table.element(a,'P-value',header=TRUE)
a<-table.row.end(a)
for (i in 1:par1) {
a<-table.row.start(a)
a<-table.element(a,i,header=TRUE)
a<-table.element(a,round(mypacf[i],6))
mytstat <- mypacf[i]*sqrtn
a<-table.element(a,round(mytstat,4))
a<-table.element(a,round(1-pt(abs(mytstat),lengthx),6))
a<-table.row.end(a)
}
a<-table.end(a)
table.save(a,file='mytable1.tab')