Free Statistics

of Irreproducible Research!

Author's title

Author*Unverified author*
R Software Modulerwasp_smp.wasp
Title produced by softwareStandard Deviation-Mean Plot
Date of computationWed, 29 Dec 2010 15:06:08 +0000
Cite this page as followsStatistical Computations at FreeStatistics.org, Office for Research Development and Education, URL https://freestatistics.org/blog/index.php?v=date/2010/Dec/29/t1293635041evtwsb6vqgjipee.htm/, Retrieved Fri, 03 May 2024 05:24:37 +0000
Statistical Computations at FreeStatistics.org, Office for Research Development and Education, URL https://freestatistics.org/blog/index.php?pk=116896, Retrieved Fri, 03 May 2024 05:24:37 +0000
QR Codes:

Original text written by user:
IsPrivate?No (this computation is public)
User-defined keywords
Estimated Impact112
Family? (F = Feedback message, R = changed R code, M = changed R Module, P = changed Parameters, D = changed Data)
-       [Standard Deviation-Mean Plot] [Paper] [2010-12-29 15:06:08] [d5e0edb7e0239841e94676417b2a1e2e] [Current]
Feedback Forum

Post a new message
Dataseries X:
961
935
956
951
986
980
1031
1059
1036
1023
1030
1075
1151
1220
1290
1330
1419
1443
1516
1546
1579
1591
1603
1606
1616
1628
1594
1596
1526
1535
1581
1611
1571
1535
1498
1493
1480
1448
1462
1428
1315
1186
1230
1271
1243
1220
1214
1227
1262
1274
1272
1249
1266
1307
1345
1369
1374
1400
1425
1465
1510
1508
1512
1539
1569
1571
1650
1736
1700
1731
1752


Summary of computational transaction
Raw Inputview raw input (R code)
Raw Outputview raw output of R engine
Computing time2 seconds
R Server'Sir Ronald Aylmer Fisher' @ 193.190.124.24
R Framework error message
Warning: there are blank lines in the 'Data' field.
Please, use NA for missing data - blank lines are simply
 deleted and are NOT treated as missing values.

\begin{tabular}{lllllllll}
\hline
Summary of computational transaction \tabularnewline
Raw Input & view raw input (R code)  \tabularnewline
Raw Output & view raw output of R engine  \tabularnewline
Computing time & 2 seconds \tabularnewline
R Server & 'Sir Ronald Aylmer Fisher' @ 193.190.124.24 \tabularnewline
R Framework error message & 
Warning: there are blank lines in the 'Data' field.
Please, use NA for missing data - blank lines are simply
 deleted and are NOT treated as missing values.
\tabularnewline \hline \end{tabular} %Source: https://freestatistics.org/blog/index.php?pk=116896&T=0

[TABLE]
[ROW][C]Summary of computational transaction[/C][/ROW]
[ROW][C]Raw Input[/C][C]view raw input (R code) [/C][/ROW]
[ROW][C]Raw Output[/C][C]view raw output of R engine [/C][/ROW]
[ROW][C]Computing time[/C][C]2 seconds[/C][/ROW]
[ROW][C]R Server[/C][C]'Sir Ronald Aylmer Fisher' @ 193.190.124.24[/C][/ROW]
[ROW][C]R Framework error message[/C][C]
Warning: there are blank lines in the 'Data' field.
Please, use NA for missing data - blank lines are simply
 deleted and are NOT treated as missing values.
[/C][/ROW] [/TABLE] Source: https://freestatistics.org/blog/index.php?pk=116896&T=0

Globally Unique Identifier (entire table): ba.freestatistics.org/blog/index.php?pk=116896&T=0

As an alternative you can also use a QR Code:  

The GUIDs for individual cells are displayed in the table below:

Summary of computational transaction
Raw Inputview raw input (R code)
Raw Outputview raw output of R engine
Computing time2 seconds
R Server'Sir Ronald Aylmer Fisher' @ 193.190.124.24
R Framework error message
Warning: there are blank lines in the 'Data' field.
Please, use NA for missing data - blank lines are simply
 deleted and are NOT treated as missing values.


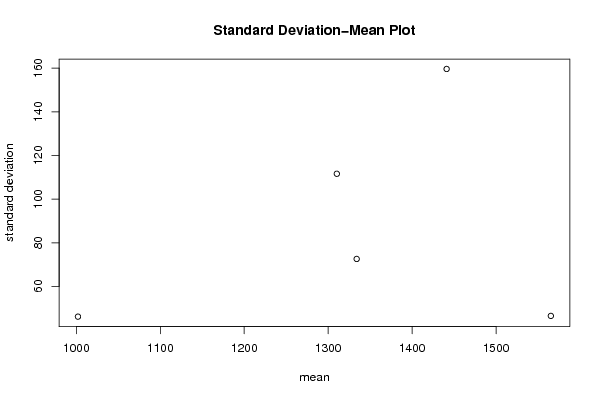
Standard Deviation-Mean Plot
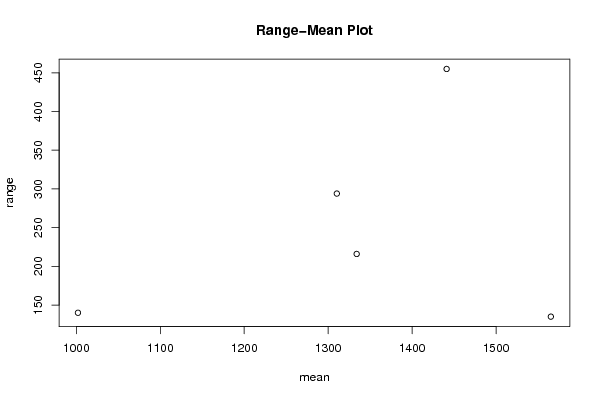
SectionMeanStandard DeviationRange
11001.9166666666746.1488861942485140
21441.16666666667159.605669376027455
31565.3333333333346.4881868344154135
41310.33333333333111.594504046272294
5133472.5822417550038216

\begin{tabular}{lllllllll}
\hline
Standard Deviation-Mean Plot \tabularnewline
Section & Mean & Standard Deviation & Range \tabularnewline
1 & 1001.91666666667 & 46.1488861942485 & 140 \tabularnewline
2 & 1441.16666666667 & 159.605669376027 & 455 \tabularnewline
3 & 1565.33333333333 & 46.4881868344154 & 135 \tabularnewline
4 & 1310.33333333333 & 111.594504046272 & 294 \tabularnewline
5 & 1334 & 72.5822417550038 & 216 \tabularnewline
\hline
\end{tabular}
%Source: https://freestatistics.org/blog/index.php?pk=116896&T=1

[TABLE]
[ROW][C]Standard Deviation-Mean Plot[/C][/ROW]
[ROW][C]Section[/C][C]Mean[/C][C]Standard Deviation[/C][C]Range[/C][/ROW]
[ROW][C]1[/C][C]1001.91666666667[/C][C]46.1488861942485[/C][C]140[/C][/ROW]
[ROW][C]2[/C][C]1441.16666666667[/C][C]159.605669376027[/C][C]455[/C][/ROW]
[ROW][C]3[/C][C]1565.33333333333[/C][C]46.4881868344154[/C][C]135[/C][/ROW]
[ROW][C]4[/C][C]1310.33333333333[/C][C]111.594504046272[/C][C]294[/C][/ROW]
[ROW][C]5[/C][C]1334[/C][C]72.5822417550038[/C][C]216[/C][/ROW]
[/TABLE]
Source: https://freestatistics.org/blog/index.php?pk=116896&T=1

Globally Unique Identifier (entire table): ba.freestatistics.org/blog/index.php?pk=116896&T=1

As an alternative you can also use a QR Code:  

The GUIDs for individual cells are displayed in the table below:

Standard Deviation-Mean Plot
SectionMeanStandard DeviationRange
11001.9166666666746.1488861942485140
21441.16666666667159.605669376027455
31565.3333333333346.4881868344154135
41310.33333333333111.594504046272294
5133472.5822417550038216


Regression: S.E.(k) = alpha + beta * Mean(k)
alpha1.00787535258491
beta0.0648423751746333
S.D.0.12811079950939
T-STAT0.506142928019746
p-value0.64760755784923

\begin{tabular}{lllllllll}
\hline
Regression: S.E.(k) = alpha + beta * Mean(k) \tabularnewline
alpha & 1.00787535258491 \tabularnewline
beta & 0.0648423751746333 \tabularnewline
S.D. & 0.12811079950939 \tabularnewline
T-STAT & 0.506142928019746 \tabularnewline
p-value & 0.64760755784923 \tabularnewline
\hline
\end{tabular}
%Source: https://freestatistics.org/blog/index.php?pk=116896&T=2

[TABLE]
[ROW][C]Regression: S.E.(k) = alpha + beta * Mean(k)[/C][/ROW]
[ROW][C]alpha[/C][C]1.00787535258491[/C][/ROW]
[ROW][C]beta[/C][C]0.0648423751746333[/C][/ROW]
[ROW][C]S.D.[/C][C]0.12811079950939[/C][/ROW]
[ROW][C]T-STAT[/C][C]0.506142928019746[/C][/ROW]
[ROW][C]p-value[/C][C]0.64760755784923[/C][/ROW]
[/TABLE]
Source: https://freestatistics.org/blog/index.php?pk=116896&T=2

Globally Unique Identifier (entire table): ba.freestatistics.org/blog/index.php?pk=116896&T=2

As an alternative you can also use a QR Code:  

The GUIDs for individual cells are displayed in the table below:

Regression: S.E.(k) = alpha + beta * Mean(k)
alpha1.00787535258491
beta0.0648423751746333
S.D.0.12811079950939
T-STAT0.506142928019746
p-value0.64760755784923


Regression: ln S.E.(k) = alpha + beta * ln Mean(k)
alpha-3.02118464568844
beta1.02607951834764
S.D.1.77741796963512
T-STAT0.577286567299802
p-value0.604219234775545
Lambda-0.0260795183476401

\begin{tabular}{lllllllll}
\hline
Regression: ln S.E.(k) = alpha + beta * ln Mean(k) \tabularnewline
alpha & -3.02118464568844 \tabularnewline
beta & 1.02607951834764 \tabularnewline
S.D. & 1.77741796963512 \tabularnewline
T-STAT & 0.577286567299802 \tabularnewline
p-value & 0.604219234775545 \tabularnewline
Lambda & -0.0260795183476401 \tabularnewline
\hline
\end{tabular}
%Source: https://freestatistics.org/blog/index.php?pk=116896&T=3

[TABLE]
[ROW][C]Regression: ln S.E.(k) = alpha + beta * ln Mean(k)[/C][/ROW]
[ROW][C]alpha[/C][C]-3.02118464568844[/C][/ROW]
[ROW][C]beta[/C][C]1.02607951834764[/C][/ROW]
[ROW][C]S.D.[/C][C]1.77741796963512[/C][/ROW]
[ROW][C]T-STAT[/C][C]0.577286567299802[/C][/ROW]
[ROW][C]p-value[/C][C]0.604219234775545[/C][/ROW]
[ROW][C]Lambda[/C][C]-0.0260795183476401[/C][/ROW]
[/TABLE]
Source: https://freestatistics.org/blog/index.php?pk=116896&T=3

Globally Unique Identifier (entire table): ba.freestatistics.org/blog/index.php?pk=116896&T=3

As an alternative you can also use a QR Code:  

The GUIDs for individual cells are displayed in the table below:

Regression: ln S.E.(k) = alpha + beta * ln Mean(k)
alpha-3.02118464568844
beta1.02607951834764
S.D.1.77741796963512
T-STAT0.577286567299802
p-value0.604219234775545
Lambda-0.0260795183476401


Parameters (Session):
par1 = 1 ; par2 = 1 ; par3 = 0 ; par4 = 12 ;
Parameters (R input):
par1 = 12 ;
R code (references can be found in the software module):
par1 <- as.numeric(par1)
(n <- length(x))
(np <- floor(n / par1))
arr <- array(NA,dim=c(par1,np))
j <- 0
k <- 1
for (i in 1:(np*par1))
{
j = j + 1
arr[j,k] <- x[i]
if (j == par1) {
j = 0
k=k+1
}
}
arr
arr.mean <- array(NA,dim=np)
arr.sd <- array(NA,dim=np)
arr.range <- array(NA,dim=np)
for (j in 1:np)
{
arr.mean[j] <- mean(arr[,j],na.rm=TRUE)
arr.sd[j] <- sd(arr[,j],na.rm=TRUE)
arr.range[j] <- max(arr[,j],na.rm=TRUE) - min(arr[,j],na.rm=TRUE)
}
arr.mean
arr.sd
arr.range
(lm1 <- lm(arr.sd~arr.mean))
(lnlm1 <- lm(log(arr.sd)~log(arr.mean)))
(lm2 <- lm(arr.range~arr.mean))
bitmap(file='test1.png')
plot(arr.mean,arr.sd,main='Standard Deviation-Mean Plot',xlab='mean',ylab='standard deviation')
dev.off()
bitmap(file='test2.png')
plot(arr.mean,arr.range,main='Range-Mean Plot',xlab='mean',ylab='range')
dev.off()
load(file='createtable')
a<-table.start()
a<-table.row.start(a)
a<-table.element(a,'Standard Deviation-Mean Plot',4,TRUE)
a<-table.row.end(a)
a<-table.row.start(a)
a<-table.element(a,'Section',header=TRUE)
a<-table.element(a,'Mean',header=TRUE)
a<-table.element(a,'Standard Deviation',header=TRUE)
a<-table.element(a,'Range',header=TRUE)
a<-table.row.end(a)
for (j in 1:np) {
a<-table.row.start(a)
a<-table.element(a,j,header=TRUE)
a<-table.element(a,arr.mean[j])
a<-table.element(a,arr.sd[j] )
a<-table.element(a,arr.range[j] )
a<-table.row.end(a)
}
a<-table.end(a)
table.save(a,file='mytable.tab')
a<-table.start()
a<-table.row.start(a)
a<-table.element(a,'Regression: S.E.(k) = alpha + beta * Mean(k)',2,TRUE)
a<-table.row.end(a)
a<-table.row.start(a)
a<-table.element(a,'alpha',header=TRUE)
a<-table.element(a,lm1$coefficients[[1]])
a<-table.row.end(a)
a<-table.row.start(a)
a<-table.element(a,'beta',header=TRUE)
a<-table.element(a,lm1$coefficients[[2]])
a<-table.row.end(a)
a<-table.row.start(a)
a<-table.element(a,'S.D.',header=TRUE)
a<-table.element(a,summary(lm1)$coefficients[2,2])
a<-table.row.end(a)
a<-table.row.start(a)
a<-table.element(a,'T-STAT',header=TRUE)
a<-table.element(a,summary(lm1)$coefficients[2,3])
a<-table.row.end(a)
a<-table.row.start(a)
a<-table.element(a,'p-value',header=TRUE)
a<-table.element(a,summary(lm1)$coefficients[2,4])
a<-table.row.end(a)
a<-table.end(a)
table.save(a,file='mytable1.tab')
a<-table.start()
a<-table.row.start(a)
a<-table.element(a,'Regression: ln S.E.(k) = alpha + beta * ln Mean(k)',2,TRUE)
a<-table.row.end(a)
a<-table.row.start(a)
a<-table.element(a,'alpha',header=TRUE)
a<-table.element(a,lnlm1$coefficients[[1]])
a<-table.row.end(a)
a<-table.row.start(a)
a<-table.element(a,'beta',header=TRUE)
a<-table.element(a,lnlm1$coefficients[[2]])
a<-table.row.end(a)
a<-table.row.start(a)
a<-table.element(a,'S.D.',header=TRUE)
a<-table.element(a,summary(lnlm1)$coefficients[2,2])
a<-table.row.end(a)
a<-table.row.start(a)
a<-table.element(a,'T-STAT',header=TRUE)
a<-table.element(a,summary(lnlm1)$coefficients[2,3])
a<-table.row.end(a)
a<-table.row.start(a)
a<-table.element(a,'p-value',header=TRUE)
a<-table.element(a,summary(lnlm1)$coefficients[2,4])
a<-table.row.end(a)
a<-table.row.start(a)
a<-table.element(a,'Lambda',header=TRUE)
a<-table.element(a,1-lnlm1$coefficients[[2]])
a<-table.row.end(a)
a<-table.end(a)
table.save(a,file='mytable2.tab')