Free Statistics

of Irreproducible Research!

Author's title

Author*Unverified author*
R Software Modulerwasp_autocorrelation.wasp
Title produced by software(Partial) Autocorrelation Function
Date of computationWed, 29 Dec 2010 15:03:24 +0000
Cite this page as followsStatistical Computations at FreeStatistics.org, Office for Research Development and Education, URL https://freestatistics.org/blog/index.php?v=date/2010/Dec/29/t1293634874lgu4h31yx8x1pzm.htm/, Retrieved Fri, 03 May 2024 11:18:27 +0000
Statistical Computations at FreeStatistics.org, Office for Research Development and Education, URL https://freestatistics.org/blog/index.php?pk=116894, Retrieved Fri, 03 May 2024 11:18:27 +0000
QR Codes:

Original text written by user:
IsPrivate?No (this computation is public)
User-defined keywords
Estimated Impact117
Family? (F = Feedback message, R = changed R code, M = changed R Module, P = changed Parameters, D = changed Data)
-       [(Partial) Autocorrelation Function] [Paper] [2010-12-29 15:03:24] [d5e0edb7e0239841e94676417b2a1e2e] [Current]
Feedback Forum

Post a new message
Dataseries X:
961
935
956
951
986
980
1031
1059
1036
1023
1030
1075
1151
1220
1290
1330
1419
1443
1516
1546
1579
1591
1603
1606
1616
1628
1594
1596
1526
1535
1581
1611
1571
1535
1498
1493
1480
1448
1462
1428
1315
1186
1230
1271
1243
1220
1214
1227
1262
1274
1272
1249
1266
1307
1345
1369
1374
1400
1425
1465
1510
1508
1512
1539
1569
1571
1650
1736
1700
1731
1752


Summary of computational transaction
Raw Inputview raw input (R code)
Raw Outputview raw output of R engine
Computing time2 seconds
R Server'George Udny Yule' @ 72.249.76.132
R Framework error message
Warning: there are blank lines in the 'Data' field.
Please, use NA for missing data - blank lines are simply
 deleted and are NOT treated as missing values.

\begin{tabular}{lllllllll}
\hline
Summary of computational transaction \tabularnewline
Raw Input & view raw input (R code)  \tabularnewline
Raw Output & view raw output of R engine  \tabularnewline
Computing time & 2 seconds \tabularnewline
R Server & 'George Udny Yule' @ 72.249.76.132 \tabularnewline
R Framework error message & 
Warning: there are blank lines in the 'Data' field.
Please, use NA for missing data - blank lines are simply
 deleted and are NOT treated as missing values.
\tabularnewline \hline \end{tabular} %Source: https://freestatistics.org/blog/index.php?pk=116894&T=0

[TABLE]
[ROW][C]Summary of computational transaction[/C][/ROW]
[ROW][C]Raw Input[/C][C]view raw input (R code) [/C][/ROW]
[ROW][C]Raw Output[/C][C]view raw output of R engine [/C][/ROW]
[ROW][C]Computing time[/C][C]2 seconds[/C][/ROW]
[ROW][C]R Server[/C][C]'George Udny Yule' @ 72.249.76.132[/C][/ROW]
[ROW][C]R Framework error message[/C][C]
Warning: there are blank lines in the 'Data' field.
Please, use NA for missing data - blank lines are simply
 deleted and are NOT treated as missing values.
[/C][/ROW] [/TABLE] Source: https://freestatistics.org/blog/index.php?pk=116894&T=0

Globally Unique Identifier (entire table): ba.freestatistics.org/blog/index.php?pk=116894&T=0

As an alternative you can also use a QR Code:  

The GUIDs for individual cells are displayed in the table below:

Summary of computational transaction
Raw Inputview raw input (R code)
Raw Outputview raw output of R engine
Computing time2 seconds
R Server'George Udny Yule' @ 72.249.76.132
R Framework error message
Warning: there are blank lines in the 'Data' field.
Please, use NA for missing data - blank lines are simply
 deleted and are NOT treated as missing values.


Autocorrelation Function
Time lag kACF(k)T-STATP-value
10.4102013.4320.000505
20.1413781.18290.120435
30.1367781.14440.128186
40.2814232.35460.010677
50.2555932.13840.017986
60.2511642.10140.019604
70.2186651.82950.035793
80.0667960.55890.289023
90.0287350.24040.405357
10-0.049553-0.41460.339855
110.0398410.33330.36994
120.0959270.80260.212467
130.0174760.14620.442085
14-0.104161-0.87150.193238
15-0.143804-1.20310.116486
16-0.132225-1.10630.136197
17-0.05265-0.44050.330466
18-0.040081-0.33530.369185
19-0.163228-1.36570.088208
20-0.231465-1.93660.028417
21-0.25264-2.11370.019051
22-0.270049-2.25940.013487
23-0.168373-1.40870.081674
24-0.084087-0.70350.242031
25-0.245472-2.05380.021867
26-0.380242-3.18130.001093
27-0.226468-1.89480.031127
28-0.176802-1.47920.071782
29-0.15581-1.30360.098321
30-0.128008-1.0710.143926
31-0.02677-0.2240.411715
32-0.032446-0.27150.393417
33-0.09139-0.76460.223533
34-0.120473-1.00790.158476
35-0.047909-0.40080.344881
360.1026120.85850.196771
370.0114020.09540.462137
38-0.052436-0.43870.33111
39-0.004786-0.040.484088
400.0726590.60790.272608
410.027540.23040.409221
420.0774070.64760.25967
430.0422560.35350.362374
440.0333890.27940.390399
450.0193850.16220.435813
460.0579860.48510.314543
470.0591810.49510.311026
480.0836660.70.243124

\begin{tabular}{lllllllll}
\hline
Autocorrelation Function \tabularnewline
Time lag k & ACF(k) & T-STAT & P-value \tabularnewline
1 & 0.410201 & 3.432 & 0.000505 \tabularnewline
2 & 0.141378 & 1.1829 & 0.120435 \tabularnewline
3 & 0.136778 & 1.1444 & 0.128186 \tabularnewline
4 & 0.281423 & 2.3546 & 0.010677 \tabularnewline
5 & 0.255593 & 2.1384 & 0.017986 \tabularnewline
6 & 0.251164 & 2.1014 & 0.019604 \tabularnewline
7 & 0.218665 & 1.8295 & 0.035793 \tabularnewline
8 & 0.066796 & 0.5589 & 0.289023 \tabularnewline
9 & 0.028735 & 0.2404 & 0.405357 \tabularnewline
10 & -0.049553 & -0.4146 & 0.339855 \tabularnewline
11 & 0.039841 & 0.3333 & 0.36994 \tabularnewline
12 & 0.095927 & 0.8026 & 0.212467 \tabularnewline
13 & 0.017476 & 0.1462 & 0.442085 \tabularnewline
14 & -0.104161 & -0.8715 & 0.193238 \tabularnewline
15 & -0.143804 & -1.2031 & 0.116486 \tabularnewline
16 & -0.132225 & -1.1063 & 0.136197 \tabularnewline
17 & -0.05265 & -0.4405 & 0.330466 \tabularnewline
18 & -0.040081 & -0.3353 & 0.369185 \tabularnewline
19 & -0.163228 & -1.3657 & 0.088208 \tabularnewline
20 & -0.231465 & -1.9366 & 0.028417 \tabularnewline
21 & -0.25264 & -2.1137 & 0.019051 \tabularnewline
22 & -0.270049 & -2.2594 & 0.013487 \tabularnewline
23 & -0.168373 & -1.4087 & 0.081674 \tabularnewline
24 & -0.084087 & -0.7035 & 0.242031 \tabularnewline
25 & -0.245472 & -2.0538 & 0.021867 \tabularnewline
26 & -0.380242 & -3.1813 & 0.001093 \tabularnewline
27 & -0.226468 & -1.8948 & 0.031127 \tabularnewline
28 & -0.176802 & -1.4792 & 0.071782 \tabularnewline
29 & -0.15581 & -1.3036 & 0.098321 \tabularnewline
30 & -0.128008 & -1.071 & 0.143926 \tabularnewline
31 & -0.02677 & -0.224 & 0.411715 \tabularnewline
32 & -0.032446 & -0.2715 & 0.393417 \tabularnewline
33 & -0.09139 & -0.7646 & 0.223533 \tabularnewline
34 & -0.120473 & -1.0079 & 0.158476 \tabularnewline
35 & -0.047909 & -0.4008 & 0.344881 \tabularnewline
36 & 0.102612 & 0.8585 & 0.196771 \tabularnewline
37 & 0.011402 & 0.0954 & 0.462137 \tabularnewline
38 & -0.052436 & -0.4387 & 0.33111 \tabularnewline
39 & -0.004786 & -0.04 & 0.484088 \tabularnewline
40 & 0.072659 & 0.6079 & 0.272608 \tabularnewline
41 & 0.02754 & 0.2304 & 0.409221 \tabularnewline
42 & 0.077407 & 0.6476 & 0.25967 \tabularnewline
43 & 0.042256 & 0.3535 & 0.362374 \tabularnewline
44 & 0.033389 & 0.2794 & 0.390399 \tabularnewline
45 & 0.019385 & 0.1622 & 0.435813 \tabularnewline
46 & 0.057986 & 0.4851 & 0.314543 \tabularnewline
47 & 0.059181 & 0.4951 & 0.311026 \tabularnewline
48 & 0.083666 & 0.7 & 0.243124 \tabularnewline
\hline
\end{tabular}
%Source: https://freestatistics.org/blog/index.php?pk=116894&T=1

[TABLE]
[ROW][C]Autocorrelation Function[/C][/ROW]
[ROW][C]Time lag k[/C][C]ACF(k)[/C][C]T-STAT[/C][C]P-value[/C][/ROW]
[ROW][C]1[/C][C]0.410201[/C][C]3.432[/C][C]0.000505[/C][/ROW]
[ROW][C]2[/C][C]0.141378[/C][C]1.1829[/C][C]0.120435[/C][/ROW]
[ROW][C]3[/C][C]0.136778[/C][C]1.1444[/C][C]0.128186[/C][/ROW]
[ROW][C]4[/C][C]0.281423[/C][C]2.3546[/C][C]0.010677[/C][/ROW]
[ROW][C]5[/C][C]0.255593[/C][C]2.1384[/C][C]0.017986[/C][/ROW]
[ROW][C]6[/C][C]0.251164[/C][C]2.1014[/C][C]0.019604[/C][/ROW]
[ROW][C]7[/C][C]0.218665[/C][C]1.8295[/C][C]0.035793[/C][/ROW]
[ROW][C]8[/C][C]0.066796[/C][C]0.5589[/C][C]0.289023[/C][/ROW]
[ROW][C]9[/C][C]0.028735[/C][C]0.2404[/C][C]0.405357[/C][/ROW]
[ROW][C]10[/C][C]-0.049553[/C][C]-0.4146[/C][C]0.339855[/C][/ROW]
[ROW][C]11[/C][C]0.039841[/C][C]0.3333[/C][C]0.36994[/C][/ROW]
[ROW][C]12[/C][C]0.095927[/C][C]0.8026[/C][C]0.212467[/C][/ROW]
[ROW][C]13[/C][C]0.017476[/C][C]0.1462[/C][C]0.442085[/C][/ROW]
[ROW][C]14[/C][C]-0.104161[/C][C]-0.8715[/C][C]0.193238[/C][/ROW]
[ROW][C]15[/C][C]-0.143804[/C][C]-1.2031[/C][C]0.116486[/C][/ROW]
[ROW][C]16[/C][C]-0.132225[/C][C]-1.1063[/C][C]0.136197[/C][/ROW]
[ROW][C]17[/C][C]-0.05265[/C][C]-0.4405[/C][C]0.330466[/C][/ROW]
[ROW][C]18[/C][C]-0.040081[/C][C]-0.3353[/C][C]0.369185[/C][/ROW]
[ROW][C]19[/C][C]-0.163228[/C][C]-1.3657[/C][C]0.088208[/C][/ROW]
[ROW][C]20[/C][C]-0.231465[/C][C]-1.9366[/C][C]0.028417[/C][/ROW]
[ROW][C]21[/C][C]-0.25264[/C][C]-2.1137[/C][C]0.019051[/C][/ROW]
[ROW][C]22[/C][C]-0.270049[/C][C]-2.2594[/C][C]0.013487[/C][/ROW]
[ROW][C]23[/C][C]-0.168373[/C][C]-1.4087[/C][C]0.081674[/C][/ROW]
[ROW][C]24[/C][C]-0.084087[/C][C]-0.7035[/C][C]0.242031[/C][/ROW]
[ROW][C]25[/C][C]-0.245472[/C][C]-2.0538[/C][C]0.021867[/C][/ROW]
[ROW][C]26[/C][C]-0.380242[/C][C]-3.1813[/C][C]0.001093[/C][/ROW]
[ROW][C]27[/C][C]-0.226468[/C][C]-1.8948[/C][C]0.031127[/C][/ROW]
[ROW][C]28[/C][C]-0.176802[/C][C]-1.4792[/C][C]0.071782[/C][/ROW]
[ROW][C]29[/C][C]-0.15581[/C][C]-1.3036[/C][C]0.098321[/C][/ROW]
[ROW][C]30[/C][C]-0.128008[/C][C]-1.071[/C][C]0.143926[/C][/ROW]
[ROW][C]31[/C][C]-0.02677[/C][C]-0.224[/C][C]0.411715[/C][/ROW]
[ROW][C]32[/C][C]-0.032446[/C][C]-0.2715[/C][C]0.393417[/C][/ROW]
[ROW][C]33[/C][C]-0.09139[/C][C]-0.7646[/C][C]0.223533[/C][/ROW]
[ROW][C]34[/C][C]-0.120473[/C][C]-1.0079[/C][C]0.158476[/C][/ROW]
[ROW][C]35[/C][C]-0.047909[/C][C]-0.4008[/C][C]0.344881[/C][/ROW]
[ROW][C]36[/C][C]0.102612[/C][C]0.8585[/C][C]0.196771[/C][/ROW]
[ROW][C]37[/C][C]0.011402[/C][C]0.0954[/C][C]0.462137[/C][/ROW]
[ROW][C]38[/C][C]-0.052436[/C][C]-0.4387[/C][C]0.33111[/C][/ROW]
[ROW][C]39[/C][C]-0.004786[/C][C]-0.04[/C][C]0.484088[/C][/ROW]
[ROW][C]40[/C][C]0.072659[/C][C]0.6079[/C][C]0.272608[/C][/ROW]
[ROW][C]41[/C][C]0.02754[/C][C]0.2304[/C][C]0.409221[/C][/ROW]
[ROW][C]42[/C][C]0.077407[/C][C]0.6476[/C][C]0.25967[/C][/ROW]
[ROW][C]43[/C][C]0.042256[/C][C]0.3535[/C][C]0.362374[/C][/ROW]
[ROW][C]44[/C][C]0.033389[/C][C]0.2794[/C][C]0.390399[/C][/ROW]
[ROW][C]45[/C][C]0.019385[/C][C]0.1622[/C][C]0.435813[/C][/ROW]
[ROW][C]46[/C][C]0.057986[/C][C]0.4851[/C][C]0.314543[/C][/ROW]
[ROW][C]47[/C][C]0.059181[/C][C]0.4951[/C][C]0.311026[/C][/ROW]
[ROW][C]48[/C][C]0.083666[/C][C]0.7[/C][C]0.243124[/C][/ROW]
[/TABLE]
Source: https://freestatistics.org/blog/index.php?pk=116894&T=1

Globally Unique Identifier (entire table): ba.freestatistics.org/blog/index.php?pk=116894&T=1

As an alternative you can also use a QR Code:  

The GUIDs for individual cells are displayed in the table below:

Autocorrelation Function
Time lag kACF(k)T-STATP-value
10.4102013.4320.000505
20.1413781.18290.120435
30.1367781.14440.128186
40.2814232.35460.010677
50.2555932.13840.017986
60.2511642.10140.019604
70.2186651.82950.035793
80.0667960.55890.289023
90.0287350.24040.405357
10-0.049553-0.41460.339855
110.0398410.33330.36994
120.0959270.80260.212467
130.0174760.14620.442085
14-0.104161-0.87150.193238
15-0.143804-1.20310.116486
16-0.132225-1.10630.136197
17-0.05265-0.44050.330466
18-0.040081-0.33530.369185
19-0.163228-1.36570.088208
20-0.231465-1.93660.028417
21-0.25264-2.11370.019051
22-0.270049-2.25940.013487
23-0.168373-1.40870.081674
24-0.084087-0.70350.242031
25-0.245472-2.05380.021867
26-0.380242-3.18130.001093
27-0.226468-1.89480.031127
28-0.176802-1.47920.071782
29-0.15581-1.30360.098321
30-0.128008-1.0710.143926
31-0.02677-0.2240.411715
32-0.032446-0.27150.393417
33-0.09139-0.76460.223533
34-0.120473-1.00790.158476
35-0.047909-0.40080.344881
360.1026120.85850.196771
370.0114020.09540.462137
38-0.052436-0.43870.33111
39-0.004786-0.040.484088
400.0726590.60790.272608
410.027540.23040.409221
420.0774070.64760.25967
430.0422560.35350.362374
440.0333890.27940.390399
450.0193850.16220.435813
460.0579860.48510.314543
470.0591810.49510.311026
480.0836660.70.243124


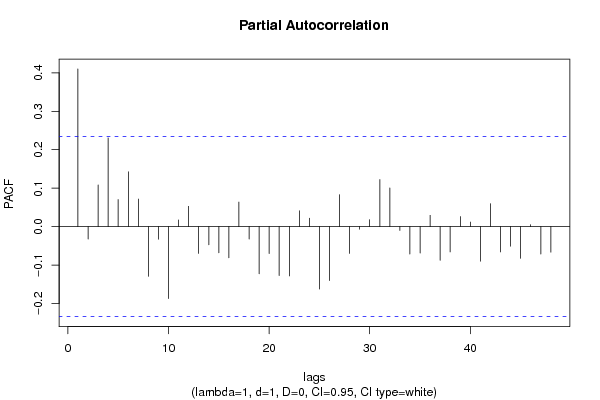
Partial Autocorrelation Function
Time lag kPACF(k)T-STATP-value
10.4102013.4320.000505
2-0.032327-0.27050.3938
30.1085250.9080.1835
40.2308831.93170.028723
50.0702510.58780.279293
60.1426271.19330.11839
70.0716310.59930.27545
8-0.129282-1.08170.141559
9-0.032886-0.27510.392009
10-0.18712-1.56560.060981
110.017380.14540.442402
120.0527270.44110.330234
13-0.069955-0.58530.280118
14-0.047403-0.39660.346433
15-0.068152-0.57020.285182
16-0.081106-0.67860.249821
170.0639930.53540.297035
18-0.032457-0.27160.393382
19-0.122757-1.02710.153965
20-0.070122-0.58670.279651
21-0.127279-1.06490.145293
22-0.128475-1.07490.143056
230.0409990.3430.366305
240.0220280.18430.427155
25-0.16245-1.35920.089231
26-0.140222-1.17320.12235
270.0831040.69530.244584
28-0.069718-0.58330.280783
29-0.006669-0.05580.47783
300.0179420.15010.440555
310.1223061.02330.154849
320.1005750.84150.201474
33-0.009905-0.08290.467095
34-0.071289-0.59650.276399
35-0.068831-0.57590.283272
360.0293570.24560.403348
37-0.087824-0.73480.232461
38-0.06577-0.55030.291942
390.0260280.21780.414121
400.0119990.10040.460162
41-0.089853-0.75180.227356
420.0597440.49990.309372
43-0.065972-0.5520.291368
44-0.050981-0.42650.335511
45-0.082334-0.68890.246595
460.0050510.04230.483205
47-0.071331-0.59680.276285
48-0.066447-0.55590.290014

\begin{tabular}{lllllllll}
\hline
Partial Autocorrelation Function \tabularnewline
Time lag k & PACF(k) & T-STAT & P-value \tabularnewline
1 & 0.410201 & 3.432 & 0.000505 \tabularnewline
2 & -0.032327 & -0.2705 & 0.3938 \tabularnewline
3 & 0.108525 & 0.908 & 0.1835 \tabularnewline
4 & 0.230883 & 1.9317 & 0.028723 \tabularnewline
5 & 0.070251 & 0.5878 & 0.279293 \tabularnewline
6 & 0.142627 & 1.1933 & 0.11839 \tabularnewline
7 & 0.071631 & 0.5993 & 0.27545 \tabularnewline
8 & -0.129282 & -1.0817 & 0.141559 \tabularnewline
9 & -0.032886 & -0.2751 & 0.392009 \tabularnewline
10 & -0.18712 & -1.5656 & 0.060981 \tabularnewline
11 & 0.01738 & 0.1454 & 0.442402 \tabularnewline
12 & 0.052727 & 0.4411 & 0.330234 \tabularnewline
13 & -0.069955 & -0.5853 & 0.280118 \tabularnewline
14 & -0.047403 & -0.3966 & 0.346433 \tabularnewline
15 & -0.068152 & -0.5702 & 0.285182 \tabularnewline
16 & -0.081106 & -0.6786 & 0.249821 \tabularnewline
17 & 0.063993 & 0.5354 & 0.297035 \tabularnewline
18 & -0.032457 & -0.2716 & 0.393382 \tabularnewline
19 & -0.122757 & -1.0271 & 0.153965 \tabularnewline
20 & -0.070122 & -0.5867 & 0.279651 \tabularnewline
21 & -0.127279 & -1.0649 & 0.145293 \tabularnewline
22 & -0.128475 & -1.0749 & 0.143056 \tabularnewline
23 & 0.040999 & 0.343 & 0.366305 \tabularnewline
24 & 0.022028 & 0.1843 & 0.427155 \tabularnewline
25 & -0.16245 & -1.3592 & 0.089231 \tabularnewline
26 & -0.140222 & -1.1732 & 0.12235 \tabularnewline
27 & 0.083104 & 0.6953 & 0.244584 \tabularnewline
28 & -0.069718 & -0.5833 & 0.280783 \tabularnewline
29 & -0.006669 & -0.0558 & 0.47783 \tabularnewline
30 & 0.017942 & 0.1501 & 0.440555 \tabularnewline
31 & 0.122306 & 1.0233 & 0.154849 \tabularnewline
32 & 0.100575 & 0.8415 & 0.201474 \tabularnewline
33 & -0.009905 & -0.0829 & 0.467095 \tabularnewline
34 & -0.071289 & -0.5965 & 0.276399 \tabularnewline
35 & -0.068831 & -0.5759 & 0.283272 \tabularnewline
36 & 0.029357 & 0.2456 & 0.403348 \tabularnewline
37 & -0.087824 & -0.7348 & 0.232461 \tabularnewline
38 & -0.06577 & -0.5503 & 0.291942 \tabularnewline
39 & 0.026028 & 0.2178 & 0.414121 \tabularnewline
40 & 0.011999 & 0.1004 & 0.460162 \tabularnewline
41 & -0.089853 & -0.7518 & 0.227356 \tabularnewline
42 & 0.059744 & 0.4999 & 0.309372 \tabularnewline
43 & -0.065972 & -0.552 & 0.291368 \tabularnewline
44 & -0.050981 & -0.4265 & 0.335511 \tabularnewline
45 & -0.082334 & -0.6889 & 0.246595 \tabularnewline
46 & 0.005051 & 0.0423 & 0.483205 \tabularnewline
47 & -0.071331 & -0.5968 & 0.276285 \tabularnewline
48 & -0.066447 & -0.5559 & 0.290014 \tabularnewline
\hline
\end{tabular}
%Source: https://freestatistics.org/blog/index.php?pk=116894&T=2

[TABLE]
[ROW][C]Partial Autocorrelation Function[/C][/ROW]
[ROW][C]Time lag k[/C][C]PACF(k)[/C][C]T-STAT[/C][C]P-value[/C][/ROW]
[ROW][C]1[/C][C]0.410201[/C][C]3.432[/C][C]0.000505[/C][/ROW]
[ROW][C]2[/C][C]-0.032327[/C][C]-0.2705[/C][C]0.3938[/C][/ROW]
[ROW][C]3[/C][C]0.108525[/C][C]0.908[/C][C]0.1835[/C][/ROW]
[ROW][C]4[/C][C]0.230883[/C][C]1.9317[/C][C]0.028723[/C][/ROW]
[ROW][C]5[/C][C]0.070251[/C][C]0.5878[/C][C]0.279293[/C][/ROW]
[ROW][C]6[/C][C]0.142627[/C][C]1.1933[/C][C]0.11839[/C][/ROW]
[ROW][C]7[/C][C]0.071631[/C][C]0.5993[/C][C]0.27545[/C][/ROW]
[ROW][C]8[/C][C]-0.129282[/C][C]-1.0817[/C][C]0.141559[/C][/ROW]
[ROW][C]9[/C][C]-0.032886[/C][C]-0.2751[/C][C]0.392009[/C][/ROW]
[ROW][C]10[/C][C]-0.18712[/C][C]-1.5656[/C][C]0.060981[/C][/ROW]
[ROW][C]11[/C][C]0.01738[/C][C]0.1454[/C][C]0.442402[/C][/ROW]
[ROW][C]12[/C][C]0.052727[/C][C]0.4411[/C][C]0.330234[/C][/ROW]
[ROW][C]13[/C][C]-0.069955[/C][C]-0.5853[/C][C]0.280118[/C][/ROW]
[ROW][C]14[/C][C]-0.047403[/C][C]-0.3966[/C][C]0.346433[/C][/ROW]
[ROW][C]15[/C][C]-0.068152[/C][C]-0.5702[/C][C]0.285182[/C][/ROW]
[ROW][C]16[/C][C]-0.081106[/C][C]-0.6786[/C][C]0.249821[/C][/ROW]
[ROW][C]17[/C][C]0.063993[/C][C]0.5354[/C][C]0.297035[/C][/ROW]
[ROW][C]18[/C][C]-0.032457[/C][C]-0.2716[/C][C]0.393382[/C][/ROW]
[ROW][C]19[/C][C]-0.122757[/C][C]-1.0271[/C][C]0.153965[/C][/ROW]
[ROW][C]20[/C][C]-0.070122[/C][C]-0.5867[/C][C]0.279651[/C][/ROW]
[ROW][C]21[/C][C]-0.127279[/C][C]-1.0649[/C][C]0.145293[/C][/ROW]
[ROW][C]22[/C][C]-0.128475[/C][C]-1.0749[/C][C]0.143056[/C][/ROW]
[ROW][C]23[/C][C]0.040999[/C][C]0.343[/C][C]0.366305[/C][/ROW]
[ROW][C]24[/C][C]0.022028[/C][C]0.1843[/C][C]0.427155[/C][/ROW]
[ROW][C]25[/C][C]-0.16245[/C][C]-1.3592[/C][C]0.089231[/C][/ROW]
[ROW][C]26[/C][C]-0.140222[/C][C]-1.1732[/C][C]0.12235[/C][/ROW]
[ROW][C]27[/C][C]0.083104[/C][C]0.6953[/C][C]0.244584[/C][/ROW]
[ROW][C]28[/C][C]-0.069718[/C][C]-0.5833[/C][C]0.280783[/C][/ROW]
[ROW][C]29[/C][C]-0.006669[/C][C]-0.0558[/C][C]0.47783[/C][/ROW]
[ROW][C]30[/C][C]0.017942[/C][C]0.1501[/C][C]0.440555[/C][/ROW]
[ROW][C]31[/C][C]0.122306[/C][C]1.0233[/C][C]0.154849[/C][/ROW]
[ROW][C]32[/C][C]0.100575[/C][C]0.8415[/C][C]0.201474[/C][/ROW]
[ROW][C]33[/C][C]-0.009905[/C][C]-0.0829[/C][C]0.467095[/C][/ROW]
[ROW][C]34[/C][C]-0.071289[/C][C]-0.5965[/C][C]0.276399[/C][/ROW]
[ROW][C]35[/C][C]-0.068831[/C][C]-0.5759[/C][C]0.283272[/C][/ROW]
[ROW][C]36[/C][C]0.029357[/C][C]0.2456[/C][C]0.403348[/C][/ROW]
[ROW][C]37[/C][C]-0.087824[/C][C]-0.7348[/C][C]0.232461[/C][/ROW]
[ROW][C]38[/C][C]-0.06577[/C][C]-0.5503[/C][C]0.291942[/C][/ROW]
[ROW][C]39[/C][C]0.026028[/C][C]0.2178[/C][C]0.414121[/C][/ROW]
[ROW][C]40[/C][C]0.011999[/C][C]0.1004[/C][C]0.460162[/C][/ROW]
[ROW][C]41[/C][C]-0.089853[/C][C]-0.7518[/C][C]0.227356[/C][/ROW]
[ROW][C]42[/C][C]0.059744[/C][C]0.4999[/C][C]0.309372[/C][/ROW]
[ROW][C]43[/C][C]-0.065972[/C][C]-0.552[/C][C]0.291368[/C][/ROW]
[ROW][C]44[/C][C]-0.050981[/C][C]-0.4265[/C][C]0.335511[/C][/ROW]
[ROW][C]45[/C][C]-0.082334[/C][C]-0.6889[/C][C]0.246595[/C][/ROW]
[ROW][C]46[/C][C]0.005051[/C][C]0.0423[/C][C]0.483205[/C][/ROW]
[ROW][C]47[/C][C]-0.071331[/C][C]-0.5968[/C][C]0.276285[/C][/ROW]
[ROW][C]48[/C][C]-0.066447[/C][C]-0.5559[/C][C]0.290014[/C][/ROW]
[/TABLE]
Source: https://freestatistics.org/blog/index.php?pk=116894&T=2

Globally Unique Identifier (entire table): ba.freestatistics.org/blog/index.php?pk=116894&T=2

As an alternative you can also use a QR Code:  

The GUIDs for individual cells are displayed in the table below:

Partial Autocorrelation Function
Time lag kPACF(k)T-STATP-value
10.4102013.4320.000505
2-0.032327-0.27050.3938
30.1085250.9080.1835
40.2308831.93170.028723
50.0702510.58780.279293
60.1426271.19330.11839
70.0716310.59930.27545
8-0.129282-1.08170.141559
9-0.032886-0.27510.392009
10-0.18712-1.56560.060981
110.017380.14540.442402
120.0527270.44110.330234
13-0.069955-0.58530.280118
14-0.047403-0.39660.346433
15-0.068152-0.57020.285182
16-0.081106-0.67860.249821
170.0639930.53540.297035
18-0.032457-0.27160.393382
19-0.122757-1.02710.153965
20-0.070122-0.58670.279651
21-0.127279-1.06490.145293
22-0.128475-1.07490.143056
230.0409990.3430.366305
240.0220280.18430.427155
25-0.16245-1.35920.089231
26-0.140222-1.17320.12235
270.0831040.69530.244584
28-0.069718-0.58330.280783
29-0.006669-0.05580.47783
300.0179420.15010.440555
310.1223061.02330.154849
320.1005750.84150.201474
33-0.009905-0.08290.467095
34-0.071289-0.59650.276399
35-0.068831-0.57590.283272
360.0293570.24560.403348
37-0.087824-0.73480.232461
38-0.06577-0.55030.291942
390.0260280.21780.414121
400.0119990.10040.460162
41-0.089853-0.75180.227356
420.0597440.49990.309372
43-0.065972-0.5520.291368
44-0.050981-0.42650.335511
45-0.082334-0.68890.246595
460.0050510.04230.483205
47-0.071331-0.59680.276285
48-0.066447-0.55590.290014


Parameters (Session):
par1 = 1 ; par2 = 1 ; par3 = 0 ; par4 = 12 ;
Parameters (R input):
par1 = 48 ; par2 = 1 ; par3 = 1 ; par4 = 0 ; par5 = 12 ; par6 = White Noise ; par7 = 0.95 ; par8 = ;
R code (references can be found in the software module):
if (par1 == 'Default') {
par1 = 10*log10(length(x))
} else {
par1 <- as.numeric(par1)
}
par2 <- as.numeric(par2)
par3 <- as.numeric(par3)
par4 <- as.numeric(par4)
par5 <- as.numeric(par5)
if (par6 == 'White Noise') par6 <- 'white' else par6 <- 'ma'
par7 <- as.numeric(par7)
if (par8 != '') par8 <- as.numeric(par8)
ox <- x
if (par8 == '') {
if (par2 == 0) {
x <- log(x)
} else {
x <- (x ^ par2 - 1) / par2
}
} else {
x <- log(x,base=par8)
}
if (par3 > 0) x <- diff(x,lag=1,difference=par3)
if (par4 > 0) x <- diff(x,lag=par5,difference=par4)
bitmap(file='picts.png')
op <- par(mfrow=c(2,1))
plot(ox,type='l',main='Original Time Series',xlab='time',ylab='value')
if (par8=='') {
mytitle <- paste('Working Time Series (lambda=',par2,', d=',par3,', D=',par4,')',sep='')
mysub <- paste('(lambda=',par2,', d=',par3,', D=',par4,', CI=', par7, ', CI type=',par6,')',sep='')
} else {
mytitle <- paste('Working Time Series (base=',par8,', d=',par3,', D=',par4,')',sep='')
mysub <- paste('(base=',par8,', d=',par3,', D=',par4,', CI=', par7, ', CI type=',par6,')',sep='')
}
plot(x,type='l', main=mytitle,xlab='time',ylab='value')
par(op)
dev.off()
bitmap(file='pic1.png')
racf <- acf(x, par1, main='Autocorrelation', xlab='time lag', ylab='ACF', ci.type=par6, ci=par7, sub=mysub)
dev.off()
bitmap(file='pic2.png')
rpacf <- pacf(x,par1,main='Partial Autocorrelation',xlab='lags',ylab='PACF',sub=mysub)
dev.off()
(myacf <- c(racf$acf))
(mypacf <- c(rpacf$acf))
lengthx <- length(x)
sqrtn <- sqrt(lengthx)
load(file='createtable')
a<-table.start()
a<-table.row.start(a)
a<-table.element(a,'Autocorrelation Function',4,TRUE)
a<-table.row.end(a)
a<-table.row.start(a)
a<-table.element(a,'Time lag k',header=TRUE)
a<-table.element(a,hyperlink('basics.htm','ACF(k)','click here for more information about the Autocorrelation Function'),header=TRUE)
a<-table.element(a,'T-STAT',header=TRUE)
a<-table.element(a,'P-value',header=TRUE)
a<-table.row.end(a)
for (i in 2:(par1+1)) {
a<-table.row.start(a)
a<-table.element(a,i-1,header=TRUE)
a<-table.element(a,round(myacf[i],6))
mytstat <- myacf[i]*sqrtn
a<-table.element(a,round(mytstat,4))
a<-table.element(a,round(1-pt(abs(mytstat),lengthx),6))
a<-table.row.end(a)
}
a<-table.end(a)
table.save(a,file='mytable.tab')
a<-table.start()
a<-table.row.start(a)
a<-table.element(a,'Partial Autocorrelation Function',4,TRUE)
a<-table.row.end(a)
a<-table.row.start(a)
a<-table.element(a,'Time lag k',header=TRUE)
a<-table.element(a,hyperlink('basics.htm','PACF(k)','click here for more information about the Partial Autocorrelation Function'),header=TRUE)
a<-table.element(a,'T-STAT',header=TRUE)
a<-table.element(a,'P-value',header=TRUE)
a<-table.row.end(a)
for (i in 1:par1) {
a<-table.row.start(a)
a<-table.element(a,i,header=TRUE)
a<-table.element(a,round(mypacf[i],6))
mytstat <- mypacf[i]*sqrtn
a<-table.element(a,round(mytstat,4))
a<-table.element(a,round(1-pt(abs(mytstat),lengthx),6))
a<-table.row.end(a)
}
a<-table.end(a)
table.save(a,file='mytable1.tab')