| Tabulation of Results | |||
| gender x class | |||
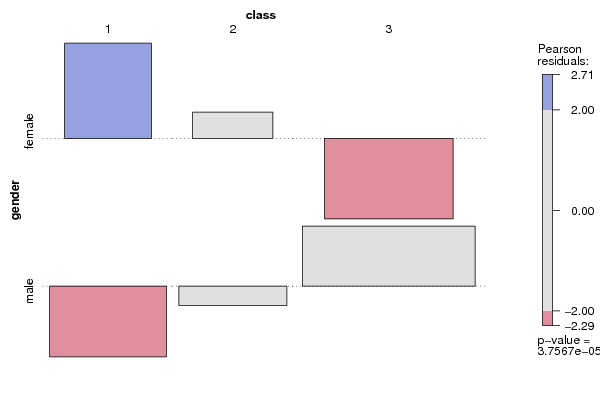
| 1 | 2 | 3 | female | 144 | 106 | 216 | male | 179 | 171 | 493 |
| Tabulation of Expected Results | |||
| gender x class | |||
| 1 | 2 | 3 | female | 114.99 | 98.61 | 252.4 | male | 208.01 | 178.39 | 456.6 |
| Statistical Results | |
| Pearson's Chi-squared test with simulated p-value (based on 2000 replicates) | |
| Exact Pearson Chi Square Statistic | 20.38 |
| P value | 0 |