Free Statistics

of Irreproducible Research!

Author's title

Author*Unverified author*
R Software Modulerwasp_autocorrelation.wasp
Title produced by software(Partial) Autocorrelation Function
Date of computationWed, 29 Dec 2010 13:55:52 +0000
Cite this page as followsStatistical Computations at FreeStatistics.org, Office for Research Development and Education, URL https://freestatistics.org/blog/index.php?v=date/2010/Dec/29/t1293630826vml48eaa0aima5x.htm/, Retrieved Fri, 03 May 2024 14:52:19 +0000
Statistical Computations at FreeStatistics.org, Office for Research Development and Education, URL https://freestatistics.org/blog/index.php?pk=116844, Retrieved Fri, 03 May 2024 14:52:19 +0000
QR Codes:

Original text written by user:
IsPrivate?No (this computation is public)
User-defined keywords
Estimated Impact40
Family? (F = Feedback message, R = changed R code, M = changed R Module, P = changed Parameters, D = changed Data)
-       [(Partial) Autocorrelation Function] [Paper] [2010-12-29 13:55:52] [d5e0edb7e0239841e94676417b2a1e2e] [Current]
Feedback Forum

Post a new message
Dataseries X:
26548
26752
26967
27034
27056
27476
28497
29085
28720
29067
29249
29672
29761
30066
30315
30571
30757
30742
31310
31381
31470
31226
31081
31061
31114
30828
30418
30195
29877
29192
29876
29409
28458
28340
28164
28438
28053
27599
27226
27119
26625
26541
27023
26631
26154
26029
26008
26632
27010
27041
27244
26976
26715
27017
27714
27655
27103
27088
26968
27770
27616
27481
27279
26918
26503
26547
27467
27305
26259
26048
25743


Summary of computational transaction
Raw Inputview raw input (R code)
Raw Outputview raw output of R engine
Computing time3 seconds
R Server'RServer@AstonUniversity' @ vre.aston.ac.uk

\begin{tabular}{lllllllll}
\hline
Summary of computational transaction \tabularnewline
Raw Input & view raw input (R code)  \tabularnewline
Raw Output & view raw output of R engine  \tabularnewline
Computing time & 3 seconds \tabularnewline
R Server & 'RServer@AstonUniversity' @ vre.aston.ac.uk \tabularnewline
\hline
\end{tabular}
%Source: https://freestatistics.org/blog/index.php?pk=116844&T=0

[TABLE]
[ROW][C]Summary of computational transaction[/C][/ROW]
[ROW][C]Raw Input[/C][C]view raw input (R code) [/C][/ROW]
[ROW][C]Raw Output[/C][C]view raw output of R engine [/C][/ROW]
[ROW][C]Computing time[/C][C]3 seconds[/C][/ROW]
[ROW][C]R Server[/C][C]'RServer@AstonUniversity' @ vre.aston.ac.uk[/C][/ROW]
[/TABLE]
Source: https://freestatistics.org/blog/index.php?pk=116844&T=0

Globally Unique Identifier (entire table): ba.freestatistics.org/blog/index.php?pk=116844&T=0

As an alternative you can also use a QR Code:  

The GUIDs for individual cells are displayed in the table below:

Summary of computational transaction
Raw Inputview raw input (R code)
Raw Outputview raw output of R engine
Computing time3 seconds
R Server'RServer@AstonUniversity' @ vre.aston.ac.uk


Autocorrelation Function
Time lag kACF(k)T-STATP-value
10.3086092.35030.011091
20.337762.57230.006343
30.3084872.34940.011116
40.406983.09950.001495
50.3094362.35660.010921
60.2888692.20.015904
70.1924371.46560.074085
80.1496111.13940.12961
90.1281480.97590.166572
100.0513270.39090.348653
110.1089930.83010.204953
12-0.281541-2.14420.018112
13-0.067366-0.5130.304935
14-0.04618-0.35170.36317
15-0.102087-0.77750.220021
16-0.347985-2.65020.005176
17-0.220086-1.67610.049548
18-0.237163-1.80620.03804
19-0.207836-1.58280.059449
20-0.222141-1.69180.048028
21-0.320811-2.44320.008811
22-0.273493-2.08290.020842
23-0.283558-2.15950.017479
24-0.185803-1.4150.081203
25-0.181664-1.38350.085906
26-0.168866-1.2860.101769
27-0.276343-2.10460.019836
28-0.042574-0.32420.373465
29-0.109349-0.83280.204193
30-0.099079-0.75460.226782
31-0.078107-0.59480.277129
32-0.019294-0.14690.441845
330.0686650.52290.301506
340.0161860.12330.45116
350.0413320.31480.377031
360.0490.37320.355191
370.0796260.60640.273304
380.0083140.06330.474866
390.1296660.98750.163749
400.0124910.09510.462271
410.0679110.51720.303494
420.064620.49210.312242
430.0883980.67320.251741
440.0306040.23310.408263
45000.499999
460.0401990.30610.380296
470.0065430.04980.480216
48-0.030321-0.23090.409095

\begin{tabular}{lllllllll}
\hline
Autocorrelation Function \tabularnewline
Time lag k & ACF(k) & T-STAT & P-value \tabularnewline
1 & 0.308609 & 2.3503 & 0.011091 \tabularnewline
2 & 0.33776 & 2.5723 & 0.006343 \tabularnewline
3 & 0.308487 & 2.3494 & 0.011116 \tabularnewline
4 & 0.40698 & 3.0995 & 0.001495 \tabularnewline
5 & 0.309436 & 2.3566 & 0.010921 \tabularnewline
6 & 0.288869 & 2.2 & 0.015904 \tabularnewline
7 & 0.192437 & 1.4656 & 0.074085 \tabularnewline
8 & 0.149611 & 1.1394 & 0.12961 \tabularnewline
9 & 0.128148 & 0.9759 & 0.166572 \tabularnewline
10 & 0.051327 & 0.3909 & 0.348653 \tabularnewline
11 & 0.108993 & 0.8301 & 0.204953 \tabularnewline
12 & -0.281541 & -2.1442 & 0.018112 \tabularnewline
13 & -0.067366 & -0.513 & 0.304935 \tabularnewline
14 & -0.04618 & -0.3517 & 0.36317 \tabularnewline
15 & -0.102087 & -0.7775 & 0.220021 \tabularnewline
16 & -0.347985 & -2.6502 & 0.005176 \tabularnewline
17 & -0.220086 & -1.6761 & 0.049548 \tabularnewline
18 & -0.237163 & -1.8062 & 0.03804 \tabularnewline
19 & -0.207836 & -1.5828 & 0.059449 \tabularnewline
20 & -0.222141 & -1.6918 & 0.048028 \tabularnewline
21 & -0.320811 & -2.4432 & 0.008811 \tabularnewline
22 & -0.273493 & -2.0829 & 0.020842 \tabularnewline
23 & -0.283558 & -2.1595 & 0.017479 \tabularnewline
24 & -0.185803 & -1.415 & 0.081203 \tabularnewline
25 & -0.181664 & -1.3835 & 0.085906 \tabularnewline
26 & -0.168866 & -1.286 & 0.101769 \tabularnewline
27 & -0.276343 & -2.1046 & 0.019836 \tabularnewline
28 & -0.042574 & -0.3242 & 0.373465 \tabularnewline
29 & -0.109349 & -0.8328 & 0.204193 \tabularnewline
30 & -0.099079 & -0.7546 & 0.226782 \tabularnewline
31 & -0.078107 & -0.5948 & 0.277129 \tabularnewline
32 & -0.019294 & -0.1469 & 0.441845 \tabularnewline
33 & 0.068665 & 0.5229 & 0.301506 \tabularnewline
34 & 0.016186 & 0.1233 & 0.45116 \tabularnewline
35 & 0.041332 & 0.3148 & 0.377031 \tabularnewline
36 & 0.049 & 0.3732 & 0.355191 \tabularnewline
37 & 0.079626 & 0.6064 & 0.273304 \tabularnewline
38 & 0.008314 & 0.0633 & 0.474866 \tabularnewline
39 & 0.129666 & 0.9875 & 0.163749 \tabularnewline
40 & 0.012491 & 0.0951 & 0.462271 \tabularnewline
41 & 0.067911 & 0.5172 & 0.303494 \tabularnewline
42 & 0.06462 & 0.4921 & 0.312242 \tabularnewline
43 & 0.088398 & 0.6732 & 0.251741 \tabularnewline
44 & 0.030604 & 0.2331 & 0.408263 \tabularnewline
45 & 0 & 0 & 0.499999 \tabularnewline
46 & 0.040199 & 0.3061 & 0.380296 \tabularnewline
47 & 0.006543 & 0.0498 & 0.480216 \tabularnewline
48 & -0.030321 & -0.2309 & 0.409095 \tabularnewline
\hline
\end{tabular}
%Source: https://freestatistics.org/blog/index.php?pk=116844&T=1

[TABLE]
[ROW][C]Autocorrelation Function[/C][/ROW]
[ROW][C]Time lag k[/C][C]ACF(k)[/C][C]T-STAT[/C][C]P-value[/C][/ROW]
[ROW][C]1[/C][C]0.308609[/C][C]2.3503[/C][C]0.011091[/C][/ROW]
[ROW][C]2[/C][C]0.33776[/C][C]2.5723[/C][C]0.006343[/C][/ROW]
[ROW][C]3[/C][C]0.308487[/C][C]2.3494[/C][C]0.011116[/C][/ROW]
[ROW][C]4[/C][C]0.40698[/C][C]3.0995[/C][C]0.001495[/C][/ROW]
[ROW][C]5[/C][C]0.309436[/C][C]2.3566[/C][C]0.010921[/C][/ROW]
[ROW][C]6[/C][C]0.288869[/C][C]2.2[/C][C]0.015904[/C][/ROW]
[ROW][C]7[/C][C]0.192437[/C][C]1.4656[/C][C]0.074085[/C][/ROW]
[ROW][C]8[/C][C]0.149611[/C][C]1.1394[/C][C]0.12961[/C][/ROW]
[ROW][C]9[/C][C]0.128148[/C][C]0.9759[/C][C]0.166572[/C][/ROW]
[ROW][C]10[/C][C]0.051327[/C][C]0.3909[/C][C]0.348653[/C][/ROW]
[ROW][C]11[/C][C]0.108993[/C][C]0.8301[/C][C]0.204953[/C][/ROW]
[ROW][C]12[/C][C]-0.281541[/C][C]-2.1442[/C][C]0.018112[/C][/ROW]
[ROW][C]13[/C][C]-0.067366[/C][C]-0.513[/C][C]0.304935[/C][/ROW]
[ROW][C]14[/C][C]-0.04618[/C][C]-0.3517[/C][C]0.36317[/C][/ROW]
[ROW][C]15[/C][C]-0.102087[/C][C]-0.7775[/C][C]0.220021[/C][/ROW]
[ROW][C]16[/C][C]-0.347985[/C][C]-2.6502[/C][C]0.005176[/C][/ROW]
[ROW][C]17[/C][C]-0.220086[/C][C]-1.6761[/C][C]0.049548[/C][/ROW]
[ROW][C]18[/C][C]-0.237163[/C][C]-1.8062[/C][C]0.03804[/C][/ROW]
[ROW][C]19[/C][C]-0.207836[/C][C]-1.5828[/C][C]0.059449[/C][/ROW]
[ROW][C]20[/C][C]-0.222141[/C][C]-1.6918[/C][C]0.048028[/C][/ROW]
[ROW][C]21[/C][C]-0.320811[/C][C]-2.4432[/C][C]0.008811[/C][/ROW]
[ROW][C]22[/C][C]-0.273493[/C][C]-2.0829[/C][C]0.020842[/C][/ROW]
[ROW][C]23[/C][C]-0.283558[/C][C]-2.1595[/C][C]0.017479[/C][/ROW]
[ROW][C]24[/C][C]-0.185803[/C][C]-1.415[/C][C]0.081203[/C][/ROW]
[ROW][C]25[/C][C]-0.181664[/C][C]-1.3835[/C][C]0.085906[/C][/ROW]
[ROW][C]26[/C][C]-0.168866[/C][C]-1.286[/C][C]0.101769[/C][/ROW]
[ROW][C]27[/C][C]-0.276343[/C][C]-2.1046[/C][C]0.019836[/C][/ROW]
[ROW][C]28[/C][C]-0.042574[/C][C]-0.3242[/C][C]0.373465[/C][/ROW]
[ROW][C]29[/C][C]-0.109349[/C][C]-0.8328[/C][C]0.204193[/C][/ROW]
[ROW][C]30[/C][C]-0.099079[/C][C]-0.7546[/C][C]0.226782[/C][/ROW]
[ROW][C]31[/C][C]-0.078107[/C][C]-0.5948[/C][C]0.277129[/C][/ROW]
[ROW][C]32[/C][C]-0.019294[/C][C]-0.1469[/C][C]0.441845[/C][/ROW]
[ROW][C]33[/C][C]0.068665[/C][C]0.5229[/C][C]0.301506[/C][/ROW]
[ROW][C]34[/C][C]0.016186[/C][C]0.1233[/C][C]0.45116[/C][/ROW]
[ROW][C]35[/C][C]0.041332[/C][C]0.3148[/C][C]0.377031[/C][/ROW]
[ROW][C]36[/C][C]0.049[/C][C]0.3732[/C][C]0.355191[/C][/ROW]
[ROW][C]37[/C][C]0.079626[/C][C]0.6064[/C][C]0.273304[/C][/ROW]
[ROW][C]38[/C][C]0.008314[/C][C]0.0633[/C][C]0.474866[/C][/ROW]
[ROW][C]39[/C][C]0.129666[/C][C]0.9875[/C][C]0.163749[/C][/ROW]
[ROW][C]40[/C][C]0.012491[/C][C]0.0951[/C][C]0.462271[/C][/ROW]
[ROW][C]41[/C][C]0.067911[/C][C]0.5172[/C][C]0.303494[/C][/ROW]
[ROW][C]42[/C][C]0.06462[/C][C]0.4921[/C][C]0.312242[/C][/ROW]
[ROW][C]43[/C][C]0.088398[/C][C]0.6732[/C][C]0.251741[/C][/ROW]
[ROW][C]44[/C][C]0.030604[/C][C]0.2331[/C][C]0.408263[/C][/ROW]
[ROW][C]45[/C][C]0[/C][C]0[/C][C]0.499999[/C][/ROW]
[ROW][C]46[/C][C]0.040199[/C][C]0.3061[/C][C]0.380296[/C][/ROW]
[ROW][C]47[/C][C]0.006543[/C][C]0.0498[/C][C]0.480216[/C][/ROW]
[ROW][C]48[/C][C]-0.030321[/C][C]-0.2309[/C][C]0.409095[/C][/ROW]
[/TABLE]
Source: https://freestatistics.org/blog/index.php?pk=116844&T=1

Globally Unique Identifier (entire table): ba.freestatistics.org/blog/index.php?pk=116844&T=1

As an alternative you can also use a QR Code:  

The GUIDs for individual cells are displayed in the table below:

Autocorrelation Function
Time lag kACF(k)T-STATP-value
10.3086092.35030.011091
20.337762.57230.006343
30.3084872.34940.011116
40.406983.09950.001495
50.3094362.35660.010921
60.2888692.20.015904
70.1924371.46560.074085
80.1496111.13940.12961
90.1281480.97590.166572
100.0513270.39090.348653
110.1089930.83010.204953
12-0.281541-2.14420.018112
13-0.067366-0.5130.304935
14-0.04618-0.35170.36317
15-0.102087-0.77750.220021
16-0.347985-2.65020.005176
17-0.220086-1.67610.049548
18-0.237163-1.80620.03804
19-0.207836-1.58280.059449
20-0.222141-1.69180.048028
21-0.320811-2.44320.008811
22-0.273493-2.08290.020842
23-0.283558-2.15950.017479
24-0.185803-1.4150.081203
25-0.181664-1.38350.085906
26-0.168866-1.2860.101769
27-0.276343-2.10460.019836
28-0.042574-0.32420.373465
29-0.109349-0.83280.204193
30-0.099079-0.75460.226782
31-0.078107-0.59480.277129
32-0.019294-0.14690.441845
330.0686650.52290.301506
340.0161860.12330.45116
350.0413320.31480.377031
360.0490.37320.355191
370.0796260.60640.273304
380.0083140.06330.474866
390.1296660.98750.163749
400.0124910.09510.462271
410.0679110.51720.303494
420.064620.49210.312242
430.0883980.67320.251741
440.0306040.23310.408263
45000.499999
460.0401990.30610.380296
470.0065430.04980.480216
48-0.030321-0.23090.409095


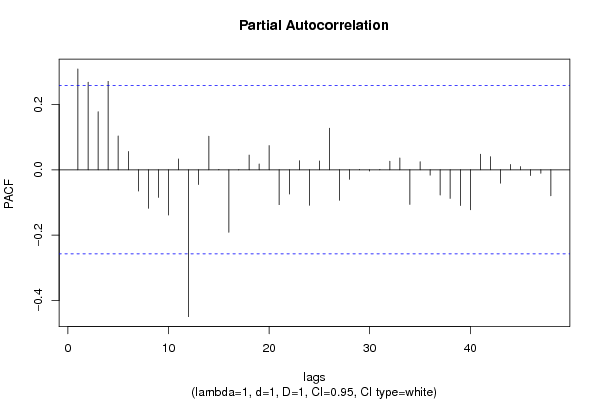
Partial Autocorrelation Function
Time lag kPACF(k)T-STATP-value
10.3086092.35030.011091
20.268052.04140.022884
30.1779921.35550.090249
40.2707112.06170.021865
50.1033790.78730.217154
60.0558130.42510.336183
7-0.065125-0.4960.310891
8-0.117786-0.8970.186706
9-0.084534-0.64380.261123
10-0.138225-1.05270.148424
110.03340.25440.400056
12-0.449385-3.42240.000572
13-0.044832-0.34140.367006
140.1026680.78190.218729
150.0012640.00960.496175
16-0.191384-1.45750.075181
17-0.000453-0.00340.49863
180.0449020.3420.366807
190.0179120.13640.445982
200.0741350.56460.287264
21-0.106726-0.81280.209829
22-0.073898-0.56280.287874
230.0277150.21110.416785
24-0.108471-0.82610.206069
250.027090.20630.418634
260.1269660.96690.168792
27-0.093371-0.71110.239939
28-0.029159-0.22210.412522
290.0012810.00980.496126
30-0.003982-0.03030.487956
310.000770.00590.49767
320.0261020.19880.421563
330.0361130.2750.392137
34-0.105984-0.80710.21144
350.0244780.18640.426384
36-0.016425-0.12510.450443
37-0.076936-0.58590.2801
38-0.087582-0.6670.253708
39-0.109444-0.83350.20399
40-0.122523-0.93310.177316
410.0477330.36350.358768
420.0402350.30640.380191
43-0.040859-0.31120.378393
440.0162550.12380.450954
450.0097390.07420.470567
46-0.017492-0.13320.447241
47-0.010615-0.08080.467924
48-0.079579-0.60610.273421

\begin{tabular}{lllllllll}
\hline
Partial Autocorrelation Function \tabularnewline
Time lag k & PACF(k) & T-STAT & P-value \tabularnewline
1 & 0.308609 & 2.3503 & 0.011091 \tabularnewline
2 & 0.26805 & 2.0414 & 0.022884 \tabularnewline
3 & 0.177992 & 1.3555 & 0.090249 \tabularnewline
4 & 0.270711 & 2.0617 & 0.021865 \tabularnewline
5 & 0.103379 & 0.7873 & 0.217154 \tabularnewline
6 & 0.055813 & 0.4251 & 0.336183 \tabularnewline
7 & -0.065125 & -0.496 & 0.310891 \tabularnewline
8 & -0.117786 & -0.897 & 0.186706 \tabularnewline
9 & -0.084534 & -0.6438 & 0.261123 \tabularnewline
10 & -0.138225 & -1.0527 & 0.148424 \tabularnewline
11 & 0.0334 & 0.2544 & 0.400056 \tabularnewline
12 & -0.449385 & -3.4224 & 0.000572 \tabularnewline
13 & -0.044832 & -0.3414 & 0.367006 \tabularnewline
14 & 0.102668 & 0.7819 & 0.218729 \tabularnewline
15 & 0.001264 & 0.0096 & 0.496175 \tabularnewline
16 & -0.191384 & -1.4575 & 0.075181 \tabularnewline
17 & -0.000453 & -0.0034 & 0.49863 \tabularnewline
18 & 0.044902 & 0.342 & 0.366807 \tabularnewline
19 & 0.017912 & 0.1364 & 0.445982 \tabularnewline
20 & 0.074135 & 0.5646 & 0.287264 \tabularnewline
21 & -0.106726 & -0.8128 & 0.209829 \tabularnewline
22 & -0.073898 & -0.5628 & 0.287874 \tabularnewline
23 & 0.027715 & 0.2111 & 0.416785 \tabularnewline
24 & -0.108471 & -0.8261 & 0.206069 \tabularnewline
25 & 0.02709 & 0.2063 & 0.418634 \tabularnewline
26 & 0.126966 & 0.9669 & 0.168792 \tabularnewline
27 & -0.093371 & -0.7111 & 0.239939 \tabularnewline
28 & -0.029159 & -0.2221 & 0.412522 \tabularnewline
29 & 0.001281 & 0.0098 & 0.496126 \tabularnewline
30 & -0.003982 & -0.0303 & 0.487956 \tabularnewline
31 & 0.00077 & 0.0059 & 0.49767 \tabularnewline
32 & 0.026102 & 0.1988 & 0.421563 \tabularnewline
33 & 0.036113 & 0.275 & 0.392137 \tabularnewline
34 & -0.105984 & -0.8071 & 0.21144 \tabularnewline
35 & 0.024478 & 0.1864 & 0.426384 \tabularnewline
36 & -0.016425 & -0.1251 & 0.450443 \tabularnewline
37 & -0.076936 & -0.5859 & 0.2801 \tabularnewline
38 & -0.087582 & -0.667 & 0.253708 \tabularnewline
39 & -0.109444 & -0.8335 & 0.20399 \tabularnewline
40 & -0.122523 & -0.9331 & 0.177316 \tabularnewline
41 & 0.047733 & 0.3635 & 0.358768 \tabularnewline
42 & 0.040235 & 0.3064 & 0.380191 \tabularnewline
43 & -0.040859 & -0.3112 & 0.378393 \tabularnewline
44 & 0.016255 & 0.1238 & 0.450954 \tabularnewline
45 & 0.009739 & 0.0742 & 0.470567 \tabularnewline
46 & -0.017492 & -0.1332 & 0.447241 \tabularnewline
47 & -0.010615 & -0.0808 & 0.467924 \tabularnewline
48 & -0.079579 & -0.6061 & 0.273421 \tabularnewline
\hline
\end{tabular}
%Source: https://freestatistics.org/blog/index.php?pk=116844&T=2

[TABLE]
[ROW][C]Partial Autocorrelation Function[/C][/ROW]
[ROW][C]Time lag k[/C][C]PACF(k)[/C][C]T-STAT[/C][C]P-value[/C][/ROW]
[ROW][C]1[/C][C]0.308609[/C][C]2.3503[/C][C]0.011091[/C][/ROW]
[ROW][C]2[/C][C]0.26805[/C][C]2.0414[/C][C]0.022884[/C][/ROW]
[ROW][C]3[/C][C]0.177992[/C][C]1.3555[/C][C]0.090249[/C][/ROW]
[ROW][C]4[/C][C]0.270711[/C][C]2.0617[/C][C]0.021865[/C][/ROW]
[ROW][C]5[/C][C]0.103379[/C][C]0.7873[/C][C]0.217154[/C][/ROW]
[ROW][C]6[/C][C]0.055813[/C][C]0.4251[/C][C]0.336183[/C][/ROW]
[ROW][C]7[/C][C]-0.065125[/C][C]-0.496[/C][C]0.310891[/C][/ROW]
[ROW][C]8[/C][C]-0.117786[/C][C]-0.897[/C][C]0.186706[/C][/ROW]
[ROW][C]9[/C][C]-0.084534[/C][C]-0.6438[/C][C]0.261123[/C][/ROW]
[ROW][C]10[/C][C]-0.138225[/C][C]-1.0527[/C][C]0.148424[/C][/ROW]
[ROW][C]11[/C][C]0.0334[/C][C]0.2544[/C][C]0.400056[/C][/ROW]
[ROW][C]12[/C][C]-0.449385[/C][C]-3.4224[/C][C]0.000572[/C][/ROW]
[ROW][C]13[/C][C]-0.044832[/C][C]-0.3414[/C][C]0.367006[/C][/ROW]
[ROW][C]14[/C][C]0.102668[/C][C]0.7819[/C][C]0.218729[/C][/ROW]
[ROW][C]15[/C][C]0.001264[/C][C]0.0096[/C][C]0.496175[/C][/ROW]
[ROW][C]16[/C][C]-0.191384[/C][C]-1.4575[/C][C]0.075181[/C][/ROW]
[ROW][C]17[/C][C]-0.000453[/C][C]-0.0034[/C][C]0.49863[/C][/ROW]
[ROW][C]18[/C][C]0.044902[/C][C]0.342[/C][C]0.366807[/C][/ROW]
[ROW][C]19[/C][C]0.017912[/C][C]0.1364[/C][C]0.445982[/C][/ROW]
[ROW][C]20[/C][C]0.074135[/C][C]0.5646[/C][C]0.287264[/C][/ROW]
[ROW][C]21[/C][C]-0.106726[/C][C]-0.8128[/C][C]0.209829[/C][/ROW]
[ROW][C]22[/C][C]-0.073898[/C][C]-0.5628[/C][C]0.287874[/C][/ROW]
[ROW][C]23[/C][C]0.027715[/C][C]0.2111[/C][C]0.416785[/C][/ROW]
[ROW][C]24[/C][C]-0.108471[/C][C]-0.8261[/C][C]0.206069[/C][/ROW]
[ROW][C]25[/C][C]0.02709[/C][C]0.2063[/C][C]0.418634[/C][/ROW]
[ROW][C]26[/C][C]0.126966[/C][C]0.9669[/C][C]0.168792[/C][/ROW]
[ROW][C]27[/C][C]-0.093371[/C][C]-0.7111[/C][C]0.239939[/C][/ROW]
[ROW][C]28[/C][C]-0.029159[/C][C]-0.2221[/C][C]0.412522[/C][/ROW]
[ROW][C]29[/C][C]0.001281[/C][C]0.0098[/C][C]0.496126[/C][/ROW]
[ROW][C]30[/C][C]-0.003982[/C][C]-0.0303[/C][C]0.487956[/C][/ROW]
[ROW][C]31[/C][C]0.00077[/C][C]0.0059[/C][C]0.49767[/C][/ROW]
[ROW][C]32[/C][C]0.026102[/C][C]0.1988[/C][C]0.421563[/C][/ROW]
[ROW][C]33[/C][C]0.036113[/C][C]0.275[/C][C]0.392137[/C][/ROW]
[ROW][C]34[/C][C]-0.105984[/C][C]-0.8071[/C][C]0.21144[/C][/ROW]
[ROW][C]35[/C][C]0.024478[/C][C]0.1864[/C][C]0.426384[/C][/ROW]
[ROW][C]36[/C][C]-0.016425[/C][C]-0.1251[/C][C]0.450443[/C][/ROW]
[ROW][C]37[/C][C]-0.076936[/C][C]-0.5859[/C][C]0.2801[/C][/ROW]
[ROW][C]38[/C][C]-0.087582[/C][C]-0.667[/C][C]0.253708[/C][/ROW]
[ROW][C]39[/C][C]-0.109444[/C][C]-0.8335[/C][C]0.20399[/C][/ROW]
[ROW][C]40[/C][C]-0.122523[/C][C]-0.9331[/C][C]0.177316[/C][/ROW]
[ROW][C]41[/C][C]0.047733[/C][C]0.3635[/C][C]0.358768[/C][/ROW]
[ROW][C]42[/C][C]0.040235[/C][C]0.3064[/C][C]0.380191[/C][/ROW]
[ROW][C]43[/C][C]-0.040859[/C][C]-0.3112[/C][C]0.378393[/C][/ROW]
[ROW][C]44[/C][C]0.016255[/C][C]0.1238[/C][C]0.450954[/C][/ROW]
[ROW][C]45[/C][C]0.009739[/C][C]0.0742[/C][C]0.470567[/C][/ROW]
[ROW][C]46[/C][C]-0.017492[/C][C]-0.1332[/C][C]0.447241[/C][/ROW]
[ROW][C]47[/C][C]-0.010615[/C][C]-0.0808[/C][C]0.467924[/C][/ROW]
[ROW][C]48[/C][C]-0.079579[/C][C]-0.6061[/C][C]0.273421[/C][/ROW]
[/TABLE]
Source: https://freestatistics.org/blog/index.php?pk=116844&T=2

Globally Unique Identifier (entire table): ba.freestatistics.org/blog/index.php?pk=116844&T=2

As an alternative you can also use a QR Code:  

The GUIDs for individual cells are displayed in the table below:

Partial Autocorrelation Function
Time lag kPACF(k)T-STATP-value
10.3086092.35030.011091
20.268052.04140.022884
30.1779921.35550.090249
40.2707112.06170.021865
50.1033790.78730.217154
60.0558130.42510.336183
7-0.065125-0.4960.310891
8-0.117786-0.8970.186706
9-0.084534-0.64380.261123
10-0.138225-1.05270.148424
110.03340.25440.400056
12-0.449385-3.42240.000572
13-0.044832-0.34140.367006
140.1026680.78190.218729
150.0012640.00960.496175
16-0.191384-1.45750.075181
17-0.000453-0.00340.49863
180.0449020.3420.366807
190.0179120.13640.445982
200.0741350.56460.287264
21-0.106726-0.81280.209829
22-0.073898-0.56280.287874
230.0277150.21110.416785
24-0.108471-0.82610.206069
250.027090.20630.418634
260.1269660.96690.168792
27-0.093371-0.71110.239939
28-0.029159-0.22210.412522
290.0012810.00980.496126
30-0.003982-0.03030.487956
310.000770.00590.49767
320.0261020.19880.421563
330.0361130.2750.392137
34-0.105984-0.80710.21144
350.0244780.18640.426384
36-0.016425-0.12510.450443
37-0.076936-0.58590.2801
38-0.087582-0.6670.253708
39-0.109444-0.83350.20399
40-0.122523-0.93310.177316
410.0477330.36350.358768
420.0402350.30640.380191
43-0.040859-0.31120.378393
440.0162550.12380.450954
450.0097390.07420.470567
46-0.017492-0.13320.447241
47-0.010615-0.08080.467924
48-0.079579-0.60610.273421


Parameters (Session):
par1 = 48 ; par2 = 1 ; par3 = 1 ; par4 = 1 ; par5 = 12 ; par6 = White Noise ; par7 = 0.95 ;
Parameters (R input):
par1 = 48 ; par2 = 1 ; par3 = 1 ; par4 = 1 ; par5 = 12 ; par6 = White Noise ; par7 = 0.95 ; par8 = ;
R code (references can be found in the software module):
if (par1 == 'Default') {
par1 = 10*log10(length(x))
} else {
par1 <- as.numeric(par1)
}
par2 <- as.numeric(par2)
par3 <- as.numeric(par3)
par4 <- as.numeric(par4)
par5 <- as.numeric(par5)
if (par6 == 'White Noise') par6 <- 'white' else par6 <- 'ma'
par7 <- as.numeric(par7)
if (par8 != '') par8 <- as.numeric(par8)
ox <- x
if (par8 == '') {
if (par2 == 0) {
x <- log(x)
} else {
x <- (x ^ par2 - 1) / par2
}
} else {
x <- log(x,base=par8)
}
if (par3 > 0) x <- diff(x,lag=1,difference=par3)
if (par4 > 0) x <- diff(x,lag=par5,difference=par4)
bitmap(file='picts.png')
op <- par(mfrow=c(2,1))
plot(ox,type='l',main='Original Time Series',xlab='time',ylab='value')
if (par8=='') {
mytitle <- paste('Working Time Series (lambda=',par2,', d=',par3,', D=',par4,')',sep='')
mysub <- paste('(lambda=',par2,', d=',par3,', D=',par4,', CI=', par7, ', CI type=',par6,')',sep='')
} else {
mytitle <- paste('Working Time Series (base=',par8,', d=',par3,', D=',par4,')',sep='')
mysub <- paste('(base=',par8,', d=',par3,', D=',par4,', CI=', par7, ', CI type=',par6,')',sep='')
}
plot(x,type='l', main=mytitle,xlab='time',ylab='value')
par(op)
dev.off()
bitmap(file='pic1.png')
racf <- acf(x, par1, main='Autocorrelation', xlab='time lag', ylab='ACF', ci.type=par6, ci=par7, sub=mysub)
dev.off()
bitmap(file='pic2.png')
rpacf <- pacf(x,par1,main='Partial Autocorrelation',xlab='lags',ylab='PACF',sub=mysub)
dev.off()
(myacf <- c(racf$acf))
(mypacf <- c(rpacf$acf))
lengthx <- length(x)
sqrtn <- sqrt(lengthx)
load(file='createtable')
a<-table.start()
a<-table.row.start(a)
a<-table.element(a,'Autocorrelation Function',4,TRUE)
a<-table.row.end(a)
a<-table.row.start(a)
a<-table.element(a,'Time lag k',header=TRUE)
a<-table.element(a,hyperlink('basics.htm','ACF(k)','click here for more information about the Autocorrelation Function'),header=TRUE)
a<-table.element(a,'T-STAT',header=TRUE)
a<-table.element(a,'P-value',header=TRUE)
a<-table.row.end(a)
for (i in 2:(par1+1)) {
a<-table.row.start(a)
a<-table.element(a,i-1,header=TRUE)
a<-table.element(a,round(myacf[i],6))
mytstat <- myacf[i]*sqrtn
a<-table.element(a,round(mytstat,4))
a<-table.element(a,round(1-pt(abs(mytstat),lengthx),6))
a<-table.row.end(a)
}
a<-table.end(a)
table.save(a,file='mytable.tab')
a<-table.start()
a<-table.row.start(a)
a<-table.element(a,'Partial Autocorrelation Function',4,TRUE)
a<-table.row.end(a)
a<-table.row.start(a)
a<-table.element(a,'Time lag k',header=TRUE)
a<-table.element(a,hyperlink('basics.htm','PACF(k)','click here for more information about the Partial Autocorrelation Function'),header=TRUE)
a<-table.element(a,'T-STAT',header=TRUE)
a<-table.element(a,'P-value',header=TRUE)
a<-table.row.end(a)
for (i in 1:par1) {
a<-table.row.start(a)
a<-table.element(a,i,header=TRUE)
a<-table.element(a,round(mypacf[i],6))
mytstat <- mypacf[i]*sqrtn
a<-table.element(a,round(mytstat,4))
a<-table.element(a,round(1-pt(abs(mytstat),lengthx),6))
a<-table.row.end(a)
}
a<-table.end(a)
table.save(a,file='mytable1.tab')