Free Statistics

of Irreproducible Research!

Author's title

Author*The author of this computation has been verified*
R Software Modulerwasp_autocorrelation.wasp
Title produced by software(Partial) Autocorrelation Function
Date of computationWed, 29 Dec 2010 13:49:41 +0000
Cite this page as followsStatistical Computations at FreeStatistics.org, Office for Research Development and Education, URL https://freestatistics.org/blog/index.php?v=date/2010/Dec/29/t129363057134nu6hmfbiwu7sp.htm/, Retrieved Fri, 03 May 2024 04:57:54 +0000
Statistical Computations at FreeStatistics.org, Office for Research Development and Education, URL https://freestatistics.org/blog/index.php?pk=116840, Retrieved Fri, 03 May 2024 04:57:54 +0000
QR Codes:

Original text written by user:
IsPrivate?No (this computation is public)
User-defined keywords
Estimated Impact127
Family? (F = Feedback message, R = changed R code, M = changed R Module, P = changed Parameters, D = changed Data)
-       [(Partial) Autocorrelation Function] [] [2010-12-29 13:49:41] [95fdfecfb4f2f50e2168e1a971ea5f83] [Current]
Feedback Forum

Post a new message
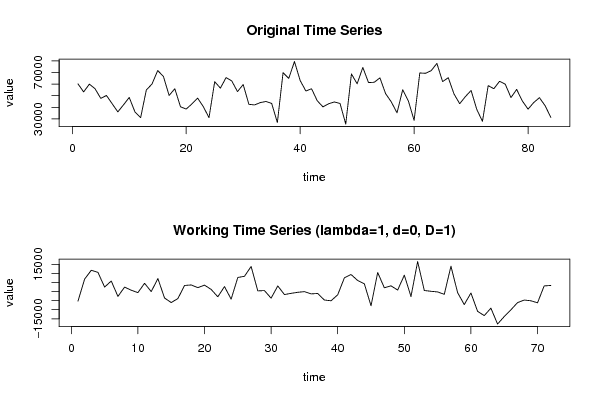
Dataseries X:
60178
53200
59909
55970
47682
50173
43090
36031
42143
48478
36046
31060
54874
60051
71622
66526
50140
55973
40393
38483
42879
47875
40578
31027
62027
56493
65566
62653
53470
59600
42542
42018
44038
44988
43309
26843
69770
64886
79354
63025
54003
55926
45629
40361
43039
44570
43269
25563
68707
60223
74283
61232
61531
65305
51699
44599
35221
55066
45335
28702
69517
69240
71525
77740
62107
65450
51493
43067
49172
54483
38158
27898
58648
56000
62381
59849
48345
55376
45400
38389
44098
48290
41267
31238


Summary of computational transaction
Raw Inputview raw input (R code)
Raw Outputview raw output of R engine
Computing time2 seconds
R Server'Sir Ronald Aylmer Fisher' @ 193.190.124.24

\begin{tabular}{lllllllll}
\hline
Summary of computational transaction \tabularnewline
Raw Input & view raw input (R code)  \tabularnewline
Raw Output & view raw output of R engine  \tabularnewline
Computing time & 2 seconds \tabularnewline
R Server & 'Sir Ronald Aylmer Fisher' @ 193.190.124.24 \tabularnewline
\hline
\end{tabular}
%Source: https://freestatistics.org/blog/index.php?pk=116840&T=0

[TABLE]
[ROW][C]Summary of computational transaction[/C][/ROW]
[ROW][C]Raw Input[/C][C]view raw input (R code) [/C][/ROW]
[ROW][C]Raw Output[/C][C]view raw output of R engine [/C][/ROW]
[ROW][C]Computing time[/C][C]2 seconds[/C][/ROW]
[ROW][C]R Server[/C][C]'Sir Ronald Aylmer Fisher' @ 193.190.124.24[/C][/ROW]
[/TABLE]
Source: https://freestatistics.org/blog/index.php?pk=116840&T=0

Globally Unique Identifier (entire table): ba.freestatistics.org/blog/index.php?pk=116840&T=0

As an alternative you can also use a QR Code:  

The GUIDs for individual cells are displayed in the table below:

Summary of computational transaction
Raw Inputview raw input (R code)
Raw Outputview raw output of R engine
Computing time2 seconds
R Server'Sir Ronald Aylmer Fisher' @ 193.190.124.24


Autocorrelation Function
Time lag kACF(k)T-STATP-value
10.4201093.56470.000326
20.39553.35590.000633
30.1965341.66760.049865
40.1771951.50360.068535
50.1721751.4610.074189
60.1726171.46470.073678
7-0.008135-0.0690.472579
80.0563320.4780.317052
9-0.03124-0.26510.395853
10-0.08631-0.73240.233161
11-0.127409-1.08110.141629
12-0.335342-2.84550.002886
13-0.223056-1.89270.031209
14-0.018201-0.15440.438847
150.0370530.31440.377061
16-0.00603-0.05120.479667
17-0.055907-0.47440.318329
18-0.208755-1.77130.040367
19-0.080742-0.68510.247734
20-0.139756-1.18590.119786
210.0219040.18590.426537
22-0.048861-0.41460.339833
230.1306661.10870.135617
240.0461480.39160.348262
250.1296111.09980.137545
260.0084780.07190.471426
270.0038690.03280.48695
28-0.026901-0.22830.410045
290.0946570.80320.212254
300.1024190.86910.193853
310.087260.74040.230725
320.0185180.15710.437791
33-0.022123-0.18770.425813
34-0.0803-0.68140.248913
35-0.087812-0.74510.229315
36-0.137086-1.16320.124291
37-0.078032-0.66210.255002
38-0.053879-0.45720.324459
39-0.009288-0.07880.468701
400.0049340.04190.483362
41-0.072755-0.61730.269478
42-0.081385-0.69060.246026
43-0.069867-0.59280.277574
440.0709630.60210.274487
45-0.032911-0.27930.390424
460.0802110.68060.249149
470.0337050.2860.38785
480.0566510.48070.316095
490.0608860.51660.303498
500.0296450.25150.401054
51-0.029535-0.25060.401413
52-0.007689-0.06520.47408
53-0.003458-0.02930.488337
540.0432090.36660.357483
55-0.012514-0.10620.457865
56-0.112337-0.95320.171837
57-0.101872-0.86440.195116
58-0.109342-0.92780.178306
59-0.134895-1.14460.128078
60-0.122742-1.04150.150564

\begin{tabular}{lllllllll}
\hline
Autocorrelation Function \tabularnewline
Time lag k & ACF(k) & T-STAT & P-value \tabularnewline
1 & 0.420109 & 3.5647 & 0.000326 \tabularnewline
2 & 0.3955 & 3.3559 & 0.000633 \tabularnewline
3 & 0.196534 & 1.6676 & 0.049865 \tabularnewline
4 & 0.177195 & 1.5036 & 0.068535 \tabularnewline
5 & 0.172175 & 1.461 & 0.074189 \tabularnewline
6 & 0.172617 & 1.4647 & 0.073678 \tabularnewline
7 & -0.008135 & -0.069 & 0.472579 \tabularnewline
8 & 0.056332 & 0.478 & 0.317052 \tabularnewline
9 & -0.03124 & -0.2651 & 0.395853 \tabularnewline
10 & -0.08631 & -0.7324 & 0.233161 \tabularnewline
11 & -0.127409 & -1.0811 & 0.141629 \tabularnewline
12 & -0.335342 & -2.8455 & 0.002886 \tabularnewline
13 & -0.223056 & -1.8927 & 0.031209 \tabularnewline
14 & -0.018201 & -0.1544 & 0.438847 \tabularnewline
15 & 0.037053 & 0.3144 & 0.377061 \tabularnewline
16 & -0.00603 & -0.0512 & 0.479667 \tabularnewline
17 & -0.055907 & -0.4744 & 0.318329 \tabularnewline
18 & -0.208755 & -1.7713 & 0.040367 \tabularnewline
19 & -0.080742 & -0.6851 & 0.247734 \tabularnewline
20 & -0.139756 & -1.1859 & 0.119786 \tabularnewline
21 & 0.021904 & 0.1859 & 0.426537 \tabularnewline
22 & -0.048861 & -0.4146 & 0.339833 \tabularnewline
23 & 0.130666 & 1.1087 & 0.135617 \tabularnewline
24 & 0.046148 & 0.3916 & 0.348262 \tabularnewline
25 & 0.129611 & 1.0998 & 0.137545 \tabularnewline
26 & 0.008478 & 0.0719 & 0.471426 \tabularnewline
27 & 0.003869 & 0.0328 & 0.48695 \tabularnewline
28 & -0.026901 & -0.2283 & 0.410045 \tabularnewline
29 & 0.094657 & 0.8032 & 0.212254 \tabularnewline
30 & 0.102419 & 0.8691 & 0.193853 \tabularnewline
31 & 0.08726 & 0.7404 & 0.230725 \tabularnewline
32 & 0.018518 & 0.1571 & 0.437791 \tabularnewline
33 & -0.022123 & -0.1877 & 0.425813 \tabularnewline
34 & -0.0803 & -0.6814 & 0.248913 \tabularnewline
35 & -0.087812 & -0.7451 & 0.229315 \tabularnewline
36 & -0.137086 & -1.1632 & 0.124291 \tabularnewline
37 & -0.078032 & -0.6621 & 0.255002 \tabularnewline
38 & -0.053879 & -0.4572 & 0.324459 \tabularnewline
39 & -0.009288 & -0.0788 & 0.468701 \tabularnewline
40 & 0.004934 & 0.0419 & 0.483362 \tabularnewline
41 & -0.072755 & -0.6173 & 0.269478 \tabularnewline
42 & -0.081385 & -0.6906 & 0.246026 \tabularnewline
43 & -0.069867 & -0.5928 & 0.277574 \tabularnewline
44 & 0.070963 & 0.6021 & 0.274487 \tabularnewline
45 & -0.032911 & -0.2793 & 0.390424 \tabularnewline
46 & 0.080211 & 0.6806 & 0.249149 \tabularnewline
47 & 0.033705 & 0.286 & 0.38785 \tabularnewline
48 & 0.056651 & 0.4807 & 0.316095 \tabularnewline
49 & 0.060886 & 0.5166 & 0.303498 \tabularnewline
50 & 0.029645 & 0.2515 & 0.401054 \tabularnewline
51 & -0.029535 & -0.2506 & 0.401413 \tabularnewline
52 & -0.007689 & -0.0652 & 0.47408 \tabularnewline
53 & -0.003458 & -0.0293 & 0.488337 \tabularnewline
54 & 0.043209 & 0.3666 & 0.357483 \tabularnewline
55 & -0.012514 & -0.1062 & 0.457865 \tabularnewline
56 & -0.112337 & -0.9532 & 0.171837 \tabularnewline
57 & -0.101872 & -0.8644 & 0.195116 \tabularnewline
58 & -0.109342 & -0.9278 & 0.178306 \tabularnewline
59 & -0.134895 & -1.1446 & 0.128078 \tabularnewline
60 & -0.122742 & -1.0415 & 0.150564 \tabularnewline
\hline
\end{tabular}
%Source: https://freestatistics.org/blog/index.php?pk=116840&T=1

[TABLE]
[ROW][C]Autocorrelation Function[/C][/ROW]
[ROW][C]Time lag k[/C][C]ACF(k)[/C][C]T-STAT[/C][C]P-value[/C][/ROW]
[ROW][C]1[/C][C]0.420109[/C][C]3.5647[/C][C]0.000326[/C][/ROW]
[ROW][C]2[/C][C]0.3955[/C][C]3.3559[/C][C]0.000633[/C][/ROW]
[ROW][C]3[/C][C]0.196534[/C][C]1.6676[/C][C]0.049865[/C][/ROW]
[ROW][C]4[/C][C]0.177195[/C][C]1.5036[/C][C]0.068535[/C][/ROW]
[ROW][C]5[/C][C]0.172175[/C][C]1.461[/C][C]0.074189[/C][/ROW]
[ROW][C]6[/C][C]0.172617[/C][C]1.4647[/C][C]0.073678[/C][/ROW]
[ROW][C]7[/C][C]-0.008135[/C][C]-0.069[/C][C]0.472579[/C][/ROW]
[ROW][C]8[/C][C]0.056332[/C][C]0.478[/C][C]0.317052[/C][/ROW]
[ROW][C]9[/C][C]-0.03124[/C][C]-0.2651[/C][C]0.395853[/C][/ROW]
[ROW][C]10[/C][C]-0.08631[/C][C]-0.7324[/C][C]0.233161[/C][/ROW]
[ROW][C]11[/C][C]-0.127409[/C][C]-1.0811[/C][C]0.141629[/C][/ROW]
[ROW][C]12[/C][C]-0.335342[/C][C]-2.8455[/C][C]0.002886[/C][/ROW]
[ROW][C]13[/C][C]-0.223056[/C][C]-1.8927[/C][C]0.031209[/C][/ROW]
[ROW][C]14[/C][C]-0.018201[/C][C]-0.1544[/C][C]0.438847[/C][/ROW]
[ROW][C]15[/C][C]0.037053[/C][C]0.3144[/C][C]0.377061[/C][/ROW]
[ROW][C]16[/C][C]-0.00603[/C][C]-0.0512[/C][C]0.479667[/C][/ROW]
[ROW][C]17[/C][C]-0.055907[/C][C]-0.4744[/C][C]0.318329[/C][/ROW]
[ROW][C]18[/C][C]-0.208755[/C][C]-1.7713[/C][C]0.040367[/C][/ROW]
[ROW][C]19[/C][C]-0.080742[/C][C]-0.6851[/C][C]0.247734[/C][/ROW]
[ROW][C]20[/C][C]-0.139756[/C][C]-1.1859[/C][C]0.119786[/C][/ROW]
[ROW][C]21[/C][C]0.021904[/C][C]0.1859[/C][C]0.426537[/C][/ROW]
[ROW][C]22[/C][C]-0.048861[/C][C]-0.4146[/C][C]0.339833[/C][/ROW]
[ROW][C]23[/C][C]0.130666[/C][C]1.1087[/C][C]0.135617[/C][/ROW]
[ROW][C]24[/C][C]0.046148[/C][C]0.3916[/C][C]0.348262[/C][/ROW]
[ROW][C]25[/C][C]0.129611[/C][C]1.0998[/C][C]0.137545[/C][/ROW]
[ROW][C]26[/C][C]0.008478[/C][C]0.0719[/C][C]0.471426[/C][/ROW]
[ROW][C]27[/C][C]0.003869[/C][C]0.0328[/C][C]0.48695[/C][/ROW]
[ROW][C]28[/C][C]-0.026901[/C][C]-0.2283[/C][C]0.410045[/C][/ROW]
[ROW][C]29[/C][C]0.094657[/C][C]0.8032[/C][C]0.212254[/C][/ROW]
[ROW][C]30[/C][C]0.102419[/C][C]0.8691[/C][C]0.193853[/C][/ROW]
[ROW][C]31[/C][C]0.08726[/C][C]0.7404[/C][C]0.230725[/C][/ROW]
[ROW][C]32[/C][C]0.018518[/C][C]0.1571[/C][C]0.437791[/C][/ROW]
[ROW][C]33[/C][C]-0.022123[/C][C]-0.1877[/C][C]0.425813[/C][/ROW]
[ROW][C]34[/C][C]-0.0803[/C][C]-0.6814[/C][C]0.248913[/C][/ROW]
[ROW][C]35[/C][C]-0.087812[/C][C]-0.7451[/C][C]0.229315[/C][/ROW]
[ROW][C]36[/C][C]-0.137086[/C][C]-1.1632[/C][C]0.124291[/C][/ROW]
[ROW][C]37[/C][C]-0.078032[/C][C]-0.6621[/C][C]0.255002[/C][/ROW]
[ROW][C]38[/C][C]-0.053879[/C][C]-0.4572[/C][C]0.324459[/C][/ROW]
[ROW][C]39[/C][C]-0.009288[/C][C]-0.0788[/C][C]0.468701[/C][/ROW]
[ROW][C]40[/C][C]0.004934[/C][C]0.0419[/C][C]0.483362[/C][/ROW]
[ROW][C]41[/C][C]-0.072755[/C][C]-0.6173[/C][C]0.269478[/C][/ROW]
[ROW][C]42[/C][C]-0.081385[/C][C]-0.6906[/C][C]0.246026[/C][/ROW]
[ROW][C]43[/C][C]-0.069867[/C][C]-0.5928[/C][C]0.277574[/C][/ROW]
[ROW][C]44[/C][C]0.070963[/C][C]0.6021[/C][C]0.274487[/C][/ROW]
[ROW][C]45[/C][C]-0.032911[/C][C]-0.2793[/C][C]0.390424[/C][/ROW]
[ROW][C]46[/C][C]0.080211[/C][C]0.6806[/C][C]0.249149[/C][/ROW]
[ROW][C]47[/C][C]0.033705[/C][C]0.286[/C][C]0.38785[/C][/ROW]
[ROW][C]48[/C][C]0.056651[/C][C]0.4807[/C][C]0.316095[/C][/ROW]
[ROW][C]49[/C][C]0.060886[/C][C]0.5166[/C][C]0.303498[/C][/ROW]
[ROW][C]50[/C][C]0.029645[/C][C]0.2515[/C][C]0.401054[/C][/ROW]
[ROW][C]51[/C][C]-0.029535[/C][C]-0.2506[/C][C]0.401413[/C][/ROW]
[ROW][C]52[/C][C]-0.007689[/C][C]-0.0652[/C][C]0.47408[/C][/ROW]
[ROW][C]53[/C][C]-0.003458[/C][C]-0.0293[/C][C]0.488337[/C][/ROW]
[ROW][C]54[/C][C]0.043209[/C][C]0.3666[/C][C]0.357483[/C][/ROW]
[ROW][C]55[/C][C]-0.012514[/C][C]-0.1062[/C][C]0.457865[/C][/ROW]
[ROW][C]56[/C][C]-0.112337[/C][C]-0.9532[/C][C]0.171837[/C][/ROW]
[ROW][C]57[/C][C]-0.101872[/C][C]-0.8644[/C][C]0.195116[/C][/ROW]
[ROW][C]58[/C][C]-0.109342[/C][C]-0.9278[/C][C]0.178306[/C][/ROW]
[ROW][C]59[/C][C]-0.134895[/C][C]-1.1446[/C][C]0.128078[/C][/ROW]
[ROW][C]60[/C][C]-0.122742[/C][C]-1.0415[/C][C]0.150564[/C][/ROW]
[/TABLE]
Source: https://freestatistics.org/blog/index.php?pk=116840&T=1

Globally Unique Identifier (entire table): ba.freestatistics.org/blog/index.php?pk=116840&T=1

As an alternative you can also use a QR Code:  

The GUIDs for individual cells are displayed in the table below:

Autocorrelation Function
Time lag kACF(k)T-STATP-value
10.4201093.56470.000326
20.39553.35590.000633
30.1965341.66760.049865
40.1771951.50360.068535
50.1721751.4610.074189
60.1726171.46470.073678
7-0.008135-0.0690.472579
80.0563320.4780.317052
9-0.03124-0.26510.395853
10-0.08631-0.73240.233161
11-0.127409-1.08110.141629
12-0.335342-2.84550.002886
13-0.223056-1.89270.031209
14-0.018201-0.15440.438847
150.0370530.31440.377061
16-0.00603-0.05120.479667
17-0.055907-0.47440.318329
18-0.208755-1.77130.040367
19-0.080742-0.68510.247734
20-0.139756-1.18590.119786
210.0219040.18590.426537
22-0.048861-0.41460.339833
230.1306661.10870.135617
240.0461480.39160.348262
250.1296111.09980.137545
260.0084780.07190.471426
270.0038690.03280.48695
28-0.026901-0.22830.410045
290.0946570.80320.212254
300.1024190.86910.193853
310.087260.74040.230725
320.0185180.15710.437791
33-0.022123-0.18770.425813
34-0.0803-0.68140.248913
35-0.087812-0.74510.229315
36-0.137086-1.16320.124291
37-0.078032-0.66210.255002
38-0.053879-0.45720.324459
39-0.009288-0.07880.468701
400.0049340.04190.483362
41-0.072755-0.61730.269478
42-0.081385-0.69060.246026
43-0.069867-0.59280.277574
440.0709630.60210.274487
45-0.032911-0.27930.390424
460.0802110.68060.249149
470.0337050.2860.38785
480.0566510.48070.316095
490.0608860.51660.303498
500.0296450.25150.401054
51-0.029535-0.25060.401413
52-0.007689-0.06520.47408
53-0.003458-0.02930.488337
540.0432090.36660.357483
55-0.012514-0.10620.457865
56-0.112337-0.95320.171837
57-0.101872-0.86440.195116
58-0.109342-0.92780.178306
59-0.134895-1.14460.128078
60-0.122742-1.04150.150564


Partial Autocorrelation Function
Time lag kPACF(k)T-STATP-value
10.4201093.56470.000326
20.2659462.25660.013534
3-0.048555-0.4120.340781
40.0305770.25950.398013
50.0940040.79760.213849
60.0598260.50760.306627
7-0.196134-1.66430.050204
80.0513940.43610.332036
9-0.012857-0.10910.456716
10-0.144895-1.22950.111449
11-0.084367-0.71590.238192
12-0.279332-2.37020.010229
130.0491960.41740.338799
140.3162122.68310.004521
150.1243751.05540.147395
16-0.139207-1.18120.120703
17-0.068017-0.57710.282823
18-0.150415-1.27630.102973
19-0.032663-0.27720.391227
20-0.085771-0.72780.234552
210.2008441.70420.046326
22-0.032353-0.27450.392235
230.1858511.5770.05959
24-0.092302-0.78320.218037
25-0.053116-0.45070.326777
260.1113730.9450.173902
270.0473380.40170.344556
28-0.106633-0.90480.184293
29-0.029136-0.24720.402719
30-0.023889-0.20270.419969
31-0.102988-0.87390.192545
32-0.031348-0.2660.395502
330.1530591.29880.099087
34-0.046062-0.39090.34853
350.0117860.10.460308
36-0.1196-1.01480.15679
37-0.058533-0.49670.310469
380.0141850.12040.452266
390.1594971.35340.090085
40-0.040287-0.34180.366731
41-0.013098-0.11110.455906
42-0.024823-0.21060.416885
43-0.003281-0.02780.488932
440.0880050.74670.228824
45-0.061793-0.52430.300829
46-0.001297-0.0110.495626
470.0783660.6650.254101
48-0.093812-0.7960.214318
49-0.010353-0.08780.465121
500.0146740.12450.450629
510.0807310.6850.247764
52-0.099908-0.84770.199694
53-0.024045-0.2040.419452
54-0.070891-0.60150.274689
55-0.096068-0.81520.208833
56-0.056227-0.47710.317367
570.0793640.67340.251417
58-0.080321-0.68150.248856
590.036040.30580.380315
60-0.086725-0.73590.232095

\begin{tabular}{lllllllll}
\hline
Partial Autocorrelation Function \tabularnewline
Time lag k & PACF(k) & T-STAT & P-value \tabularnewline
1 & 0.420109 & 3.5647 & 0.000326 \tabularnewline
2 & 0.265946 & 2.2566 & 0.013534 \tabularnewline
3 & -0.048555 & -0.412 & 0.340781 \tabularnewline
4 & 0.030577 & 0.2595 & 0.398013 \tabularnewline
5 & 0.094004 & 0.7976 & 0.213849 \tabularnewline
6 & 0.059826 & 0.5076 & 0.306627 \tabularnewline
7 & -0.196134 & -1.6643 & 0.050204 \tabularnewline
8 & 0.051394 & 0.4361 & 0.332036 \tabularnewline
9 & -0.012857 & -0.1091 & 0.456716 \tabularnewline
10 & -0.144895 & -1.2295 & 0.111449 \tabularnewline
11 & -0.084367 & -0.7159 & 0.238192 \tabularnewline
12 & -0.279332 & -2.3702 & 0.010229 \tabularnewline
13 & 0.049196 & 0.4174 & 0.338799 \tabularnewline
14 & 0.316212 & 2.6831 & 0.004521 \tabularnewline
15 & 0.124375 & 1.0554 & 0.147395 \tabularnewline
16 & -0.139207 & -1.1812 & 0.120703 \tabularnewline
17 & -0.068017 & -0.5771 & 0.282823 \tabularnewline
18 & -0.150415 & -1.2763 & 0.102973 \tabularnewline
19 & -0.032663 & -0.2772 & 0.391227 \tabularnewline
20 & -0.085771 & -0.7278 & 0.234552 \tabularnewline
21 & 0.200844 & 1.7042 & 0.046326 \tabularnewline
22 & -0.032353 & -0.2745 & 0.392235 \tabularnewline
23 & 0.185851 & 1.577 & 0.05959 \tabularnewline
24 & -0.092302 & -0.7832 & 0.218037 \tabularnewline
25 & -0.053116 & -0.4507 & 0.326777 \tabularnewline
26 & 0.111373 & 0.945 & 0.173902 \tabularnewline
27 & 0.047338 & 0.4017 & 0.344556 \tabularnewline
28 & -0.106633 & -0.9048 & 0.184293 \tabularnewline
29 & -0.029136 & -0.2472 & 0.402719 \tabularnewline
30 & -0.023889 & -0.2027 & 0.419969 \tabularnewline
31 & -0.102988 & -0.8739 & 0.192545 \tabularnewline
32 & -0.031348 & -0.266 & 0.395502 \tabularnewline
33 & 0.153059 & 1.2988 & 0.099087 \tabularnewline
34 & -0.046062 & -0.3909 & 0.34853 \tabularnewline
35 & 0.011786 & 0.1 & 0.460308 \tabularnewline
36 & -0.1196 & -1.0148 & 0.15679 \tabularnewline
37 & -0.058533 & -0.4967 & 0.310469 \tabularnewline
38 & 0.014185 & 0.1204 & 0.452266 \tabularnewline
39 & 0.159497 & 1.3534 & 0.090085 \tabularnewline
40 & -0.040287 & -0.3418 & 0.366731 \tabularnewline
41 & -0.013098 & -0.1111 & 0.455906 \tabularnewline
42 & -0.024823 & -0.2106 & 0.416885 \tabularnewline
43 & -0.003281 & -0.0278 & 0.488932 \tabularnewline
44 & 0.088005 & 0.7467 & 0.228824 \tabularnewline
45 & -0.061793 & -0.5243 & 0.300829 \tabularnewline
46 & -0.001297 & -0.011 & 0.495626 \tabularnewline
47 & 0.078366 & 0.665 & 0.254101 \tabularnewline
48 & -0.093812 & -0.796 & 0.214318 \tabularnewline
49 & -0.010353 & -0.0878 & 0.465121 \tabularnewline
50 & 0.014674 & 0.1245 & 0.450629 \tabularnewline
51 & 0.080731 & 0.685 & 0.247764 \tabularnewline
52 & -0.099908 & -0.8477 & 0.199694 \tabularnewline
53 & -0.024045 & -0.204 & 0.419452 \tabularnewline
54 & -0.070891 & -0.6015 & 0.274689 \tabularnewline
55 & -0.096068 & -0.8152 & 0.208833 \tabularnewline
56 & -0.056227 & -0.4771 & 0.317367 \tabularnewline
57 & 0.079364 & 0.6734 & 0.251417 \tabularnewline
58 & -0.080321 & -0.6815 & 0.248856 \tabularnewline
59 & 0.03604 & 0.3058 & 0.380315 \tabularnewline
60 & -0.086725 & -0.7359 & 0.232095 \tabularnewline
\hline
\end{tabular}
%Source: https://freestatistics.org/blog/index.php?pk=116840&T=2

[TABLE]
[ROW][C]Partial Autocorrelation Function[/C][/ROW]
[ROW][C]Time lag k[/C][C]PACF(k)[/C][C]T-STAT[/C][C]P-value[/C][/ROW]
[ROW][C]1[/C][C]0.420109[/C][C]3.5647[/C][C]0.000326[/C][/ROW]
[ROW][C]2[/C][C]0.265946[/C][C]2.2566[/C][C]0.013534[/C][/ROW]
[ROW][C]3[/C][C]-0.048555[/C][C]-0.412[/C][C]0.340781[/C][/ROW]
[ROW][C]4[/C][C]0.030577[/C][C]0.2595[/C][C]0.398013[/C][/ROW]
[ROW][C]5[/C][C]0.094004[/C][C]0.7976[/C][C]0.213849[/C][/ROW]
[ROW][C]6[/C][C]0.059826[/C][C]0.5076[/C][C]0.306627[/C][/ROW]
[ROW][C]7[/C][C]-0.196134[/C][C]-1.6643[/C][C]0.050204[/C][/ROW]
[ROW][C]8[/C][C]0.051394[/C][C]0.4361[/C][C]0.332036[/C][/ROW]
[ROW][C]9[/C][C]-0.012857[/C][C]-0.1091[/C][C]0.456716[/C][/ROW]
[ROW][C]10[/C][C]-0.144895[/C][C]-1.2295[/C][C]0.111449[/C][/ROW]
[ROW][C]11[/C][C]-0.084367[/C][C]-0.7159[/C][C]0.238192[/C][/ROW]
[ROW][C]12[/C][C]-0.279332[/C][C]-2.3702[/C][C]0.010229[/C][/ROW]
[ROW][C]13[/C][C]0.049196[/C][C]0.4174[/C][C]0.338799[/C][/ROW]
[ROW][C]14[/C][C]0.316212[/C][C]2.6831[/C][C]0.004521[/C][/ROW]
[ROW][C]15[/C][C]0.124375[/C][C]1.0554[/C][C]0.147395[/C][/ROW]
[ROW][C]16[/C][C]-0.139207[/C][C]-1.1812[/C][C]0.120703[/C][/ROW]
[ROW][C]17[/C][C]-0.068017[/C][C]-0.5771[/C][C]0.282823[/C][/ROW]
[ROW][C]18[/C][C]-0.150415[/C][C]-1.2763[/C][C]0.102973[/C][/ROW]
[ROW][C]19[/C][C]-0.032663[/C][C]-0.2772[/C][C]0.391227[/C][/ROW]
[ROW][C]20[/C][C]-0.085771[/C][C]-0.7278[/C][C]0.234552[/C][/ROW]
[ROW][C]21[/C][C]0.200844[/C][C]1.7042[/C][C]0.046326[/C][/ROW]
[ROW][C]22[/C][C]-0.032353[/C][C]-0.2745[/C][C]0.392235[/C][/ROW]
[ROW][C]23[/C][C]0.185851[/C][C]1.577[/C][C]0.05959[/C][/ROW]
[ROW][C]24[/C][C]-0.092302[/C][C]-0.7832[/C][C]0.218037[/C][/ROW]
[ROW][C]25[/C][C]-0.053116[/C][C]-0.4507[/C][C]0.326777[/C][/ROW]
[ROW][C]26[/C][C]0.111373[/C][C]0.945[/C][C]0.173902[/C][/ROW]
[ROW][C]27[/C][C]0.047338[/C][C]0.4017[/C][C]0.344556[/C][/ROW]
[ROW][C]28[/C][C]-0.106633[/C][C]-0.9048[/C][C]0.184293[/C][/ROW]
[ROW][C]29[/C][C]-0.029136[/C][C]-0.2472[/C][C]0.402719[/C][/ROW]
[ROW][C]30[/C][C]-0.023889[/C][C]-0.2027[/C][C]0.419969[/C][/ROW]
[ROW][C]31[/C][C]-0.102988[/C][C]-0.8739[/C][C]0.192545[/C][/ROW]
[ROW][C]32[/C][C]-0.031348[/C][C]-0.266[/C][C]0.395502[/C][/ROW]
[ROW][C]33[/C][C]0.153059[/C][C]1.2988[/C][C]0.099087[/C][/ROW]
[ROW][C]34[/C][C]-0.046062[/C][C]-0.3909[/C][C]0.34853[/C][/ROW]
[ROW][C]35[/C][C]0.011786[/C][C]0.1[/C][C]0.460308[/C][/ROW]
[ROW][C]36[/C][C]-0.1196[/C][C]-1.0148[/C][C]0.15679[/C][/ROW]
[ROW][C]37[/C][C]-0.058533[/C][C]-0.4967[/C][C]0.310469[/C][/ROW]
[ROW][C]38[/C][C]0.014185[/C][C]0.1204[/C][C]0.452266[/C][/ROW]
[ROW][C]39[/C][C]0.159497[/C][C]1.3534[/C][C]0.090085[/C][/ROW]
[ROW][C]40[/C][C]-0.040287[/C][C]-0.3418[/C][C]0.366731[/C][/ROW]
[ROW][C]41[/C][C]-0.013098[/C][C]-0.1111[/C][C]0.455906[/C][/ROW]
[ROW][C]42[/C][C]-0.024823[/C][C]-0.2106[/C][C]0.416885[/C][/ROW]
[ROW][C]43[/C][C]-0.003281[/C][C]-0.0278[/C][C]0.488932[/C][/ROW]
[ROW][C]44[/C][C]0.088005[/C][C]0.7467[/C][C]0.228824[/C][/ROW]
[ROW][C]45[/C][C]-0.061793[/C][C]-0.5243[/C][C]0.300829[/C][/ROW]
[ROW][C]46[/C][C]-0.001297[/C][C]-0.011[/C][C]0.495626[/C][/ROW]
[ROW][C]47[/C][C]0.078366[/C][C]0.665[/C][C]0.254101[/C][/ROW]
[ROW][C]48[/C][C]-0.093812[/C][C]-0.796[/C][C]0.214318[/C][/ROW]
[ROW][C]49[/C][C]-0.010353[/C][C]-0.0878[/C][C]0.465121[/C][/ROW]
[ROW][C]50[/C][C]0.014674[/C][C]0.1245[/C][C]0.450629[/C][/ROW]
[ROW][C]51[/C][C]0.080731[/C][C]0.685[/C][C]0.247764[/C][/ROW]
[ROW][C]52[/C][C]-0.099908[/C][C]-0.8477[/C][C]0.199694[/C][/ROW]
[ROW][C]53[/C][C]-0.024045[/C][C]-0.204[/C][C]0.419452[/C][/ROW]
[ROW][C]54[/C][C]-0.070891[/C][C]-0.6015[/C][C]0.274689[/C][/ROW]
[ROW][C]55[/C][C]-0.096068[/C][C]-0.8152[/C][C]0.208833[/C][/ROW]
[ROW][C]56[/C][C]-0.056227[/C][C]-0.4771[/C][C]0.317367[/C][/ROW]
[ROW][C]57[/C][C]0.079364[/C][C]0.6734[/C][C]0.251417[/C][/ROW]
[ROW][C]58[/C][C]-0.080321[/C][C]-0.6815[/C][C]0.248856[/C][/ROW]
[ROW][C]59[/C][C]0.03604[/C][C]0.3058[/C][C]0.380315[/C][/ROW]
[ROW][C]60[/C][C]-0.086725[/C][C]-0.7359[/C][C]0.232095[/C][/ROW]
[/TABLE]
Source: https://freestatistics.org/blog/index.php?pk=116840&T=2

Globally Unique Identifier (entire table): ba.freestatistics.org/blog/index.php?pk=116840&T=2

As an alternative you can also use a QR Code:  

The GUIDs for individual cells are displayed in the table below:

Partial Autocorrelation Function
Time lag kPACF(k)T-STATP-value
10.4201093.56470.000326
20.2659462.25660.013534
3-0.048555-0.4120.340781
40.0305770.25950.398013
50.0940040.79760.213849
60.0598260.50760.306627
7-0.196134-1.66430.050204
80.0513940.43610.332036
9-0.012857-0.10910.456716
10-0.144895-1.22950.111449
11-0.084367-0.71590.238192
12-0.279332-2.37020.010229
130.0491960.41740.338799
140.3162122.68310.004521
150.1243751.05540.147395
16-0.139207-1.18120.120703
17-0.068017-0.57710.282823
18-0.150415-1.27630.102973
19-0.032663-0.27720.391227
20-0.085771-0.72780.234552
210.2008441.70420.046326
22-0.032353-0.27450.392235
230.1858511.5770.05959
24-0.092302-0.78320.218037
25-0.053116-0.45070.326777
260.1113730.9450.173902
270.0473380.40170.344556
28-0.106633-0.90480.184293
29-0.029136-0.24720.402719
30-0.023889-0.20270.419969
31-0.102988-0.87390.192545
32-0.031348-0.2660.395502
330.1530591.29880.099087
34-0.046062-0.39090.34853
350.0117860.10.460308
36-0.1196-1.01480.15679
37-0.058533-0.49670.310469
380.0141850.12040.452266
390.1594971.35340.090085
40-0.040287-0.34180.366731
41-0.013098-0.11110.455906
42-0.024823-0.21060.416885
43-0.003281-0.02780.488932
440.0880050.74670.228824
45-0.061793-0.52430.300829
46-0.001297-0.0110.495626
470.0783660.6650.254101
48-0.093812-0.7960.214318
49-0.010353-0.08780.465121
500.0146740.12450.450629
510.0807310.6850.247764
52-0.099908-0.84770.199694
53-0.024045-0.2040.419452
54-0.070891-0.60150.274689
55-0.096068-0.81520.208833
56-0.056227-0.47710.317367
570.0793640.67340.251417
58-0.080321-0.68150.248856
590.036040.30580.380315
60-0.086725-0.73590.232095


Parameters (Session):
par1 = 60 ; par2 = 1 ; par3 = 0 ; par4 = 1 ; par5 = 12 ; par6 = White Noise ; par7 = 0.95 ;
Parameters (R input):
par1 = 60 ; par2 = 1 ; par3 = 0 ; par4 = 1 ; par5 = 12 ; par6 = White Noise ; par7 = 0.95 ; par8 = ;
R code (references can be found in the software module):
if (par1 == 'Default') {
par1 = 10*log10(length(x))
} else {
par1 <- as.numeric(par1)
}
par2 <- as.numeric(par2)
par3 <- as.numeric(par3)
par4 <- as.numeric(par4)
par5 <- as.numeric(par5)
if (par6 == 'White Noise') par6 <- 'white' else par6 <- 'ma'
par7 <- as.numeric(par7)
if (par8 != '') par8 <- as.numeric(par8)
ox <- x
if (par8 == '') {
if (par2 == 0) {
x <- log(x)
} else {
x <- (x ^ par2 - 1) / par2
}
} else {
x <- log(x,base=par8)
}
if (par3 > 0) x <- diff(x,lag=1,difference=par3)
if (par4 > 0) x <- diff(x,lag=par5,difference=par4)
bitmap(file='picts.png')
op <- par(mfrow=c(2,1))
plot(ox,type='l',main='Original Time Series',xlab='time',ylab='value')
if (par8=='') {
mytitle <- paste('Working Time Series (lambda=',par2,', d=',par3,', D=',par4,')',sep='')
mysub <- paste('(lambda=',par2,', d=',par3,', D=',par4,', CI=', par7, ', CI type=',par6,')',sep='')
} else {
mytitle <- paste('Working Time Series (base=',par8,', d=',par3,', D=',par4,')',sep='')
mysub <- paste('(base=',par8,', d=',par3,', D=',par4,', CI=', par7, ', CI type=',par6,')',sep='')
}
plot(x,type='l', main=mytitle,xlab='time',ylab='value')
par(op)
dev.off()
bitmap(file='pic1.png')
racf <- acf(x, par1, main='Autocorrelation', xlab='time lag', ylab='ACF', ci.type=par6, ci=par7, sub=mysub)
dev.off()
bitmap(file='pic2.png')
rpacf <- pacf(x,par1,main='Partial Autocorrelation',xlab='lags',ylab='PACF',sub=mysub)
dev.off()
(myacf <- c(racf$acf))
(mypacf <- c(rpacf$acf))
lengthx <- length(x)
sqrtn <- sqrt(lengthx)
load(file='createtable')
a<-table.start()
a<-table.row.start(a)
a<-table.element(a,'Autocorrelation Function',4,TRUE)
a<-table.row.end(a)
a<-table.row.start(a)
a<-table.element(a,'Time lag k',header=TRUE)
a<-table.element(a,hyperlink('basics.htm','ACF(k)','click here for more information about the Autocorrelation Function'),header=TRUE)
a<-table.element(a,'T-STAT',header=TRUE)
a<-table.element(a,'P-value',header=TRUE)
a<-table.row.end(a)
for (i in 2:(par1+1)) {
a<-table.row.start(a)
a<-table.element(a,i-1,header=TRUE)
a<-table.element(a,round(myacf[i],6))
mytstat <- myacf[i]*sqrtn
a<-table.element(a,round(mytstat,4))
a<-table.element(a,round(1-pt(abs(mytstat),lengthx),6))
a<-table.row.end(a)
}
a<-table.end(a)
table.save(a,file='mytable.tab')
a<-table.start()
a<-table.row.start(a)
a<-table.element(a,'Partial Autocorrelation Function',4,TRUE)
a<-table.row.end(a)
a<-table.row.start(a)
a<-table.element(a,'Time lag k',header=TRUE)
a<-table.element(a,hyperlink('basics.htm','PACF(k)','click here for more information about the Partial Autocorrelation Function'),header=TRUE)
a<-table.element(a,'T-STAT',header=TRUE)
a<-table.element(a,'P-value',header=TRUE)
a<-table.row.end(a)
for (i in 1:par1) {
a<-table.row.start(a)
a<-table.element(a,i,header=TRUE)
a<-table.element(a,round(mypacf[i],6))
mytstat <- mypacf[i]*sqrtn
a<-table.element(a,round(mytstat,4))
a<-table.element(a,round(1-pt(abs(mytstat),lengthx),6))
a<-table.row.end(a)
}
a<-table.end(a)
table.save(a,file='mytable1.tab')