Free Statistics

of Irreproducible Research!

Author's title

Author*The author of this computation has been verified*
R Software Modulerwasp_smp.wasp
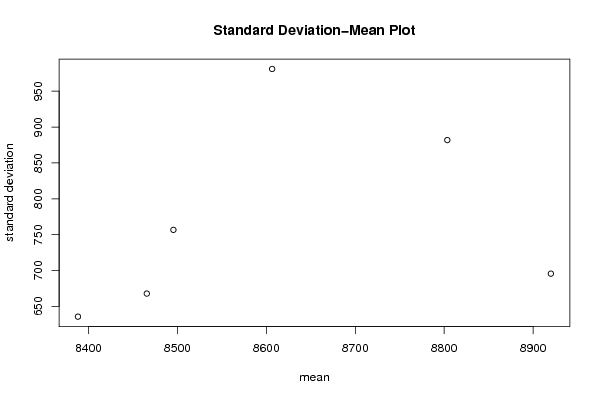
Title produced by softwareStandard Deviation-Mean Plot
Date of computationWed, 29 Dec 2010 08:49:57 +0000
Cite this page as followsStatistical Computations at FreeStatistics.org, Office for Research Development and Education, URL https://freestatistics.org/blog/index.php?v=date/2010/Dec/29/t12936125697hub0noykq9howk.htm/, Retrieved Fri, 03 May 2024 10:19:14 +0000
Statistical Computations at FreeStatistics.org, Office for Research Development and Education, URL https://freestatistics.org/blog/index.php?pk=116620, Retrieved Fri, 03 May 2024 10:19:14 +0000
QR Codes:

Original text written by user:
IsPrivate?No (this computation is public)
User-defined keywords
Estimated Impact149
Family? (F = Feedback message, R = changed R code, M = changed R Module, P = changed Parameters, D = changed Data)
-       [Standard Deviation-Mean Plot] [] [2010-12-29 08:49:57] [807767cb161ee2c684ed2293f773f12d] [Current]
Feedback Forum

Post a new message
Dataseries X:
11100
8962
9173
8738
8459
8078
8411
8291
7810
8616
8312
9692
9911
8915
9452
9112
8472
8230
8384
8625
8221
8649
8625
10443
10357
8586
8892
8329
8101
7922
8120
7838
7735
8406
8209
9451
10041
9411
10405
8467
8464
8102
7627
7513
7510
8291
8064
9383
9706
8579
9474
8318
8213
8059
9111
7708
7680
8014
8007
8718
9486
9113
9025
8476
7952
7759
7835
7600
7651
8319
8812
8630


Summary of computational transaction
Raw Inputview raw input (R code)
Raw Outputview raw output of R engine
Computing time1 seconds
R Server'Sir Ronald Aylmer Fisher' @ 193.190.124.24

\begin{tabular}{lllllllll}
\hline
Summary of computational transaction \tabularnewline
Raw Input & view raw input (R code)  \tabularnewline
Raw Output & view raw output of R engine  \tabularnewline
Computing time & 1 seconds \tabularnewline
R Server & 'Sir Ronald Aylmer Fisher' @ 193.190.124.24 \tabularnewline
\hline
\end{tabular}
%Source: https://freestatistics.org/blog/index.php?pk=116620&T=0

[TABLE]
[ROW][C]Summary of computational transaction[/C][/ROW]
[ROW][C]Raw Input[/C][C]view raw input (R code) [/C][/ROW]
[ROW][C]Raw Output[/C][C]view raw output of R engine [/C][/ROW]
[ROW][C]Computing time[/C][C]1 seconds[/C][/ROW]
[ROW][C]R Server[/C][C]'Sir Ronald Aylmer Fisher' @ 193.190.124.24[/C][/ROW]
[/TABLE]
Source: https://freestatistics.org/blog/index.php?pk=116620&T=0

Globally Unique Identifier (entire table): ba.freestatistics.org/blog/index.php?pk=116620&T=0

As an alternative you can also use a QR Code:  

The GUIDs for individual cells are displayed in the table below:

Summary of computational transaction
Raw Inputview raw input (R code)
Raw Outputview raw output of R engine
Computing time1 seconds
R Server'Sir Ronald Aylmer Fisher' @ 193.190.124.24


Standard Deviation-Mean Plot
SectionMeanStandard DeviationRange
18803.5881.87821257713290
28919.91666666667695.5517702885352222
38495.5756.6420433852342622
48606.5981.1020241637372895
58465.58333333333667.7551889908772026
68388.16666666667635.574304837521886

\begin{tabular}{lllllllll}
\hline
Standard Deviation-Mean Plot \tabularnewline
Section & Mean & Standard Deviation & Range \tabularnewline
1 & 8803.5 & 881.8782125771 & 3290 \tabularnewline
2 & 8919.91666666667 & 695.551770288535 & 2222 \tabularnewline
3 & 8495.5 & 756.642043385234 & 2622 \tabularnewline
4 & 8606.5 & 981.102024163737 & 2895 \tabularnewline
5 & 8465.58333333333 & 667.755188990877 & 2026 \tabularnewline
6 & 8388.16666666667 & 635.57430483752 & 1886 \tabularnewline
\hline
\end{tabular}
%Source: https://freestatistics.org/blog/index.php?pk=116620&T=1

[TABLE]
[ROW][C]Standard Deviation-Mean Plot[/C][/ROW]
[ROW][C]Section[/C][C]Mean[/C][C]Standard Deviation[/C][C]Range[/C][/ROW]
[ROW][C]1[/C][C]8803.5[/C][C]881.8782125771[/C][C]3290[/C][/ROW]
[ROW][C]2[/C][C]8919.91666666667[/C][C]695.551770288535[/C][C]2222[/C][/ROW]
[ROW][C]3[/C][C]8495.5[/C][C]756.642043385234[/C][C]2622[/C][/ROW]
[ROW][C]4[/C][C]8606.5[/C][C]981.102024163737[/C][C]2895[/C][/ROW]
[ROW][C]5[/C][C]8465.58333333333[/C][C]667.755188990877[/C][C]2026[/C][/ROW]
[ROW][C]6[/C][C]8388.16666666667[/C][C]635.57430483752[/C][C]1886[/C][/ROW]
[/TABLE]
Source: https://freestatistics.org/blog/index.php?pk=116620&T=1

Globally Unique Identifier (entire table): ba.freestatistics.org/blog/index.php?pk=116620&T=1

As an alternative you can also use a QR Code:  

The GUIDs for individual cells are displayed in the table below:

Standard Deviation-Mean Plot
SectionMeanStandard DeviationRange
18803.5881.87821257713290
28919.91666666667695.5517702885352222
38495.5756.6420433852342622
48606.5981.1020241637372895
58465.58333333333667.7551889908772026
68388.16666666667635.574304837521886


Regression: S.E.(k) = alpha + beta * Mean(k)
alpha-978.075142937463
beta0.2029242164354
S.D.0.308390750346229
T-STAT0.658010060961873
p-value0.546474932579603

\begin{tabular}{lllllllll}
\hline
Regression: S.E.(k) = alpha + beta * Mean(k) \tabularnewline
alpha & -978.075142937463 \tabularnewline
beta & 0.2029242164354 \tabularnewline
S.D. & 0.308390750346229 \tabularnewline
T-STAT & 0.658010060961873 \tabularnewline
p-value & 0.546474932579603 \tabularnewline
\hline
\end{tabular}
%Source: https://freestatistics.org/blog/index.php?pk=116620&T=2

[TABLE]
[ROW][C]Regression: S.E.(k) = alpha + beta * Mean(k)[/C][/ROW]
[ROW][C]alpha[/C][C]-978.075142937463[/C][/ROW]
[ROW][C]beta[/C][C]0.2029242164354[/C][/ROW]
[ROW][C]S.D.[/C][C]0.308390750346229[/C][/ROW]
[ROW][C]T-STAT[/C][C]0.658010060961873[/C][/ROW]
[ROW][C]p-value[/C][C]0.546474932579603[/C][/ROW]
[/TABLE]
Source: https://freestatistics.org/blog/index.php?pk=116620&T=2

Globally Unique Identifier (entire table): ba.freestatistics.org/blog/index.php?pk=116620&T=2

As an alternative you can also use a QR Code:  

The GUIDs for individual cells are displayed in the table below:

Regression: S.E.(k) = alpha + beta * Mean(k)
alpha-978.075142937463
beta0.2029242164354
S.D.0.308390750346229
T-STAT0.658010060961873
p-value0.546474932579603


Regression: ln S.E.(k) = alpha + beta * ln Mean(k)
alpha-15.2497807743878
beta2.41519022716162
S.D.3.3144335819838
T-STAT0.728688678599511
p-value0.506563124009854
Lambda-1.41519022716162

\begin{tabular}{lllllllll}
\hline
Regression: ln S.E.(k) = alpha + beta * ln Mean(k) \tabularnewline
alpha & -15.2497807743878 \tabularnewline
beta & 2.41519022716162 \tabularnewline
S.D. & 3.3144335819838 \tabularnewline
T-STAT & 0.728688678599511 \tabularnewline
p-value & 0.506563124009854 \tabularnewline
Lambda & -1.41519022716162 \tabularnewline
\hline
\end{tabular}
%Source: https://freestatistics.org/blog/index.php?pk=116620&T=3

[TABLE]
[ROW][C]Regression: ln S.E.(k) = alpha + beta * ln Mean(k)[/C][/ROW]
[ROW][C]alpha[/C][C]-15.2497807743878[/C][/ROW]
[ROW][C]beta[/C][C]2.41519022716162[/C][/ROW]
[ROW][C]S.D.[/C][C]3.3144335819838[/C][/ROW]
[ROW][C]T-STAT[/C][C]0.728688678599511[/C][/ROW]
[ROW][C]p-value[/C][C]0.506563124009854[/C][/ROW]
[ROW][C]Lambda[/C][C]-1.41519022716162[/C][/ROW]
[/TABLE]
Source: https://freestatistics.org/blog/index.php?pk=116620&T=3

Globally Unique Identifier (entire table): ba.freestatistics.org/blog/index.php?pk=116620&T=3

As an alternative you can also use a QR Code:  

The GUIDs for individual cells are displayed in the table below:

Regression: ln S.E.(k) = alpha + beta * ln Mean(k)
alpha-15.2497807743878
beta2.41519022716162
S.D.3.3144335819838
T-STAT0.728688678599511
p-value0.506563124009854
Lambda-1.41519022716162


Parameters (Session):
par1 = 12 ;
Parameters (R input):
par1 = 12 ;
R code (references can be found in the software module):
par1 <- as.numeric(par1)
(n <- length(x))
(np <- floor(n / par1))
arr <- array(NA,dim=c(par1,np))
j <- 0
k <- 1
for (i in 1:(np*par1))
{
j = j + 1
arr[j,k] <- x[i]
if (j == par1) {
j = 0
k=k+1
}
}
arr
arr.mean <- array(NA,dim=np)
arr.sd <- array(NA,dim=np)
arr.range <- array(NA,dim=np)
for (j in 1:np)
{
arr.mean[j] <- mean(arr[,j],na.rm=TRUE)
arr.sd[j] <- sd(arr[,j],na.rm=TRUE)
arr.range[j] <- max(arr[,j],na.rm=TRUE) - min(arr[,j],na.rm=TRUE)
}
arr.mean
arr.sd
arr.range
(lm1 <- lm(arr.sd~arr.mean))
(lnlm1 <- lm(log(arr.sd)~log(arr.mean)))
(lm2 <- lm(arr.range~arr.mean))
bitmap(file='test1.png')
plot(arr.mean,arr.sd,main='Standard Deviation-Mean Plot',xlab='mean',ylab='standard deviation')
dev.off()
bitmap(file='test2.png')
plot(arr.mean,arr.range,main='Range-Mean Plot',xlab='mean',ylab='range')
dev.off()
load(file='createtable')
a<-table.start()
a<-table.row.start(a)
a<-table.element(a,'Standard Deviation-Mean Plot',4,TRUE)
a<-table.row.end(a)
a<-table.row.start(a)
a<-table.element(a,'Section',header=TRUE)
a<-table.element(a,'Mean',header=TRUE)
a<-table.element(a,'Standard Deviation',header=TRUE)
a<-table.element(a,'Range',header=TRUE)
a<-table.row.end(a)
for (j in 1:np) {
a<-table.row.start(a)
a<-table.element(a,j,header=TRUE)
a<-table.element(a,arr.mean[j])
a<-table.element(a,arr.sd[j] )
a<-table.element(a,arr.range[j] )
a<-table.row.end(a)
}
a<-table.end(a)
table.save(a,file='mytable.tab')
a<-table.start()
a<-table.row.start(a)
a<-table.element(a,'Regression: S.E.(k) = alpha + beta * Mean(k)',2,TRUE)
a<-table.row.end(a)
a<-table.row.start(a)
a<-table.element(a,'alpha',header=TRUE)
a<-table.element(a,lm1$coefficients[[1]])
a<-table.row.end(a)
a<-table.row.start(a)
a<-table.element(a,'beta',header=TRUE)
a<-table.element(a,lm1$coefficients[[2]])
a<-table.row.end(a)
a<-table.row.start(a)
a<-table.element(a,'S.D.',header=TRUE)
a<-table.element(a,summary(lm1)$coefficients[2,2])
a<-table.row.end(a)
a<-table.row.start(a)
a<-table.element(a,'T-STAT',header=TRUE)
a<-table.element(a,summary(lm1)$coefficients[2,3])
a<-table.row.end(a)
a<-table.row.start(a)
a<-table.element(a,'p-value',header=TRUE)
a<-table.element(a,summary(lm1)$coefficients[2,4])
a<-table.row.end(a)
a<-table.end(a)
table.save(a,file='mytable1.tab')
a<-table.start()
a<-table.row.start(a)
a<-table.element(a,'Regression: ln S.E.(k) = alpha + beta * ln Mean(k)',2,TRUE)
a<-table.row.end(a)
a<-table.row.start(a)
a<-table.element(a,'alpha',header=TRUE)
a<-table.element(a,lnlm1$coefficients[[1]])
a<-table.row.end(a)
a<-table.row.start(a)
a<-table.element(a,'beta',header=TRUE)
a<-table.element(a,lnlm1$coefficients[[2]])
a<-table.row.end(a)
a<-table.row.start(a)
a<-table.element(a,'S.D.',header=TRUE)
a<-table.element(a,summary(lnlm1)$coefficients[2,2])
a<-table.row.end(a)
a<-table.row.start(a)
a<-table.element(a,'T-STAT',header=TRUE)
a<-table.element(a,summary(lnlm1)$coefficients[2,3])
a<-table.row.end(a)
a<-table.row.start(a)
a<-table.element(a,'p-value',header=TRUE)
a<-table.element(a,summary(lnlm1)$coefficients[2,4])
a<-table.row.end(a)
a<-table.row.start(a)
a<-table.element(a,'Lambda',header=TRUE)
a<-table.element(a,1-lnlm1$coefficients[[2]])
a<-table.row.end(a)
a<-table.end(a)
table.save(a,file='mytable2.tab')