Free Statistics

of Irreproducible Research!

Author's title

Author*The author of this computation has been verified*
R Software Modulerwasp_autocorrelation.wasp
Title produced by software(Partial) Autocorrelation Function
Date of computationWed, 29 Dec 2010 03:04:54 +0000
Cite this page as followsStatistical Computations at FreeStatistics.org, Office for Research Development and Education, URL https://freestatistics.org/blog/index.php?v=date/2010/Dec/29/t1293591763n35qpb806uxzi6j.htm/, Retrieved Fri, 03 May 2024 05:37:46 +0000
Statistical Computations at FreeStatistics.org, Office for Research Development and Education, URL https://freestatistics.org/blog/index.php?pk=116590, Retrieved Fri, 03 May 2024 05:37:46 +0000
QR Codes:

Original text written by user:
IsPrivate?No (this computation is public)
User-defined keywords
Estimated Impact159
Family? (F = Feedback message, R = changed R code, M = changed R Module, P = changed Parameters, D = changed Data)
-     [(Partial) Autocorrelation Function] [] [2010-12-22 14:59:16] [30ad580cd6d52fd70fb475df3c05f95d]
-   PD    [(Partial) Autocorrelation Function] [paper - ACF 01] [2010-12-29 03:04:54] [54d0a09f418287eaabab8ba43e4b06f8] [Current]
Feedback Forum

Post a new message
Dataseries X:
11974
10106
12069
11412
11180
10508
11288
10928
10199
11030
11234
13747
13912
12376
12264
11675
11271
10672
10933
10379
10187
10747
10970
12175
14200
11676
11258
10872
11148
10690
10684
11658
10178
10981
10773
11665
11359
10716
12928
12317
11641
10459
10953
10703
10703
11101
11334
13268
13145
12334
13153
11289
11374
10914
11299
11284
10694
11077
11104
12820
14915
11773
11608
11468
11511
11200
11164
10960
10667
11556
11372
12333
13102
11115
12572
11557
12059
11420
11185
11113
10706
11523
11391
12634
13469
11735
13281
11968
11623
11084
11509
11134
10438
11530
11491
13093
13106
11305
13113
12203
11309
11088
11234
11619
10942
11445
11291
13281
13726
11300
11983
11092
11093
10692
10786
11166
10553
11103
10969
12090
12544
12264
13783
11214
11453
10883
10381
10348
10024
10805
10796
11907
12261
11377
12689
11474
10992
10764
12164
10409
10398
10349
10865
11630
12221
10884
12019
11021
10799
10423
10484
10450
9906
11049
11281
12485
12849
11380
12079
11366
11328
10444
10854
10434
10137
10992
10906
12367
14371
11695
11546
10922
10670
10254
10573
10239
10253
11176
10719
11817


Summary of computational transaction
Raw Inputview raw input (R code)
Raw Outputview raw output of R engine
Computing time2 seconds
R Server'Sir Ronald Aylmer Fisher' @ 193.190.124.24

\begin{tabular}{lllllllll}
\hline
Summary of computational transaction \tabularnewline
Raw Input & view raw input (R code)  \tabularnewline
Raw Output & view raw output of R engine  \tabularnewline
Computing time & 2 seconds \tabularnewline
R Server & 'Sir Ronald Aylmer Fisher' @ 193.190.124.24 \tabularnewline
\hline
\end{tabular}
%Source: https://freestatistics.org/blog/index.php?pk=116590&T=0

[TABLE]
[ROW][C]Summary of computational transaction[/C][/ROW]
[ROW][C]Raw Input[/C][C]view raw input (R code) [/C][/ROW]
[ROW][C]Raw Output[/C][C]view raw output of R engine [/C][/ROW]
[ROW][C]Computing time[/C][C]2 seconds[/C][/ROW]
[ROW][C]R Server[/C][C]'Sir Ronald Aylmer Fisher' @ 193.190.124.24[/C][/ROW]
[/TABLE]
Source: https://freestatistics.org/blog/index.php?pk=116590&T=0

Globally Unique Identifier (entire table): ba.freestatistics.org/blog/index.php?pk=116590&T=0

As an alternative you can also use a QR Code:  

The GUIDs for individual cells are displayed in the table below:

Summary of computational transaction
Raw Inputview raw input (R code)
Raw Outputview raw output of R engine
Computing time2 seconds
R Server'Sir Ronald Aylmer Fisher' @ 193.190.124.24


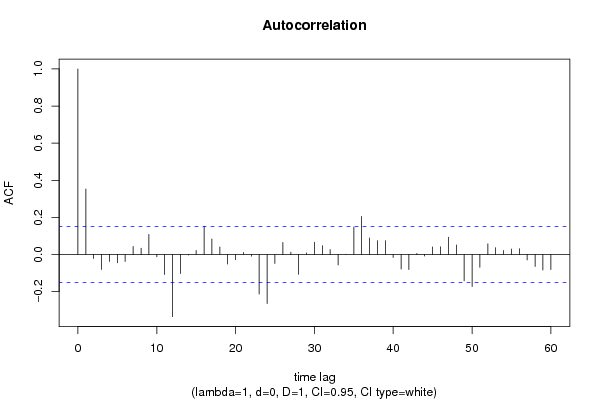
Autocorrelation Function
Time lag kACF(k)T-STATP-value
10.3531984.5785e-06
2-0.022089-0.28630.387498
3-0.0803-1.04080.14973
4-0.03724-0.48270.314973
5-0.044232-0.57330.283602
6-0.037277-0.48320.314802
70.043550.56450.286593
80.034140.44250.329345
90.1075591.39410.082561
10-0.012727-0.1650.434585
11-0.108447-1.40560.08084
12-0.33503-4.34251.2e-05
13-0.102532-1.3290.092831
14-0.003251-0.04210.483218
150.0215450.27930.390196
160.152151.97210.02512
170.0833611.08050.14074
180.0402210.52130.301416
19-0.050937-0.66020.255008
20-0.028087-0.3640.358142
210.0113010.14650.441858
22-0.008958-0.11610.453855
23-0.213274-2.76430.00317
24-0.264593-3.42950.00038
25-0.047897-0.62080.267782
260.0642880.83330.202937
270.0127240.16490.434601
28-0.106796-1.38420.084062
290.008030.10410.458612
300.0663720.86030.19543
310.0472520.61250.27053
320.0264660.3430.366001
33-0.0561-0.72710.234078
343.9e-055e-040.499801
350.1476891.91430.028643
360.2049112.65590.004335
370.0893261.15780.124295
380.073760.9560.170213
390.0747120.96840.167124
40-0.015823-0.20510.418876
41-0.078379-1.01590.155568
42-0.081367-1.05460.146553
430.0056050.07260.471086
44-0.008043-0.10420.458548
450.040410.52380.300562
460.0411430.53330.297276
470.0930511.20610.114741
480.0510330.66150.254611
49-0.142116-1.8420.033616
50-0.172196-2.23190.013471
51-0.068658-0.88990.187393
520.057350.74330.229157
530.0365930.47430.31795
540.0218050.28260.388907
550.0292310.37890.35263
560.0307770.39890.345231
57-0.029305-0.37980.352273
58-0.064286-0.83320.202947
59-0.08386-1.08690.139309
60-0.081445-1.05570.146322

\begin{tabular}{lllllllll}
\hline
Autocorrelation Function \tabularnewline
Time lag k & ACF(k) & T-STAT & P-value \tabularnewline
1 & 0.353198 & 4.578 & 5e-06 \tabularnewline
2 & -0.022089 & -0.2863 & 0.387498 \tabularnewline
3 & -0.0803 & -1.0408 & 0.14973 \tabularnewline
4 & -0.03724 & -0.4827 & 0.314973 \tabularnewline
5 & -0.044232 & -0.5733 & 0.283602 \tabularnewline
6 & -0.037277 & -0.4832 & 0.314802 \tabularnewline
7 & 0.04355 & 0.5645 & 0.286593 \tabularnewline
8 & 0.03414 & 0.4425 & 0.329345 \tabularnewline
9 & 0.107559 & 1.3941 & 0.082561 \tabularnewline
10 & -0.012727 & -0.165 & 0.434585 \tabularnewline
11 & -0.108447 & -1.4056 & 0.08084 \tabularnewline
12 & -0.33503 & -4.3425 & 1.2e-05 \tabularnewline
13 & -0.102532 & -1.329 & 0.092831 \tabularnewline
14 & -0.003251 & -0.0421 & 0.483218 \tabularnewline
15 & 0.021545 & 0.2793 & 0.390196 \tabularnewline
16 & 0.15215 & 1.9721 & 0.02512 \tabularnewline
17 & 0.083361 & 1.0805 & 0.14074 \tabularnewline
18 & 0.040221 & 0.5213 & 0.301416 \tabularnewline
19 & -0.050937 & -0.6602 & 0.255008 \tabularnewline
20 & -0.028087 & -0.364 & 0.358142 \tabularnewline
21 & 0.011301 & 0.1465 & 0.441858 \tabularnewline
22 & -0.008958 & -0.1161 & 0.453855 \tabularnewline
23 & -0.213274 & -2.7643 & 0.00317 \tabularnewline
24 & -0.264593 & -3.4295 & 0.00038 \tabularnewline
25 & -0.047897 & -0.6208 & 0.267782 \tabularnewline
26 & 0.064288 & 0.8333 & 0.202937 \tabularnewline
27 & 0.012724 & 0.1649 & 0.434601 \tabularnewline
28 & -0.106796 & -1.3842 & 0.084062 \tabularnewline
29 & 0.00803 & 0.1041 & 0.458612 \tabularnewline
30 & 0.066372 & 0.8603 & 0.19543 \tabularnewline
31 & 0.047252 & 0.6125 & 0.27053 \tabularnewline
32 & 0.026466 & 0.343 & 0.366001 \tabularnewline
33 & -0.0561 & -0.7271 & 0.234078 \tabularnewline
34 & 3.9e-05 & 5e-04 & 0.499801 \tabularnewline
35 & 0.147689 & 1.9143 & 0.028643 \tabularnewline
36 & 0.204911 & 2.6559 & 0.004335 \tabularnewline
37 & 0.089326 & 1.1578 & 0.124295 \tabularnewline
38 & 0.07376 & 0.956 & 0.170213 \tabularnewline
39 & 0.074712 & 0.9684 & 0.167124 \tabularnewline
40 & -0.015823 & -0.2051 & 0.418876 \tabularnewline
41 & -0.078379 & -1.0159 & 0.155568 \tabularnewline
42 & -0.081367 & -1.0546 & 0.146553 \tabularnewline
43 & 0.005605 & 0.0726 & 0.471086 \tabularnewline
44 & -0.008043 & -0.1042 & 0.458548 \tabularnewline
45 & 0.04041 & 0.5238 & 0.300562 \tabularnewline
46 & 0.041143 & 0.5333 & 0.297276 \tabularnewline
47 & 0.093051 & 1.2061 & 0.114741 \tabularnewline
48 & 0.051033 & 0.6615 & 0.254611 \tabularnewline
49 & -0.142116 & -1.842 & 0.033616 \tabularnewline
50 & -0.172196 & -2.2319 & 0.013471 \tabularnewline
51 & -0.068658 & -0.8899 & 0.187393 \tabularnewline
52 & 0.05735 & 0.7433 & 0.229157 \tabularnewline
53 & 0.036593 & 0.4743 & 0.31795 \tabularnewline
54 & 0.021805 & 0.2826 & 0.388907 \tabularnewline
55 & 0.029231 & 0.3789 & 0.35263 \tabularnewline
56 & 0.030777 & 0.3989 & 0.345231 \tabularnewline
57 & -0.029305 & -0.3798 & 0.352273 \tabularnewline
58 & -0.064286 & -0.8332 & 0.202947 \tabularnewline
59 & -0.08386 & -1.0869 & 0.139309 \tabularnewline
60 & -0.081445 & -1.0557 & 0.146322 \tabularnewline
\hline
\end{tabular}
%Source: https://freestatistics.org/blog/index.php?pk=116590&T=1

[TABLE]
[ROW][C]Autocorrelation Function[/C][/ROW]
[ROW][C]Time lag k[/C][C]ACF(k)[/C][C]T-STAT[/C][C]P-value[/C][/ROW]
[ROW][C]1[/C][C]0.353198[/C][C]4.578[/C][C]5e-06[/C][/ROW]
[ROW][C]2[/C][C]-0.022089[/C][C]-0.2863[/C][C]0.387498[/C][/ROW]
[ROW][C]3[/C][C]-0.0803[/C][C]-1.0408[/C][C]0.14973[/C][/ROW]
[ROW][C]4[/C][C]-0.03724[/C][C]-0.4827[/C][C]0.314973[/C][/ROW]
[ROW][C]5[/C][C]-0.044232[/C][C]-0.5733[/C][C]0.283602[/C][/ROW]
[ROW][C]6[/C][C]-0.037277[/C][C]-0.4832[/C][C]0.314802[/C][/ROW]
[ROW][C]7[/C][C]0.04355[/C][C]0.5645[/C][C]0.286593[/C][/ROW]
[ROW][C]8[/C][C]0.03414[/C][C]0.4425[/C][C]0.329345[/C][/ROW]
[ROW][C]9[/C][C]0.107559[/C][C]1.3941[/C][C]0.082561[/C][/ROW]
[ROW][C]10[/C][C]-0.012727[/C][C]-0.165[/C][C]0.434585[/C][/ROW]
[ROW][C]11[/C][C]-0.108447[/C][C]-1.4056[/C][C]0.08084[/C][/ROW]
[ROW][C]12[/C][C]-0.33503[/C][C]-4.3425[/C][C]1.2e-05[/C][/ROW]
[ROW][C]13[/C][C]-0.102532[/C][C]-1.329[/C][C]0.092831[/C][/ROW]
[ROW][C]14[/C][C]-0.003251[/C][C]-0.0421[/C][C]0.483218[/C][/ROW]
[ROW][C]15[/C][C]0.021545[/C][C]0.2793[/C][C]0.390196[/C][/ROW]
[ROW][C]16[/C][C]0.15215[/C][C]1.9721[/C][C]0.02512[/C][/ROW]
[ROW][C]17[/C][C]0.083361[/C][C]1.0805[/C][C]0.14074[/C][/ROW]
[ROW][C]18[/C][C]0.040221[/C][C]0.5213[/C][C]0.301416[/C][/ROW]
[ROW][C]19[/C][C]-0.050937[/C][C]-0.6602[/C][C]0.255008[/C][/ROW]
[ROW][C]20[/C][C]-0.028087[/C][C]-0.364[/C][C]0.358142[/C][/ROW]
[ROW][C]21[/C][C]0.011301[/C][C]0.1465[/C][C]0.441858[/C][/ROW]
[ROW][C]22[/C][C]-0.008958[/C][C]-0.1161[/C][C]0.453855[/C][/ROW]
[ROW][C]23[/C][C]-0.213274[/C][C]-2.7643[/C][C]0.00317[/C][/ROW]
[ROW][C]24[/C][C]-0.264593[/C][C]-3.4295[/C][C]0.00038[/C][/ROW]
[ROW][C]25[/C][C]-0.047897[/C][C]-0.6208[/C][C]0.267782[/C][/ROW]
[ROW][C]26[/C][C]0.064288[/C][C]0.8333[/C][C]0.202937[/C][/ROW]
[ROW][C]27[/C][C]0.012724[/C][C]0.1649[/C][C]0.434601[/C][/ROW]
[ROW][C]28[/C][C]-0.106796[/C][C]-1.3842[/C][C]0.084062[/C][/ROW]
[ROW][C]29[/C][C]0.00803[/C][C]0.1041[/C][C]0.458612[/C][/ROW]
[ROW][C]30[/C][C]0.066372[/C][C]0.8603[/C][C]0.19543[/C][/ROW]
[ROW][C]31[/C][C]0.047252[/C][C]0.6125[/C][C]0.27053[/C][/ROW]
[ROW][C]32[/C][C]0.026466[/C][C]0.343[/C][C]0.366001[/C][/ROW]
[ROW][C]33[/C][C]-0.0561[/C][C]-0.7271[/C][C]0.234078[/C][/ROW]
[ROW][C]34[/C][C]3.9e-05[/C][C]5e-04[/C][C]0.499801[/C][/ROW]
[ROW][C]35[/C][C]0.147689[/C][C]1.9143[/C][C]0.028643[/C][/ROW]
[ROW][C]36[/C][C]0.204911[/C][C]2.6559[/C][C]0.004335[/C][/ROW]
[ROW][C]37[/C][C]0.089326[/C][C]1.1578[/C][C]0.124295[/C][/ROW]
[ROW][C]38[/C][C]0.07376[/C][C]0.956[/C][C]0.170213[/C][/ROW]
[ROW][C]39[/C][C]0.074712[/C][C]0.9684[/C][C]0.167124[/C][/ROW]
[ROW][C]40[/C][C]-0.015823[/C][C]-0.2051[/C][C]0.418876[/C][/ROW]
[ROW][C]41[/C][C]-0.078379[/C][C]-1.0159[/C][C]0.155568[/C][/ROW]
[ROW][C]42[/C][C]-0.081367[/C][C]-1.0546[/C][C]0.146553[/C][/ROW]
[ROW][C]43[/C][C]0.005605[/C][C]0.0726[/C][C]0.471086[/C][/ROW]
[ROW][C]44[/C][C]-0.008043[/C][C]-0.1042[/C][C]0.458548[/C][/ROW]
[ROW][C]45[/C][C]0.04041[/C][C]0.5238[/C][C]0.300562[/C][/ROW]
[ROW][C]46[/C][C]0.041143[/C][C]0.5333[/C][C]0.297276[/C][/ROW]
[ROW][C]47[/C][C]0.093051[/C][C]1.2061[/C][C]0.114741[/C][/ROW]
[ROW][C]48[/C][C]0.051033[/C][C]0.6615[/C][C]0.254611[/C][/ROW]
[ROW][C]49[/C][C]-0.142116[/C][C]-1.842[/C][C]0.033616[/C][/ROW]
[ROW][C]50[/C][C]-0.172196[/C][C]-2.2319[/C][C]0.013471[/C][/ROW]
[ROW][C]51[/C][C]-0.068658[/C][C]-0.8899[/C][C]0.187393[/C][/ROW]
[ROW][C]52[/C][C]0.05735[/C][C]0.7433[/C][C]0.229157[/C][/ROW]
[ROW][C]53[/C][C]0.036593[/C][C]0.4743[/C][C]0.31795[/C][/ROW]
[ROW][C]54[/C][C]0.021805[/C][C]0.2826[/C][C]0.388907[/C][/ROW]
[ROW][C]55[/C][C]0.029231[/C][C]0.3789[/C][C]0.35263[/C][/ROW]
[ROW][C]56[/C][C]0.030777[/C][C]0.3989[/C][C]0.345231[/C][/ROW]
[ROW][C]57[/C][C]-0.029305[/C][C]-0.3798[/C][C]0.352273[/C][/ROW]
[ROW][C]58[/C][C]-0.064286[/C][C]-0.8332[/C][C]0.202947[/C][/ROW]
[ROW][C]59[/C][C]-0.08386[/C][C]-1.0869[/C][C]0.139309[/C][/ROW]
[ROW][C]60[/C][C]-0.081445[/C][C]-1.0557[/C][C]0.146322[/C][/ROW]
[/TABLE]
Source: https://freestatistics.org/blog/index.php?pk=116590&T=1

Globally Unique Identifier (entire table): ba.freestatistics.org/blog/index.php?pk=116590&T=1

As an alternative you can also use a QR Code:  

The GUIDs for individual cells are displayed in the table below:

Autocorrelation Function
Time lag kACF(k)T-STATP-value
10.3531984.5785e-06
2-0.022089-0.28630.387498
3-0.0803-1.04080.14973
4-0.03724-0.48270.314973
5-0.044232-0.57330.283602
6-0.037277-0.48320.314802
70.043550.56450.286593
80.034140.44250.329345
90.1075591.39410.082561
10-0.012727-0.1650.434585
11-0.108447-1.40560.08084
12-0.33503-4.34251.2e-05
13-0.102532-1.3290.092831
14-0.003251-0.04210.483218
150.0215450.27930.390196
160.152151.97210.02512
170.0833611.08050.14074
180.0402210.52130.301416
19-0.050937-0.66020.255008
20-0.028087-0.3640.358142
210.0113010.14650.441858
22-0.008958-0.11610.453855
23-0.213274-2.76430.00317
24-0.264593-3.42950.00038
25-0.047897-0.62080.267782
260.0642880.83330.202937
270.0127240.16490.434601
28-0.106796-1.38420.084062
290.008030.10410.458612
300.0663720.86030.19543
310.0472520.61250.27053
320.0264660.3430.366001
33-0.0561-0.72710.234078
343.9e-055e-040.499801
350.1476891.91430.028643
360.2049112.65590.004335
370.0893261.15780.124295
380.073760.9560.170213
390.0747120.96840.167124
40-0.015823-0.20510.418876
41-0.078379-1.01590.155568
42-0.081367-1.05460.146553
430.0056050.07260.471086
44-0.008043-0.10420.458548
450.040410.52380.300562
460.0411430.53330.297276
470.0930511.20610.114741
480.0510330.66150.254611
49-0.142116-1.8420.033616
50-0.172196-2.23190.013471
51-0.068658-0.88990.187393
520.057350.74330.229157
530.0365930.47430.31795
540.0218050.28260.388907
550.0292310.37890.35263
560.0307770.39890.345231
57-0.029305-0.37980.352273
58-0.064286-0.83320.202947
59-0.08386-1.08690.139309
60-0.081445-1.05570.146322


Partial Autocorrelation Function
Time lag kPACF(k)T-STATP-value
10.3531984.5785e-06
2-0.167766-2.17450.015533
3-0.014031-0.18190.427955
4-0.003447-0.04470.482209
5-0.048298-0.6260.266079
6-0.011134-0.14430.442713
70.064790.83980.201115
8-0.019451-0.25210.400629
90.123581.60180.055541
10-0.109036-1.41330.079714
11-0.059568-0.77210.220573
12-0.315013-4.0833.4e-05
130.1652322.14160.016832
14-0.113043-1.46520.072367
150.0573240.7430.229258
160.140481.82080.035206
17-0.055867-0.72410.234998
180.0299220.38780.349316
19-0.01968-0.25510.399484
20-0.010912-0.14140.443847
210.1280051.65910.049477
22-0.138545-1.79580.037165
23-0.264048-3.42250.00039
24-0.276915-3.58920.000217
250.1225621.58860.057017
260.005190.06730.473222
27-0.019844-0.25720.398668
280.0174850.22660.410493
290.0463460.60070.274422
300.0678250.87910.190297
310.0483160.62620.266003
320.0338890.43930.330521
33-0.021251-0.27540.391655
34-0.059328-0.7690.221492
35-0.021347-0.27670.39118
36-0.046751-0.6060.272677
370.1005621.30340.097105
380.1072151.38970.083236
390.0975661.26460.103884
40-0.00864-0.1120.455483
410.0051810.06720.473268
42-0.037544-0.48660.313577
430.0422830.5480.292194
44-0.006012-0.07790.468993
450.0136130.17640.43008
46-0.11062-1.43380.076745
470.0469420.60840.271859
48-0.038746-0.50220.308092
49-0.061868-0.80190.211872
500.020890.27080.393454
510.0028270.03660.485409
52-0.030587-0.39650.346136
530.0334990.43420.332354
54-0.038793-0.50280.307875
550.0971911.25970.104756
56-0.034526-0.44750.327543
57-0.018239-0.23640.406705
580.00570.07390.470597
590.0632390.81970.206781
60-0.019786-0.25650.398957

\begin{tabular}{lllllllll}
\hline
Partial Autocorrelation Function \tabularnewline
Time lag k & PACF(k) & T-STAT & P-value \tabularnewline
1 & 0.353198 & 4.578 & 5e-06 \tabularnewline
2 & -0.167766 & -2.1745 & 0.015533 \tabularnewline
3 & -0.014031 & -0.1819 & 0.427955 \tabularnewline
4 & -0.003447 & -0.0447 & 0.482209 \tabularnewline
5 & -0.048298 & -0.626 & 0.266079 \tabularnewline
6 & -0.011134 & -0.1443 & 0.442713 \tabularnewline
7 & 0.06479 & 0.8398 & 0.201115 \tabularnewline
8 & -0.019451 & -0.2521 & 0.400629 \tabularnewline
9 & 0.12358 & 1.6018 & 0.055541 \tabularnewline
10 & -0.109036 & -1.4133 & 0.079714 \tabularnewline
11 & -0.059568 & -0.7721 & 0.220573 \tabularnewline
12 & -0.315013 & -4.083 & 3.4e-05 \tabularnewline
13 & 0.165232 & 2.1416 & 0.016832 \tabularnewline
14 & -0.113043 & -1.4652 & 0.072367 \tabularnewline
15 & 0.057324 & 0.743 & 0.229258 \tabularnewline
16 & 0.14048 & 1.8208 & 0.035206 \tabularnewline
17 & -0.055867 & -0.7241 & 0.234998 \tabularnewline
18 & 0.029922 & 0.3878 & 0.349316 \tabularnewline
19 & -0.01968 & -0.2551 & 0.399484 \tabularnewline
20 & -0.010912 & -0.1414 & 0.443847 \tabularnewline
21 & 0.128005 & 1.6591 & 0.049477 \tabularnewline
22 & -0.138545 & -1.7958 & 0.037165 \tabularnewline
23 & -0.264048 & -3.4225 & 0.00039 \tabularnewline
24 & -0.276915 & -3.5892 & 0.000217 \tabularnewline
25 & 0.122562 & 1.5886 & 0.057017 \tabularnewline
26 & 0.00519 & 0.0673 & 0.473222 \tabularnewline
27 & -0.019844 & -0.2572 & 0.398668 \tabularnewline
28 & 0.017485 & 0.2266 & 0.410493 \tabularnewline
29 & 0.046346 & 0.6007 & 0.274422 \tabularnewline
30 & 0.067825 & 0.8791 & 0.190297 \tabularnewline
31 & 0.048316 & 0.6262 & 0.266003 \tabularnewline
32 & 0.033889 & 0.4393 & 0.330521 \tabularnewline
33 & -0.021251 & -0.2754 & 0.391655 \tabularnewline
34 & -0.059328 & -0.769 & 0.221492 \tabularnewline
35 & -0.021347 & -0.2767 & 0.39118 \tabularnewline
36 & -0.046751 & -0.606 & 0.272677 \tabularnewline
37 & 0.100562 & 1.3034 & 0.097105 \tabularnewline
38 & 0.107215 & 1.3897 & 0.083236 \tabularnewline
39 & 0.097566 & 1.2646 & 0.103884 \tabularnewline
40 & -0.00864 & -0.112 & 0.455483 \tabularnewline
41 & 0.005181 & 0.0672 & 0.473268 \tabularnewline
42 & -0.037544 & -0.4866 & 0.313577 \tabularnewline
43 & 0.042283 & 0.548 & 0.292194 \tabularnewline
44 & -0.006012 & -0.0779 & 0.468993 \tabularnewline
45 & 0.013613 & 0.1764 & 0.43008 \tabularnewline
46 & -0.11062 & -1.4338 & 0.076745 \tabularnewline
47 & 0.046942 & 0.6084 & 0.271859 \tabularnewline
48 & -0.038746 & -0.5022 & 0.308092 \tabularnewline
49 & -0.061868 & -0.8019 & 0.211872 \tabularnewline
50 & 0.02089 & 0.2708 & 0.393454 \tabularnewline
51 & 0.002827 & 0.0366 & 0.485409 \tabularnewline
52 & -0.030587 & -0.3965 & 0.346136 \tabularnewline
53 & 0.033499 & 0.4342 & 0.332354 \tabularnewline
54 & -0.038793 & -0.5028 & 0.307875 \tabularnewline
55 & 0.097191 & 1.2597 & 0.104756 \tabularnewline
56 & -0.034526 & -0.4475 & 0.327543 \tabularnewline
57 & -0.018239 & -0.2364 & 0.406705 \tabularnewline
58 & 0.0057 & 0.0739 & 0.470597 \tabularnewline
59 & 0.063239 & 0.8197 & 0.206781 \tabularnewline
60 & -0.019786 & -0.2565 & 0.398957 \tabularnewline
\hline
\end{tabular}
%Source: https://freestatistics.org/blog/index.php?pk=116590&T=2

[TABLE]
[ROW][C]Partial Autocorrelation Function[/C][/ROW]
[ROW][C]Time lag k[/C][C]PACF(k)[/C][C]T-STAT[/C][C]P-value[/C][/ROW]
[ROW][C]1[/C][C]0.353198[/C][C]4.578[/C][C]5e-06[/C][/ROW]
[ROW][C]2[/C][C]-0.167766[/C][C]-2.1745[/C][C]0.015533[/C][/ROW]
[ROW][C]3[/C][C]-0.014031[/C][C]-0.1819[/C][C]0.427955[/C][/ROW]
[ROW][C]4[/C][C]-0.003447[/C][C]-0.0447[/C][C]0.482209[/C][/ROW]
[ROW][C]5[/C][C]-0.048298[/C][C]-0.626[/C][C]0.266079[/C][/ROW]
[ROW][C]6[/C][C]-0.011134[/C][C]-0.1443[/C][C]0.442713[/C][/ROW]
[ROW][C]7[/C][C]0.06479[/C][C]0.8398[/C][C]0.201115[/C][/ROW]
[ROW][C]8[/C][C]-0.019451[/C][C]-0.2521[/C][C]0.400629[/C][/ROW]
[ROW][C]9[/C][C]0.12358[/C][C]1.6018[/C][C]0.055541[/C][/ROW]
[ROW][C]10[/C][C]-0.109036[/C][C]-1.4133[/C][C]0.079714[/C][/ROW]
[ROW][C]11[/C][C]-0.059568[/C][C]-0.7721[/C][C]0.220573[/C][/ROW]
[ROW][C]12[/C][C]-0.315013[/C][C]-4.083[/C][C]3.4e-05[/C][/ROW]
[ROW][C]13[/C][C]0.165232[/C][C]2.1416[/C][C]0.016832[/C][/ROW]
[ROW][C]14[/C][C]-0.113043[/C][C]-1.4652[/C][C]0.072367[/C][/ROW]
[ROW][C]15[/C][C]0.057324[/C][C]0.743[/C][C]0.229258[/C][/ROW]
[ROW][C]16[/C][C]0.14048[/C][C]1.8208[/C][C]0.035206[/C][/ROW]
[ROW][C]17[/C][C]-0.055867[/C][C]-0.7241[/C][C]0.234998[/C][/ROW]
[ROW][C]18[/C][C]0.029922[/C][C]0.3878[/C][C]0.349316[/C][/ROW]
[ROW][C]19[/C][C]-0.01968[/C][C]-0.2551[/C][C]0.399484[/C][/ROW]
[ROW][C]20[/C][C]-0.010912[/C][C]-0.1414[/C][C]0.443847[/C][/ROW]
[ROW][C]21[/C][C]0.128005[/C][C]1.6591[/C][C]0.049477[/C][/ROW]
[ROW][C]22[/C][C]-0.138545[/C][C]-1.7958[/C][C]0.037165[/C][/ROW]
[ROW][C]23[/C][C]-0.264048[/C][C]-3.4225[/C][C]0.00039[/C][/ROW]
[ROW][C]24[/C][C]-0.276915[/C][C]-3.5892[/C][C]0.000217[/C][/ROW]
[ROW][C]25[/C][C]0.122562[/C][C]1.5886[/C][C]0.057017[/C][/ROW]
[ROW][C]26[/C][C]0.00519[/C][C]0.0673[/C][C]0.473222[/C][/ROW]
[ROW][C]27[/C][C]-0.019844[/C][C]-0.2572[/C][C]0.398668[/C][/ROW]
[ROW][C]28[/C][C]0.017485[/C][C]0.2266[/C][C]0.410493[/C][/ROW]
[ROW][C]29[/C][C]0.046346[/C][C]0.6007[/C][C]0.274422[/C][/ROW]
[ROW][C]30[/C][C]0.067825[/C][C]0.8791[/C][C]0.190297[/C][/ROW]
[ROW][C]31[/C][C]0.048316[/C][C]0.6262[/C][C]0.266003[/C][/ROW]
[ROW][C]32[/C][C]0.033889[/C][C]0.4393[/C][C]0.330521[/C][/ROW]
[ROW][C]33[/C][C]-0.021251[/C][C]-0.2754[/C][C]0.391655[/C][/ROW]
[ROW][C]34[/C][C]-0.059328[/C][C]-0.769[/C][C]0.221492[/C][/ROW]
[ROW][C]35[/C][C]-0.021347[/C][C]-0.2767[/C][C]0.39118[/C][/ROW]
[ROW][C]36[/C][C]-0.046751[/C][C]-0.606[/C][C]0.272677[/C][/ROW]
[ROW][C]37[/C][C]0.100562[/C][C]1.3034[/C][C]0.097105[/C][/ROW]
[ROW][C]38[/C][C]0.107215[/C][C]1.3897[/C][C]0.083236[/C][/ROW]
[ROW][C]39[/C][C]0.097566[/C][C]1.2646[/C][C]0.103884[/C][/ROW]
[ROW][C]40[/C][C]-0.00864[/C][C]-0.112[/C][C]0.455483[/C][/ROW]
[ROW][C]41[/C][C]0.005181[/C][C]0.0672[/C][C]0.473268[/C][/ROW]
[ROW][C]42[/C][C]-0.037544[/C][C]-0.4866[/C][C]0.313577[/C][/ROW]
[ROW][C]43[/C][C]0.042283[/C][C]0.548[/C][C]0.292194[/C][/ROW]
[ROW][C]44[/C][C]-0.006012[/C][C]-0.0779[/C][C]0.468993[/C][/ROW]
[ROW][C]45[/C][C]0.013613[/C][C]0.1764[/C][C]0.43008[/C][/ROW]
[ROW][C]46[/C][C]-0.11062[/C][C]-1.4338[/C][C]0.076745[/C][/ROW]
[ROW][C]47[/C][C]0.046942[/C][C]0.6084[/C][C]0.271859[/C][/ROW]
[ROW][C]48[/C][C]-0.038746[/C][C]-0.5022[/C][C]0.308092[/C][/ROW]
[ROW][C]49[/C][C]-0.061868[/C][C]-0.8019[/C][C]0.211872[/C][/ROW]
[ROW][C]50[/C][C]0.02089[/C][C]0.2708[/C][C]0.393454[/C][/ROW]
[ROW][C]51[/C][C]0.002827[/C][C]0.0366[/C][C]0.485409[/C][/ROW]
[ROW][C]52[/C][C]-0.030587[/C][C]-0.3965[/C][C]0.346136[/C][/ROW]
[ROW][C]53[/C][C]0.033499[/C][C]0.4342[/C][C]0.332354[/C][/ROW]
[ROW][C]54[/C][C]-0.038793[/C][C]-0.5028[/C][C]0.307875[/C][/ROW]
[ROW][C]55[/C][C]0.097191[/C][C]1.2597[/C][C]0.104756[/C][/ROW]
[ROW][C]56[/C][C]-0.034526[/C][C]-0.4475[/C][C]0.327543[/C][/ROW]
[ROW][C]57[/C][C]-0.018239[/C][C]-0.2364[/C][C]0.406705[/C][/ROW]
[ROW][C]58[/C][C]0.0057[/C][C]0.0739[/C][C]0.470597[/C][/ROW]
[ROW][C]59[/C][C]0.063239[/C][C]0.8197[/C][C]0.206781[/C][/ROW]
[ROW][C]60[/C][C]-0.019786[/C][C]-0.2565[/C][C]0.398957[/C][/ROW]
[/TABLE]
Source: https://freestatistics.org/blog/index.php?pk=116590&T=2

Globally Unique Identifier (entire table): ba.freestatistics.org/blog/index.php?pk=116590&T=2

As an alternative you can also use a QR Code:  

The GUIDs for individual cells are displayed in the table below:

Partial Autocorrelation Function
Time lag kPACF(k)T-STATP-value
10.3531984.5785e-06
2-0.167766-2.17450.015533
3-0.014031-0.18190.427955
4-0.003447-0.04470.482209
5-0.048298-0.6260.266079
6-0.011134-0.14430.442713
70.064790.83980.201115
8-0.019451-0.25210.400629
90.123581.60180.055541
10-0.109036-1.41330.079714
11-0.059568-0.77210.220573
12-0.315013-4.0833.4e-05
130.1652322.14160.016832
14-0.113043-1.46520.072367
150.0573240.7430.229258
160.140481.82080.035206
17-0.055867-0.72410.234998
180.0299220.38780.349316
19-0.01968-0.25510.399484
20-0.010912-0.14140.443847
210.1280051.65910.049477
22-0.138545-1.79580.037165
23-0.264048-3.42250.00039
24-0.276915-3.58920.000217
250.1225621.58860.057017
260.005190.06730.473222
27-0.019844-0.25720.398668
280.0174850.22660.410493
290.0463460.60070.274422
300.0678250.87910.190297
310.0483160.62620.266003
320.0338890.43930.330521
33-0.021251-0.27540.391655
34-0.059328-0.7690.221492
35-0.021347-0.27670.39118
36-0.046751-0.6060.272677
370.1005621.30340.097105
380.1072151.38970.083236
390.0975661.26460.103884
40-0.00864-0.1120.455483
410.0051810.06720.473268
42-0.037544-0.48660.313577
430.0422830.5480.292194
44-0.006012-0.07790.468993
450.0136130.17640.43008
46-0.11062-1.43380.076745
470.0469420.60840.271859
48-0.038746-0.50220.308092
49-0.061868-0.80190.211872
500.020890.27080.393454
510.0028270.03660.485409
52-0.030587-0.39650.346136
530.0334990.43420.332354
54-0.038793-0.50280.307875
550.0971911.25970.104756
56-0.034526-0.44750.327543
57-0.018239-0.23640.406705
580.00570.07390.470597
590.0632390.81970.206781
60-0.019786-0.25650.398957


Parameters (Session):
par1 = 60 ; par2 = 1 ; par3 = 0 ; par4 = 1 ; par5 = 12 ; par6 = White Noise ; par7 = 0.95 ;
Parameters (R input):
par1 = 60 ; par2 = 1 ; par3 = 0 ; par4 = 1 ; par5 = 12 ; par6 = White Noise ; par7 = 0.95 ; par8 = ;
R code (references can be found in the software module):
if (par1 == 'Default') {
par1 = 10*log10(length(x))
} else {
par1 <- as.numeric(par1)
}
par2 <- as.numeric(par2)
par3 <- as.numeric(par3)
par4 <- as.numeric(par4)
par5 <- as.numeric(par5)
if (par6 == 'White Noise') par6 <- 'white' else par6 <- 'ma'
par7 <- as.numeric(par7)
if (par8 != '') par8 <- as.numeric(par8)
ox <- x
if (par8 == '') {
if (par2 == 0) {
x <- log(x)
} else {
x <- (x ^ par2 - 1) / par2
}
} else {
x <- log(x,base=par8)
}
if (par3 > 0) x <- diff(x,lag=1,difference=par3)
if (par4 > 0) x <- diff(x,lag=par5,difference=par4)
bitmap(file='picts.png')
op <- par(mfrow=c(2,1))
plot(ox,type='l',main='Original Time Series',xlab='time',ylab='value')
if (par8=='') {
mytitle <- paste('Working Time Series (lambda=',par2,', d=',par3,', D=',par4,')',sep='')
mysub <- paste('(lambda=',par2,', d=',par3,', D=',par4,', CI=', par7, ', CI type=',par6,')',sep='')
} else {
mytitle <- paste('Working Time Series (base=',par8,', d=',par3,', D=',par4,')',sep='')
mysub <- paste('(base=',par8,', d=',par3,', D=',par4,', CI=', par7, ', CI type=',par6,')',sep='')
}
plot(x,type='l', main=mytitle,xlab='time',ylab='value')
par(op)
dev.off()
bitmap(file='pic1.png')
racf <- acf(x, par1, main='Autocorrelation', xlab='time lag', ylab='ACF', ci.type=par6, ci=par7, sub=mysub)
dev.off()
bitmap(file='pic2.png')
rpacf <- pacf(x,par1,main='Partial Autocorrelation',xlab='lags',ylab='PACF',sub=mysub)
dev.off()
(myacf <- c(racf$acf))
(mypacf <- c(rpacf$acf))
lengthx <- length(x)
sqrtn <- sqrt(lengthx)
load(file='createtable')
a<-table.start()
a<-table.row.start(a)
a<-table.element(a,'Autocorrelation Function',4,TRUE)
a<-table.row.end(a)
a<-table.row.start(a)
a<-table.element(a,'Time lag k',header=TRUE)
a<-table.element(a,hyperlink('basics.htm','ACF(k)','click here for more information about the Autocorrelation Function'),header=TRUE)
a<-table.element(a,'T-STAT',header=TRUE)
a<-table.element(a,'P-value',header=TRUE)
a<-table.row.end(a)
for (i in 2:(par1+1)) {
a<-table.row.start(a)
a<-table.element(a,i-1,header=TRUE)
a<-table.element(a,round(myacf[i],6))
mytstat <- myacf[i]*sqrtn
a<-table.element(a,round(mytstat,4))
a<-table.element(a,round(1-pt(abs(mytstat),lengthx),6))
a<-table.row.end(a)
}
a<-table.end(a)
table.save(a,file='mytable.tab')
a<-table.start()
a<-table.row.start(a)
a<-table.element(a,'Partial Autocorrelation Function',4,TRUE)
a<-table.row.end(a)
a<-table.row.start(a)
a<-table.element(a,'Time lag k',header=TRUE)
a<-table.element(a,hyperlink('basics.htm','PACF(k)','click here for more information about the Partial Autocorrelation Function'),header=TRUE)
a<-table.element(a,'T-STAT',header=TRUE)
a<-table.element(a,'P-value',header=TRUE)
a<-table.row.end(a)
for (i in 1:par1) {
a<-table.row.start(a)
a<-table.element(a,i,header=TRUE)
a<-table.element(a,round(mypacf[i],6))
mytstat <- mypacf[i]*sqrtn
a<-table.element(a,round(mytstat,4))
a<-table.element(a,round(1-pt(abs(mytstat),lengthx),6))
a<-table.row.end(a)
}
a<-table.end(a)
table.save(a,file='mytable1.tab')