Free Statistics

of Irreproducible Research!

Author's title

Author*The author of this computation has been verified*
R Software Modulerwasp_regression_trees1.wasp
Title produced by softwareRecursive Partitioning (Regression Trees)
Date of computationTue, 28 Dec 2010 23:02:39 +0000
Cite this page as followsStatistical Computations at FreeStatistics.org, Office for Research Development and Education, URL https://freestatistics.org/blog/index.php?v=date/2010/Dec/29/t12935772502x9e0h4b39kr25o.htm/, Retrieved Fri, 03 May 2024 08:11:24 +0000
Statistical Computations at FreeStatistics.org, Office for Research Development and Education, URL https://freestatistics.org/blog/index.php?pk=116580, Retrieved Fri, 03 May 2024 08:11:24 +0000
QR Codes:

Original text written by user:
IsPrivate?No (this computation is public)
User-defined keywords
Estimated Impact182
Family? (F = Feedback message, R = changed R code, M = changed R Module, P = changed Parameters, D = changed Data)
-     [Recursive Partitioning (Regression Trees)] [] [2010-12-05 18:59:57] [b98453cac15ba1066b407e146608df68]
-   PD  [Recursive Partitioning (Regression Trees)] [WS 10 - recursive...] [2010-12-11 16:07:41] [033eb2749a430605d9b2be7c4aac4a0c]
-         [Recursive Partitioning (Regression Trees)] [] [2010-12-13 18:24:09] [d7b28a0391ab3b2ddc9f9fba95a43f33]
-           [Recursive Partitioning (Regression Trees)] [] [2010-12-21 19:07:11] [42a441ca3193af442aa2201743dfb347]
-   PD          [Recursive Partitioning (Regression Trees)] [] [2010-12-28 23:02:39] [c984196f1244e05baf3e7c2e52d47a33] [Current]
Feedback Forum

Post a new message
Dataseries X:
99	94,6
106,3	95,9
128,9	104,7
111,1	102,8
102,9	98,1
130	113,9
87	80,9
87,5	95,7
117,6	113,2
103,4	105,9
110,8	108,8
112,6	102,3
102,5	99
112,4	100,7
135,6	115,5
105,1	100,7
127,7	109,9
137	114,6
91	85,4
90,5	100,5
122,4	114,8
123,3	116,5
124,3	112,9
120	102
118,1	106
119	105,3
142,7	118,8
123,6	106,1
129,6	109,3
151,6	117,2
110,4	92,5
99,2	104,2
130,5	112,5
136,2	122,4
129,7	113,3
128	100
121,6	110,7
135,8	112,8
143,8	109,8
147,5	117,3
136,2	109,1
156,6	115,9
123,3	96
104,5	99,8
139,8	116,8
136,5	115,7
112,1	99,4
118,5	94,3
94,4	91
102,3	93,2
111,4	103,1
99,2	94,1
87,8	91,8
115,8	102,7
79,7	82,6
72,7	89,1
104,5	104,5
103	105,1
95,1	95,1
104,2	88,7
78,3	86,3


Summary of computational transaction
Raw Inputview raw input (R code)
Raw Outputview raw output of R engine
Computing time4 seconds
R Server'Sir Ronald Aylmer Fisher' @ 193.190.124.24
R Framework error message
The field 'Names of X columns' contains a hard return which cannot be interpreted.
Please, resubmit your request without hard returns in the 'Names of X columns'.

\begin{tabular}{lllllllll}
\hline
Summary of computational transaction \tabularnewline
Raw Input & view raw input (R code)  \tabularnewline
Raw Output & view raw output of R engine  \tabularnewline
Computing time & 4 seconds \tabularnewline
R Server & 'Sir Ronald Aylmer Fisher' @ 193.190.124.24 \tabularnewline
R Framework error message & 
The field 'Names of X columns' contains a hard return which cannot be interpreted.
Please, resubmit your request without hard returns in the 'Names of X columns'.
\tabularnewline \hline \end{tabular} %Source: https://freestatistics.org/blog/index.php?pk=116580&T=0

[TABLE]
[ROW][C]Summary of computational transaction[/C][/ROW]
[ROW][C]Raw Input[/C][C]view raw input (R code) [/C][/ROW]
[ROW][C]Raw Output[/C][C]view raw output of R engine [/C][/ROW]
[ROW][C]Computing time[/C][C]4 seconds[/C][/ROW]
[ROW][C]R Server[/C][C]'Sir Ronald Aylmer Fisher' @ 193.190.124.24[/C][/ROW]
[ROW][C]R Framework error message[/C][C]
The field 'Names of X columns' contains a hard return which cannot be interpreted.
Please, resubmit your request without hard returns in the 'Names of X columns'.
[/C][/ROW] [/TABLE] Source: https://freestatistics.org/blog/index.php?pk=116580&T=0

Globally Unique Identifier (entire table): ba.freestatistics.org/blog/index.php?pk=116580&T=0

As an alternative you can also use a QR Code:  

The GUIDs for individual cells are displayed in the table below:

Summary of computational transaction
Raw Inputview raw input (R code)
Raw Outputview raw output of R engine
Computing time4 seconds
R Server'Sir Ronald Aylmer Fisher' @ 193.190.124.24
R Framework error message
The field 'Names of X columns' contains a hard return which cannot be interpreted.
Please, resubmit your request without hard returns in the 'Names of X columns'.


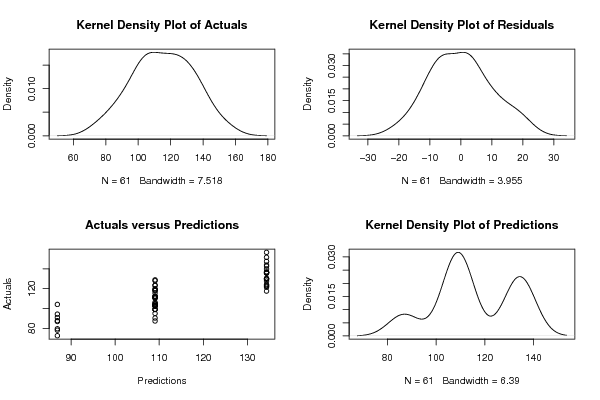
Goodness of Fit
Correlation0.8499
R-squared0.7224
RMSE9.9318

\begin{tabular}{lllllllll}
\hline
Goodness of Fit \tabularnewline
Correlation & 0.8499 \tabularnewline
R-squared & 0.7224 \tabularnewline
RMSE & 9.9318 \tabularnewline
\hline
\end{tabular}
%Source: https://freestatistics.org/blog/index.php?pk=116580&T=1

[TABLE]
[ROW][C]Goodness of Fit[/C][/ROW]
[ROW][C]Correlation[/C][C]0.8499[/C][/ROW]
[ROW][C]R-squared[/C][C]0.7224[/C][/ROW]
[ROW][C]RMSE[/C][C]9.9318[/C][/ROW]
[/TABLE]
Source: https://freestatistics.org/blog/index.php?pk=116580&T=1

Globally Unique Identifier (entire table): ba.freestatistics.org/blog/index.php?pk=116580&T=1

As an alternative you can also use a QR Code:  

The GUIDs for individual cells are displayed in the table below:

Goodness of Fit
Correlation0.8499
R-squared0.7224
RMSE9.9318


Actuals, Predictions, and Residuals
#ActualsForecastsResiduals
199109.064516129032-10.0645161290323
2106.3109.064516129032-2.76451612903226
3128.9109.06451612903219.8354838709677
4111.1109.0645161290322.03548387096774
5102.9109.064516129032-6.16451612903225
6130134.363636363636-4.36363636363637
78786.88750.112499999999997
887.5109.064516129032-21.5645161290323
9117.6134.363636363636-16.7636363636364
10103.4109.064516129032-5.66451612903225
11110.8109.0645161290321.73548387096774
12112.6109.0645161290323.53548387096774
13102.5109.064516129032-6.56451612903226
14112.4109.0645161290323.33548387096775
15135.6134.3636363636361.23636363636362
16105.1109.064516129032-3.96451612903226
17127.7134.363636363636-6.66363636363637
18137134.3636363636362.63636363636363
199186.88754.1125
2090.5109.064516129032-18.5645161290323
21122.4134.363636363636-11.9636363636364
22123.3134.363636363636-11.0636363636364
23124.3134.363636363636-10.0636363636364
24120109.06451612903210.9354838709677
25118.1109.0645161290329.03548387096774
26119109.0645161290329.93548387096774
27142.7134.3636363636368.33636363636361
28123.6109.06451612903214.5354838709677
29129.6134.363636363636-4.76363636363638
30151.6134.36363636363617.2363636363636
31110.4109.0645161290321.33548387096775
3299.2109.064516129032-9.86451612903225
33130.5134.363636363636-3.86363636363637
34136.2134.3636363636361.83636363636361
35129.7134.363636363636-4.66363636363639
36128109.06451612903218.9354838709677
37121.6134.363636363636-12.7636363636364
38135.8134.3636363636361.43636363636364
39143.8134.3636363636369.43636363636364
40147.5134.36363636363613.1363636363636
41136.2134.3636363636361.83636363636361
42156.6134.36363636363622.2363636363636
43123.3109.06451612903214.2354838709677
44104.5109.064516129032-4.56451612903226
45139.8134.3636363636365.43636363636364
46136.5134.3636363636362.13636363636363
47112.1109.0645161290323.03548387096774
48118.5109.0645161290329.43548387096774
4994.486.88757.5125
50102.3109.064516129032-6.76451612903226
51111.4109.0645161290322.33548387096775
5299.2109.064516129032-9.86451612903225
5387.886.88750.912499999999994
54115.8109.0645161290326.73548387096774
5579.786.8875-7.1875
5672.786.8875-14.1875
57104.5109.064516129032-4.56451612903226
58103109.064516129032-6.06451612903226
5995.1109.064516129032-13.9645161290323
60104.286.887517.3125
6178.386.8875-8.5875

\begin{tabular}{lllllllll}
\hline
Actuals, Predictions, and Residuals \tabularnewline
# & Actuals & Forecasts & Residuals \tabularnewline
1 & 99 & 109.064516129032 & -10.0645161290323 \tabularnewline
2 & 106.3 & 109.064516129032 & -2.76451612903226 \tabularnewline
3 & 128.9 & 109.064516129032 & 19.8354838709677 \tabularnewline
4 & 111.1 & 109.064516129032 & 2.03548387096774 \tabularnewline
5 & 102.9 & 109.064516129032 & -6.16451612903225 \tabularnewline
6 & 130 & 134.363636363636 & -4.36363636363637 \tabularnewline
7 & 87 & 86.8875 & 0.112499999999997 \tabularnewline
8 & 87.5 & 109.064516129032 & -21.5645161290323 \tabularnewline
9 & 117.6 & 134.363636363636 & -16.7636363636364 \tabularnewline
10 & 103.4 & 109.064516129032 & -5.66451612903225 \tabularnewline
11 & 110.8 & 109.064516129032 & 1.73548387096774 \tabularnewline
12 & 112.6 & 109.064516129032 & 3.53548387096774 \tabularnewline
13 & 102.5 & 109.064516129032 & -6.56451612903226 \tabularnewline
14 & 112.4 & 109.064516129032 & 3.33548387096775 \tabularnewline
15 & 135.6 & 134.363636363636 & 1.23636363636362 \tabularnewline
16 & 105.1 & 109.064516129032 & -3.96451612903226 \tabularnewline
17 & 127.7 & 134.363636363636 & -6.66363636363637 \tabularnewline
18 & 137 & 134.363636363636 & 2.63636363636363 \tabularnewline
19 & 91 & 86.8875 & 4.1125 \tabularnewline
20 & 90.5 & 109.064516129032 & -18.5645161290323 \tabularnewline
21 & 122.4 & 134.363636363636 & -11.9636363636364 \tabularnewline
22 & 123.3 & 134.363636363636 & -11.0636363636364 \tabularnewline
23 & 124.3 & 134.363636363636 & -10.0636363636364 \tabularnewline
24 & 120 & 109.064516129032 & 10.9354838709677 \tabularnewline
25 & 118.1 & 109.064516129032 & 9.03548387096774 \tabularnewline
26 & 119 & 109.064516129032 & 9.93548387096774 \tabularnewline
27 & 142.7 & 134.363636363636 & 8.33636363636361 \tabularnewline
28 & 123.6 & 109.064516129032 & 14.5354838709677 \tabularnewline
29 & 129.6 & 134.363636363636 & -4.76363636363638 \tabularnewline
30 & 151.6 & 134.363636363636 & 17.2363636363636 \tabularnewline
31 & 110.4 & 109.064516129032 & 1.33548387096775 \tabularnewline
32 & 99.2 & 109.064516129032 & -9.86451612903225 \tabularnewline
33 & 130.5 & 134.363636363636 & -3.86363636363637 \tabularnewline
34 & 136.2 & 134.363636363636 & 1.83636363636361 \tabularnewline
35 & 129.7 & 134.363636363636 & -4.66363636363639 \tabularnewline
36 & 128 & 109.064516129032 & 18.9354838709677 \tabularnewline
37 & 121.6 & 134.363636363636 & -12.7636363636364 \tabularnewline
38 & 135.8 & 134.363636363636 & 1.43636363636364 \tabularnewline
39 & 143.8 & 134.363636363636 & 9.43636363636364 \tabularnewline
40 & 147.5 & 134.363636363636 & 13.1363636363636 \tabularnewline
41 & 136.2 & 134.363636363636 & 1.83636363636361 \tabularnewline
42 & 156.6 & 134.363636363636 & 22.2363636363636 \tabularnewline
43 & 123.3 & 109.064516129032 & 14.2354838709677 \tabularnewline
44 & 104.5 & 109.064516129032 & -4.56451612903226 \tabularnewline
45 & 139.8 & 134.363636363636 & 5.43636363636364 \tabularnewline
46 & 136.5 & 134.363636363636 & 2.13636363636363 \tabularnewline
47 & 112.1 & 109.064516129032 & 3.03548387096774 \tabularnewline
48 & 118.5 & 109.064516129032 & 9.43548387096774 \tabularnewline
49 & 94.4 & 86.8875 & 7.5125 \tabularnewline
50 & 102.3 & 109.064516129032 & -6.76451612903226 \tabularnewline
51 & 111.4 & 109.064516129032 & 2.33548387096775 \tabularnewline
52 & 99.2 & 109.064516129032 & -9.86451612903225 \tabularnewline
53 & 87.8 & 86.8875 & 0.912499999999994 \tabularnewline
54 & 115.8 & 109.064516129032 & 6.73548387096774 \tabularnewline
55 & 79.7 & 86.8875 & -7.1875 \tabularnewline
56 & 72.7 & 86.8875 & -14.1875 \tabularnewline
57 & 104.5 & 109.064516129032 & -4.56451612903226 \tabularnewline
58 & 103 & 109.064516129032 & -6.06451612903226 \tabularnewline
59 & 95.1 & 109.064516129032 & -13.9645161290323 \tabularnewline
60 & 104.2 & 86.8875 & 17.3125 \tabularnewline
61 & 78.3 & 86.8875 & -8.5875 \tabularnewline
\hline
\end{tabular}
%Source: https://freestatistics.org/blog/index.php?pk=116580&T=2

[TABLE]
[ROW][C]Actuals, Predictions, and Residuals[/C][/ROW]
[ROW][C]#[/C][C]Actuals[/C][C]Forecasts[/C][C]Residuals[/C][/ROW]
[ROW][C]1[/C][C]99[/C][C]109.064516129032[/C][C]-10.0645161290323[/C][/ROW]
[ROW][C]2[/C][C]106.3[/C][C]109.064516129032[/C][C]-2.76451612903226[/C][/ROW]
[ROW][C]3[/C][C]128.9[/C][C]109.064516129032[/C][C]19.8354838709677[/C][/ROW]
[ROW][C]4[/C][C]111.1[/C][C]109.064516129032[/C][C]2.03548387096774[/C][/ROW]
[ROW][C]5[/C][C]102.9[/C][C]109.064516129032[/C][C]-6.16451612903225[/C][/ROW]
[ROW][C]6[/C][C]130[/C][C]134.363636363636[/C][C]-4.36363636363637[/C][/ROW]
[ROW][C]7[/C][C]87[/C][C]86.8875[/C][C]0.112499999999997[/C][/ROW]
[ROW][C]8[/C][C]87.5[/C][C]109.064516129032[/C][C]-21.5645161290323[/C][/ROW]
[ROW][C]9[/C][C]117.6[/C][C]134.363636363636[/C][C]-16.7636363636364[/C][/ROW]
[ROW][C]10[/C][C]103.4[/C][C]109.064516129032[/C][C]-5.66451612903225[/C][/ROW]
[ROW][C]11[/C][C]110.8[/C][C]109.064516129032[/C][C]1.73548387096774[/C][/ROW]
[ROW][C]12[/C][C]112.6[/C][C]109.064516129032[/C][C]3.53548387096774[/C][/ROW]
[ROW][C]13[/C][C]102.5[/C][C]109.064516129032[/C][C]-6.56451612903226[/C][/ROW]
[ROW][C]14[/C][C]112.4[/C][C]109.064516129032[/C][C]3.33548387096775[/C][/ROW]
[ROW][C]15[/C][C]135.6[/C][C]134.363636363636[/C][C]1.23636363636362[/C][/ROW]
[ROW][C]16[/C][C]105.1[/C][C]109.064516129032[/C][C]-3.96451612903226[/C][/ROW]
[ROW][C]17[/C][C]127.7[/C][C]134.363636363636[/C][C]-6.66363636363637[/C][/ROW]
[ROW][C]18[/C][C]137[/C][C]134.363636363636[/C][C]2.63636363636363[/C][/ROW]
[ROW][C]19[/C][C]91[/C][C]86.8875[/C][C]4.1125[/C][/ROW]
[ROW][C]20[/C][C]90.5[/C][C]109.064516129032[/C][C]-18.5645161290323[/C][/ROW]
[ROW][C]21[/C][C]122.4[/C][C]134.363636363636[/C][C]-11.9636363636364[/C][/ROW]
[ROW][C]22[/C][C]123.3[/C][C]134.363636363636[/C][C]-11.0636363636364[/C][/ROW]
[ROW][C]23[/C][C]124.3[/C][C]134.363636363636[/C][C]-10.0636363636364[/C][/ROW]
[ROW][C]24[/C][C]120[/C][C]109.064516129032[/C][C]10.9354838709677[/C][/ROW]
[ROW][C]25[/C][C]118.1[/C][C]109.064516129032[/C][C]9.03548387096774[/C][/ROW]
[ROW][C]26[/C][C]119[/C][C]109.064516129032[/C][C]9.93548387096774[/C][/ROW]
[ROW][C]27[/C][C]142.7[/C][C]134.363636363636[/C][C]8.33636363636361[/C][/ROW]
[ROW][C]28[/C][C]123.6[/C][C]109.064516129032[/C][C]14.5354838709677[/C][/ROW]
[ROW][C]29[/C][C]129.6[/C][C]134.363636363636[/C][C]-4.76363636363638[/C][/ROW]
[ROW][C]30[/C][C]151.6[/C][C]134.363636363636[/C][C]17.2363636363636[/C][/ROW]
[ROW][C]31[/C][C]110.4[/C][C]109.064516129032[/C][C]1.33548387096775[/C][/ROW]
[ROW][C]32[/C][C]99.2[/C][C]109.064516129032[/C][C]-9.86451612903225[/C][/ROW]
[ROW][C]33[/C][C]130.5[/C][C]134.363636363636[/C][C]-3.86363636363637[/C][/ROW]
[ROW][C]34[/C][C]136.2[/C][C]134.363636363636[/C][C]1.83636363636361[/C][/ROW]
[ROW][C]35[/C][C]129.7[/C][C]134.363636363636[/C][C]-4.66363636363639[/C][/ROW]
[ROW][C]36[/C][C]128[/C][C]109.064516129032[/C][C]18.9354838709677[/C][/ROW]
[ROW][C]37[/C][C]121.6[/C][C]134.363636363636[/C][C]-12.7636363636364[/C][/ROW]
[ROW][C]38[/C][C]135.8[/C][C]134.363636363636[/C][C]1.43636363636364[/C][/ROW]
[ROW][C]39[/C][C]143.8[/C][C]134.363636363636[/C][C]9.43636363636364[/C][/ROW]
[ROW][C]40[/C][C]147.5[/C][C]134.363636363636[/C][C]13.1363636363636[/C][/ROW]
[ROW][C]41[/C][C]136.2[/C][C]134.363636363636[/C][C]1.83636363636361[/C][/ROW]
[ROW][C]42[/C][C]156.6[/C][C]134.363636363636[/C][C]22.2363636363636[/C][/ROW]
[ROW][C]43[/C][C]123.3[/C][C]109.064516129032[/C][C]14.2354838709677[/C][/ROW]
[ROW][C]44[/C][C]104.5[/C][C]109.064516129032[/C][C]-4.56451612903226[/C][/ROW]
[ROW][C]45[/C][C]139.8[/C][C]134.363636363636[/C][C]5.43636363636364[/C][/ROW]
[ROW][C]46[/C][C]136.5[/C][C]134.363636363636[/C][C]2.13636363636363[/C][/ROW]
[ROW][C]47[/C][C]112.1[/C][C]109.064516129032[/C][C]3.03548387096774[/C][/ROW]
[ROW][C]48[/C][C]118.5[/C][C]109.064516129032[/C][C]9.43548387096774[/C][/ROW]
[ROW][C]49[/C][C]94.4[/C][C]86.8875[/C][C]7.5125[/C][/ROW]
[ROW][C]50[/C][C]102.3[/C][C]109.064516129032[/C][C]-6.76451612903226[/C][/ROW]
[ROW][C]51[/C][C]111.4[/C][C]109.064516129032[/C][C]2.33548387096775[/C][/ROW]
[ROW][C]52[/C][C]99.2[/C][C]109.064516129032[/C][C]-9.86451612903225[/C][/ROW]
[ROW][C]53[/C][C]87.8[/C][C]86.8875[/C][C]0.912499999999994[/C][/ROW]
[ROW][C]54[/C][C]115.8[/C][C]109.064516129032[/C][C]6.73548387096774[/C][/ROW]
[ROW][C]55[/C][C]79.7[/C][C]86.8875[/C][C]-7.1875[/C][/ROW]
[ROW][C]56[/C][C]72.7[/C][C]86.8875[/C][C]-14.1875[/C][/ROW]
[ROW][C]57[/C][C]104.5[/C][C]109.064516129032[/C][C]-4.56451612903226[/C][/ROW]
[ROW][C]58[/C][C]103[/C][C]109.064516129032[/C][C]-6.06451612903226[/C][/ROW]
[ROW][C]59[/C][C]95.1[/C][C]109.064516129032[/C][C]-13.9645161290323[/C][/ROW]
[ROW][C]60[/C][C]104.2[/C][C]86.8875[/C][C]17.3125[/C][/ROW]
[ROW][C]61[/C][C]78.3[/C][C]86.8875[/C][C]-8.5875[/C][/ROW]
[/TABLE]
Source: https://freestatistics.org/blog/index.php?pk=116580&T=2

Globally Unique Identifier (entire table): ba.freestatistics.org/blog/index.php?pk=116580&T=2

As an alternative you can also use a QR Code:  

The GUIDs for individual cells are displayed in the table below:

Actuals, Predictions, and Residuals
#ActualsForecastsResiduals
199109.064516129032-10.0645161290323
2106.3109.064516129032-2.76451612903226
3128.9109.06451612903219.8354838709677
4111.1109.0645161290322.03548387096774
5102.9109.064516129032-6.16451612903225
6130134.363636363636-4.36363636363637
78786.88750.112499999999997
887.5109.064516129032-21.5645161290323
9117.6134.363636363636-16.7636363636364
10103.4109.064516129032-5.66451612903225
11110.8109.0645161290321.73548387096774
12112.6109.0645161290323.53548387096774
13102.5109.064516129032-6.56451612903226
14112.4109.0645161290323.33548387096775
15135.6134.3636363636361.23636363636362
16105.1109.064516129032-3.96451612903226
17127.7134.363636363636-6.66363636363637
18137134.3636363636362.63636363636363
199186.88754.1125
2090.5109.064516129032-18.5645161290323
21122.4134.363636363636-11.9636363636364
22123.3134.363636363636-11.0636363636364
23124.3134.363636363636-10.0636363636364
24120109.06451612903210.9354838709677
25118.1109.0645161290329.03548387096774
26119109.0645161290329.93548387096774
27142.7134.3636363636368.33636363636361
28123.6109.06451612903214.5354838709677
29129.6134.363636363636-4.76363636363638
30151.6134.36363636363617.2363636363636
31110.4109.0645161290321.33548387096775
3299.2109.064516129032-9.86451612903225
33130.5134.363636363636-3.86363636363637
34136.2134.3636363636361.83636363636361
35129.7134.363636363636-4.66363636363639
36128109.06451612903218.9354838709677
37121.6134.363636363636-12.7636363636364
38135.8134.3636363636361.43636363636364
39143.8134.3636363636369.43636363636364
40147.5134.36363636363613.1363636363636
41136.2134.3636363636361.83636363636361
42156.6134.36363636363622.2363636363636
43123.3109.06451612903214.2354838709677
44104.5109.064516129032-4.56451612903226
45139.8134.3636363636365.43636363636364
46136.5134.3636363636362.13636363636363
47112.1109.0645161290323.03548387096774
48118.5109.0645161290329.43548387096774
4994.486.88757.5125
50102.3109.064516129032-6.76451612903226
51111.4109.0645161290322.33548387096775
5299.2109.064516129032-9.86451612903225
5387.886.88750.912499999999994
54115.8109.0645161290326.73548387096774
5579.786.8875-7.1875
5672.786.8875-14.1875
57104.5109.064516129032-4.56451612903226
58103109.064516129032-6.06451612903226
5995.1109.064516129032-13.9645161290323
60104.286.887517.3125
6178.386.8875-8.5875


Parameters (Session):
par1 = 1 ; par2 = none ; par4 = no ;
Parameters (R input):
par1 = 1 ; par2 = none ; par3 = ; par4 = no ;
R code (references can be found in the software module):
library(party)
library(Hmisc)
par1 <- as.numeric(par1)
par3 <- as.numeric(par3)
x <- data.frame(t(y))
is.data.frame(x)
x <- x[!is.na(x[,par1]),]
k <- length(x[1,])
n <- length(x[,1])
colnames(x)[par1]
x[,par1]
if (par2 == 'kmeans') {
cl <- kmeans(x[,par1], par3)
print(cl)
clm <- matrix(cbind(cl$centers,1:par3),ncol=2)
clm <- clm[sort.list(clm[,1]),]
for (i in 1:par3) {
cl$cluster[cl$cluster==clm[i,2]] <- paste('C',i,sep='')
}
cl$cluster <- as.factor(cl$cluster)
print(cl$cluster)
x[,par1] <- cl$cluster
}
if (par2 == 'quantiles') {
x[,par1] <- cut2(x[,par1],g=par3)
}
if (par2 == 'hclust') {
hc <- hclust(dist(x[,par1])^2, 'cen')
print(hc)
memb <- cutree(hc, k = par3)
dum <- c(mean(x[memb==1,par1]))
for (i in 2:par3) {
dum <- c(dum, mean(x[memb==i,par1]))
}
hcm <- matrix(cbind(dum,1:par3),ncol=2)
hcm <- hcm[sort.list(hcm[,1]),]
for (i in 1:par3) {
memb[memb==hcm[i,2]] <- paste('C',i,sep='')
}
memb <- as.factor(memb)
print(memb)
x[,par1] <- memb
}
if (par2=='equal') {
ed <- cut(as.numeric(x[,par1]),par3,labels=paste('C',1:par3,sep=''))
x[,par1] <- as.factor(ed)
}
table(x[,par1])
colnames(x)
colnames(x)[par1]
x[,par1]
if (par2 == 'none') {
m <- ctree(as.formula(paste(colnames(x)[par1],' ~ .',sep='')),data = x)
}
load(file='createtable')
if (par2 != 'none') {
m <- ctree(as.formula(paste('as.factor(',colnames(x)[par1],') ~ .',sep='')),data = x)
if (par4=='yes') {
a<-table.start()
a<-table.row.start(a)
a<-table.element(a,'10-Fold Cross Validation',3+2*par3,TRUE)
a<-table.row.end(a)
a<-table.row.start(a)
a<-table.element(a,'',1,TRUE)
a<-table.element(a,'Prediction (training)',par3+1,TRUE)
a<-table.element(a,'Prediction (testing)',par3+1,TRUE)
a<-table.row.end(a)
a<-table.row.start(a)
a<-table.element(a,'Actual',1,TRUE)
for (jjj in 1:par3) a<-table.element(a,paste('C',jjj,sep=''),1,TRUE)
a<-table.element(a,'CV',1,TRUE)
for (jjj in 1:par3) a<-table.element(a,paste('C',jjj,sep=''),1,TRUE)
a<-table.element(a,'CV',1,TRUE)
a<-table.row.end(a)
for (i in 1:10) {
ind <- sample(2, nrow(x), replace=T, prob=c(0.9,0.1))
m.ct <- ctree(as.formula(paste('as.factor(',colnames(x)[par1],') ~ .',sep='')),data =x[ind==1,])
if (i==1) {
m.ct.i.pred <- predict(m.ct, newdata=x[ind==1,])
m.ct.i.actu <- x[ind==1,par1]
m.ct.x.pred <- predict(m.ct, newdata=x[ind==2,])
m.ct.x.actu <- x[ind==2,par1]
} else {
m.ct.i.pred <- c(m.ct.i.pred,predict(m.ct, newdata=x[ind==1,]))
m.ct.i.actu <- c(m.ct.i.actu,x[ind==1,par1])
m.ct.x.pred <- c(m.ct.x.pred,predict(m.ct, newdata=x[ind==2,]))
m.ct.x.actu <- c(m.ct.x.actu,x[ind==2,par1])
}
}
print(m.ct.i.tab <- table(m.ct.i.actu,m.ct.i.pred))
numer <- 0
for (i in 1:par3) {
print(m.ct.i.tab[i,i] / sum(m.ct.i.tab[i,]))
numer <- numer + m.ct.i.tab[i,i]
}
print(m.ct.i.cp <- numer / sum(m.ct.i.tab))
print(m.ct.x.tab <- table(m.ct.x.actu,m.ct.x.pred))
numer <- 0
for (i in 1:par3) {
print(m.ct.x.tab[i,i] / sum(m.ct.x.tab[i,]))
numer <- numer + m.ct.x.tab[i,i]
}
print(m.ct.x.cp <- numer / sum(m.ct.x.tab))
for (i in 1:par3) {
a<-table.row.start(a)
a<-table.element(a,paste('C',i,sep=''),1,TRUE)
for (jjj in 1:par3) a<-table.element(a,m.ct.i.tab[i,jjj])
a<-table.element(a,round(m.ct.i.tab[i,i]/sum(m.ct.i.tab[i,]),4))
for (jjj in 1:par3) a<-table.element(a,m.ct.x.tab[i,jjj])
a<-table.element(a,round(m.ct.x.tab[i,i]/sum(m.ct.x.tab[i,]),4))
a<-table.row.end(a)
}
a<-table.row.start(a)
a<-table.element(a,'Overall',1,TRUE)
for (jjj in 1:par3) a<-table.element(a,'-')
a<-table.element(a,round(m.ct.i.cp,4))
for (jjj in 1:par3) a<-table.element(a,'-')
a<-table.element(a,round(m.ct.x.cp,4))
a<-table.row.end(a)
a<-table.end(a)
table.save(a,file='mytable3.tab')
}
}
m
bitmap(file='test1.png')
plot(m)
dev.off()
bitmap(file='test1a.png')
plot(x[,par1] ~ as.factor(where(m)),main='Response by Terminal Node',xlab='Terminal Node',ylab='Response')
dev.off()
if (par2 == 'none') {
forec <- predict(m)
result <- as.data.frame(cbind(x[,par1],forec,x[,par1]-forec))
colnames(result) <- c('Actuals','Forecasts','Residuals')
print(result)
}
if (par2 != 'none') {
print(cbind(as.factor(x[,par1]),predict(m)))
myt <- table(as.factor(x[,par1]),predict(m))
print(myt)
}
bitmap(file='test2.png')
if(par2=='none') {
op <- par(mfrow=c(2,2))
plot(density(result$Actuals),main='Kernel Density Plot of Actuals')
plot(density(result$Residuals),main='Kernel Density Plot of Residuals')
plot(result$Forecasts,result$Actuals,main='Actuals versus Predictions',xlab='Predictions',ylab='Actuals')
plot(density(result$Forecasts),main='Kernel Density Plot of Predictions')
par(op)
}
if(par2!='none') {
plot(myt,main='Confusion Matrix',xlab='Actual',ylab='Predicted')
}
dev.off()
if (par2 == 'none') {
detcoef <- cor(result$Forecasts,result$Actuals)
a<-table.start()
a<-table.row.start(a)
a<-table.element(a,'Goodness of Fit',2,TRUE)
a<-table.row.end(a)
a<-table.row.start(a)
a<-table.element(a,'Correlation',1,TRUE)
a<-table.element(a,round(detcoef,4))
a<-table.row.end(a)
a<-table.row.start(a)
a<-table.element(a,'R-squared',1,TRUE)
a<-table.element(a,round(detcoef*detcoef,4))
a<-table.row.end(a)
a<-table.row.start(a)
a<-table.element(a,'RMSE',1,TRUE)
a<-table.element(a,round(sqrt(mean((result$Residuals)^2)),4))
a<-table.row.end(a)
a<-table.end(a)
table.save(a,file='mytable1.tab')
a<-table.start()
a<-table.row.start(a)
a<-table.element(a,'Actuals, Predictions, and Residuals',4,TRUE)
a<-table.row.end(a)
a<-table.row.start(a)
a<-table.element(a,'#',header=TRUE)
a<-table.element(a,'Actuals',header=TRUE)
a<-table.element(a,'Forecasts',header=TRUE)
a<-table.element(a,'Residuals',header=TRUE)
a<-table.row.end(a)
for (i in 1:length(result$Actuals)) {
a<-table.row.start(a)
a<-table.element(a,i,header=TRUE)
a<-table.element(a,result$Actuals[i])
a<-table.element(a,result$Forecasts[i])
a<-table.element(a,result$Residuals[i])
a<-table.row.end(a)
}
a<-table.end(a)
table.save(a,file='mytable.tab')
}
if (par2 != 'none') {
a<-table.start()
a<-table.row.start(a)
a<-table.element(a,'Confusion Matrix (predicted in columns / actuals in rows)',par3+1,TRUE)
a<-table.row.end(a)
a<-table.row.start(a)
a<-table.element(a,'',1,TRUE)
for (i in 1:par3) {
a<-table.element(a,paste('C',i,sep=''),1,TRUE)
}
a<-table.row.end(a)
for (i in 1:par3) {
a<-table.row.start(a)
a<-table.element(a,paste('C',i,sep=''),1,TRUE)
for (j in 1:par3) {
a<-table.element(a,myt[i,j])
}
a<-table.row.end(a)
}
a<-table.end(a)
table.save(a,file='mytable2.tab')
}