Free Statistics

of Irreproducible Research!

Author's title

Author*The author of this computation has been verified*
R Software Modulerwasp_arimabackwardselection.wasp
Title produced by softwareARIMA Backward Selection
Date of computationTue, 28 Dec 2010 22:44:23 +0000
Cite this page as followsStatistical Computations at FreeStatistics.org, Office for Research Development and Education, URL https://freestatistics.org/blog/index.php?v=date/2010/Dec/28/t1293576330feqdclx3f8z0dgr.htm/, Retrieved Sun, 05 May 2024 01:30:54 +0000
Statistical Computations at FreeStatistics.org, Office for Research Development and Education, URL https://freestatistics.org/blog/index.php?pk=116572, Retrieved Sun, 05 May 2024 01:30:54 +0000
QR Codes:

Original text written by user:
IsPrivate?No (this computation is public)
User-defined keywords
Estimated Impact120
Family? (F = Feedback message, R = changed R code, M = changed R Module, P = changed Parameters, D = changed Data)
-       [ARIMA Backward Selection] [Paper Backward Se...] [2010-12-28 22:44:23] [a2e464febd5f86100a78930292e787b9] [Current]
Feedback Forum

Post a new message
Dataseries X:
1203
1319
1328
1260
1286
1274
1389
1255
1244
1336
1214
1239
1174
1061
1116
1123
1086
1074
965
1035
1016
941
1003
998
891
828
833
887
842
793
778
699
686
727
641
619
627
593
535
536
504
487
477
435
433
393
389
377
339
370
350
341
367
396
408
405
391
396
368
356


Summary of computational transaction
Raw Inputview raw input (R code)
Raw Outputview raw output of R engine
Computing time20 seconds
R Server'Gwilym Jenkins' @ 72.249.127.135

\begin{tabular}{lllllllll}
\hline
Summary of computational transaction \tabularnewline
Raw Input & view raw input (R code)  \tabularnewline
Raw Output & view raw output of R engine  \tabularnewline
Computing time & 20 seconds \tabularnewline
R Server & 'Gwilym Jenkins' @ 72.249.127.135 \tabularnewline
\hline
\end{tabular}
%Source: https://freestatistics.org/blog/index.php?pk=116572&T=0

[TABLE]
[ROW][C]Summary of computational transaction[/C][/ROW]
[ROW][C]Raw Input[/C][C]view raw input (R code) [/C][/ROW]
[ROW][C]Raw Output[/C][C]view raw output of R engine [/C][/ROW]
[ROW][C]Computing time[/C][C]20 seconds[/C][/ROW]
[ROW][C]R Server[/C][C]'Gwilym Jenkins' @ 72.249.127.135[/C][/ROW]
[/TABLE]
Source: https://freestatistics.org/blog/index.php?pk=116572&T=0

Globally Unique Identifier (entire table): ba.freestatistics.org/blog/index.php?pk=116572&T=0

As an alternative you can also use a QR Code:  

The GUIDs for individual cells are displayed in the table below:

Summary of computational transaction
Raw Inputview raw input (R code)
Raw Outputview raw output of R engine
Computing time20 seconds
R Server'Gwilym Jenkins' @ 72.249.127.135


ARIMA Parameter Estimation and Backward Selection
Iterationar1ar2ar3ma1sar1sar2sma1
Estimates ( 1 )0.59850.00230.3692-0.82790.59740.2014-0.9994
(p-val)(0.0018 )(0.9883 )(0.0088 )(0 )(0.0182 )(0.4713 )(0.0233 )
Estimates ( 2 )0.599300.3701-0.82740.59810.2034-0.9997
(p-val)(1e-04 )(NA )(0.0053 )(0 )(0.0166 )(0.4328 )(0.0246 )
Estimates ( 3 )0.590700.3662-0.8257-0.14870-0.1657
(p-val)(2e-04 )(NA )(0.0068 )(0 )(0.9013 )(NA )(0.8891 )
Estimates ( 4 )0.584900.3737-0.825200-0.3064
(p-val)(1e-04 )(NA )(0.0028 )(0 )(NA )(NA )(0.1003 )
Estimates ( 5 )0.456600.4663-0.8103000
(p-val)(8e-04 )(NA )(0 )(0 )(NA )(NA )(NA )
Estimates ( 6 )NANANANANANANA
(p-val)(NA )(NA )(NA )(NA )(NA )(NA )(NA )
Estimates ( 7 )NANANANANANANA
(p-val)(NA )(NA )(NA )(NA )(NA )(NA )(NA )
Estimates ( 8 )NANANANANANANA
(p-val)(NA )(NA )(NA )(NA )(NA )(NA )(NA )
Estimates ( 9 )NANANANANANANA
(p-val)(NA )(NA )(NA )(NA )(NA )(NA )(NA )
Estimates ( 10 )NANANANANANANA
(p-val)(NA )(NA )(NA )(NA )(NA )(NA )(NA )
Estimates ( 11 )NANANANANANANA
(p-val)(NA )(NA )(NA )(NA )(NA )(NA )(NA )
Estimates ( 12 )NANANANANANANA
(p-val)(NA )(NA )(NA )(NA )(NA )(NA )(NA )
Estimates ( 13 )NANANANANANANA
(p-val)(NA )(NA )(NA )(NA )(NA )(NA )(NA )

\begin{tabular}{lllllllll}
\hline
ARIMA Parameter Estimation and Backward Selection \tabularnewline
Iteration & ar1 & ar2 & ar3 & ma1 & sar1 & sar2 & sma1 \tabularnewline
Estimates ( 1 ) & 0.5985 & 0.0023 & 0.3692 & -0.8279 & 0.5974 & 0.2014 & -0.9994 \tabularnewline
(p-val) & (0.0018 ) & (0.9883 ) & (0.0088 ) & (0 ) & (0.0182 ) & (0.4713 ) & (0.0233 ) \tabularnewline
Estimates ( 2 ) & 0.5993 & 0 & 0.3701 & -0.8274 & 0.5981 & 0.2034 & -0.9997 \tabularnewline
(p-val) & (1e-04 ) & (NA ) & (0.0053 ) & (0 ) & (0.0166 ) & (0.4328 ) & (0.0246 ) \tabularnewline
Estimates ( 3 ) & 0.5907 & 0 & 0.3662 & -0.8257 & -0.1487 & 0 & -0.1657 \tabularnewline
(p-val) & (2e-04 ) & (NA ) & (0.0068 ) & (0 ) & (0.9013 ) & (NA ) & (0.8891 ) \tabularnewline
Estimates ( 4 ) & 0.5849 & 0 & 0.3737 & -0.8252 & 0 & 0 & -0.3064 \tabularnewline
(p-val) & (1e-04 ) & (NA ) & (0.0028 ) & (0 ) & (NA ) & (NA ) & (0.1003 ) \tabularnewline
Estimates ( 5 ) & 0.4566 & 0 & 0.4663 & -0.8103 & 0 & 0 & 0 \tabularnewline
(p-val) & (8e-04 ) & (NA ) & (0 ) & (0 ) & (NA ) & (NA ) & (NA ) \tabularnewline
Estimates ( 6 ) & NA & NA & NA & NA & NA & NA & NA \tabularnewline
(p-val) & (NA ) & (NA ) & (NA ) & (NA ) & (NA ) & (NA ) & (NA ) \tabularnewline
Estimates ( 7 ) & NA & NA & NA & NA & NA & NA & NA \tabularnewline
(p-val) & (NA ) & (NA ) & (NA ) & (NA ) & (NA ) & (NA ) & (NA ) \tabularnewline
Estimates ( 8 ) & NA & NA & NA & NA & NA & NA & NA \tabularnewline
(p-val) & (NA ) & (NA ) & (NA ) & (NA ) & (NA ) & (NA ) & (NA ) \tabularnewline
Estimates ( 9 ) & NA & NA & NA & NA & NA & NA & NA \tabularnewline
(p-val) & (NA ) & (NA ) & (NA ) & (NA ) & (NA ) & (NA ) & (NA ) \tabularnewline
Estimates ( 10 ) & NA & NA & NA & NA & NA & NA & NA \tabularnewline
(p-val) & (NA ) & (NA ) & (NA ) & (NA ) & (NA ) & (NA ) & (NA ) \tabularnewline
Estimates ( 11 ) & NA & NA & NA & NA & NA & NA & NA \tabularnewline
(p-val) & (NA ) & (NA ) & (NA ) & (NA ) & (NA ) & (NA ) & (NA ) \tabularnewline
Estimates ( 12 ) & NA & NA & NA & NA & NA & NA & NA \tabularnewline
(p-val) & (NA ) & (NA ) & (NA ) & (NA ) & (NA ) & (NA ) & (NA ) \tabularnewline
Estimates ( 13 ) & NA & NA & NA & NA & NA & NA & NA \tabularnewline
(p-val) & (NA ) & (NA ) & (NA ) & (NA ) & (NA ) & (NA ) & (NA ) \tabularnewline
\hline
\end{tabular}
%Source: https://freestatistics.org/blog/index.php?pk=116572&T=1

[TABLE]
[ROW][C]ARIMA Parameter Estimation and Backward Selection[/C][/ROW]
[ROW][C]Iteration[/C][C]ar1[/C][C]ar2[/C][C]ar3[/C][C]ma1[/C][C]sar1[/C][C]sar2[/C][C]sma1[/C][/ROW]
[ROW][C]Estimates ( 1 )[/C][C]0.5985[/C][C]0.0023[/C][C]0.3692[/C][C]-0.8279[/C][C]0.5974[/C][C]0.2014[/C][C]-0.9994[/C][/ROW]
[ROW][C](p-val)[/C][C](0.0018 )[/C][C](0.9883 )[/C][C](0.0088 )[/C][C](0 )[/C][C](0.0182 )[/C][C](0.4713 )[/C][C](0.0233 )[/C][/ROW]
[ROW][C]Estimates ( 2 )[/C][C]0.5993[/C][C]0[/C][C]0.3701[/C][C]-0.8274[/C][C]0.5981[/C][C]0.2034[/C][C]-0.9997[/C][/ROW]
[ROW][C](p-val)[/C][C](1e-04 )[/C][C](NA )[/C][C](0.0053 )[/C][C](0 )[/C][C](0.0166 )[/C][C](0.4328 )[/C][C](0.0246 )[/C][/ROW]
[ROW][C]Estimates ( 3 )[/C][C]0.5907[/C][C]0[/C][C]0.3662[/C][C]-0.8257[/C][C]-0.1487[/C][C]0[/C][C]-0.1657[/C][/ROW]
[ROW][C](p-val)[/C][C](2e-04 )[/C][C](NA )[/C][C](0.0068 )[/C][C](0 )[/C][C](0.9013 )[/C][C](NA )[/C][C](0.8891 )[/C][/ROW]
[ROW][C]Estimates ( 4 )[/C][C]0.5849[/C][C]0[/C][C]0.3737[/C][C]-0.8252[/C][C]0[/C][C]0[/C][C]-0.3064[/C][/ROW]
[ROW][C](p-val)[/C][C](1e-04 )[/C][C](NA )[/C][C](0.0028 )[/C][C](0 )[/C][C](NA )[/C][C](NA )[/C][C](0.1003 )[/C][/ROW]
[ROW][C]Estimates ( 5 )[/C][C]0.4566[/C][C]0[/C][C]0.4663[/C][C]-0.8103[/C][C]0[/C][C]0[/C][C]0[/C][/ROW]
[ROW][C](p-val)[/C][C](8e-04 )[/C][C](NA )[/C][C](0 )[/C][C](0 )[/C][C](NA )[/C][C](NA )[/C][C](NA )[/C][/ROW]
[ROW][C]Estimates ( 6 )[/C][C]NA[/C][C]NA[/C][C]NA[/C][C]NA[/C][C]NA[/C][C]NA[/C][C]NA[/C][/ROW]
[ROW][C](p-val)[/C][C](NA )[/C][C](NA )[/C][C](NA )[/C][C](NA )[/C][C](NA )[/C][C](NA )[/C][C](NA )[/C][/ROW]
[ROW][C]Estimates ( 7 )[/C][C]NA[/C][C]NA[/C][C]NA[/C][C]NA[/C][C]NA[/C][C]NA[/C][C]NA[/C][/ROW]
[ROW][C](p-val)[/C][C](NA )[/C][C](NA )[/C][C](NA )[/C][C](NA )[/C][C](NA )[/C][C](NA )[/C][C](NA )[/C][/ROW]
[ROW][C]Estimates ( 8 )[/C][C]NA[/C][C]NA[/C][C]NA[/C][C]NA[/C][C]NA[/C][C]NA[/C][C]NA[/C][/ROW]
[ROW][C](p-val)[/C][C](NA )[/C][C](NA )[/C][C](NA )[/C][C](NA )[/C][C](NA )[/C][C](NA )[/C][C](NA )[/C][/ROW]
[ROW][C]Estimates ( 9 )[/C][C]NA[/C][C]NA[/C][C]NA[/C][C]NA[/C][C]NA[/C][C]NA[/C][C]NA[/C][/ROW]
[ROW][C](p-val)[/C][C](NA )[/C][C](NA )[/C][C](NA )[/C][C](NA )[/C][C](NA )[/C][C](NA )[/C][C](NA )[/C][/ROW]
[ROW][C]Estimates ( 10 )[/C][C]NA[/C][C]NA[/C][C]NA[/C][C]NA[/C][C]NA[/C][C]NA[/C][C]NA[/C][/ROW]
[ROW][C](p-val)[/C][C](NA )[/C][C](NA )[/C][C](NA )[/C][C](NA )[/C][C](NA )[/C][C](NA )[/C][C](NA )[/C][/ROW]
[ROW][C]Estimates ( 11 )[/C][C]NA[/C][C]NA[/C][C]NA[/C][C]NA[/C][C]NA[/C][C]NA[/C][C]NA[/C][/ROW]
[ROW][C](p-val)[/C][C](NA )[/C][C](NA )[/C][C](NA )[/C][C](NA )[/C][C](NA )[/C][C](NA )[/C][C](NA )[/C][/ROW]
[ROW][C]Estimates ( 12 )[/C][C]NA[/C][C]NA[/C][C]NA[/C][C]NA[/C][C]NA[/C][C]NA[/C][C]NA[/C][/ROW]
[ROW][C](p-val)[/C][C](NA )[/C][C](NA )[/C][C](NA )[/C][C](NA )[/C][C](NA )[/C][C](NA )[/C][C](NA )[/C][/ROW]
[ROW][C]Estimates ( 13 )[/C][C]NA[/C][C]NA[/C][C]NA[/C][C]NA[/C][C]NA[/C][C]NA[/C][C]NA[/C][/ROW]
[ROW][C](p-val)[/C][C](NA )[/C][C](NA )[/C][C](NA )[/C][C](NA )[/C][C](NA )[/C][C](NA )[/C][C](NA )[/C][/ROW]
[/TABLE]
Source: https://freestatistics.org/blog/index.php?pk=116572&T=1

Globally Unique Identifier (entire table): ba.freestatistics.org/blog/index.php?pk=116572&T=1

As an alternative you can also use a QR Code:  

The GUIDs for individual cells are displayed in the table below:

ARIMA Parameter Estimation and Backward Selection
Iterationar1ar2ar3ma1sar1sar2sma1
Estimates ( 1 )0.59850.00230.3692-0.82790.59740.2014-0.9994
(p-val)(0.0018 )(0.9883 )(0.0088 )(0 )(0.0182 )(0.4713 )(0.0233 )
Estimates ( 2 )0.599300.3701-0.82740.59810.2034-0.9997
(p-val)(1e-04 )(NA )(0.0053 )(0 )(0.0166 )(0.4328 )(0.0246 )
Estimates ( 3 )0.590700.3662-0.8257-0.14870-0.1657
(p-val)(2e-04 )(NA )(0.0068 )(0 )(0.9013 )(NA )(0.8891 )
Estimates ( 4 )0.584900.3737-0.825200-0.3064
(p-val)(1e-04 )(NA )(0.0028 )(0 )(NA )(NA )(0.1003 )
Estimates ( 5 )0.456600.4663-0.8103000
(p-val)(8e-04 )(NA )(0 )(0 )(NA )(NA )(NA )
Estimates ( 6 )NANANANANANANA
(p-val)(NA )(NA )(NA )(NA )(NA )(NA )(NA )
Estimates ( 7 )NANANANANANANA
(p-val)(NA )(NA )(NA )(NA )(NA )(NA )(NA )
Estimates ( 8 )NANANANANANANA
(p-val)(NA )(NA )(NA )(NA )(NA )(NA )(NA )
Estimates ( 9 )NANANANANANANA
(p-val)(NA )(NA )(NA )(NA )(NA )(NA )(NA )
Estimates ( 10 )NANANANANANANA
(p-val)(NA )(NA )(NA )(NA )(NA )(NA )(NA )
Estimates ( 11 )NANANANANANANA
(p-val)(NA )(NA )(NA )(NA )(NA )(NA )(NA )
Estimates ( 12 )NANANANANANANA
(p-val)(NA )(NA )(NA )(NA )(NA )(NA )(NA )
Estimates ( 13 )NANANANANANANA
(p-val)(NA )(NA )(NA )(NA )(NA )(NA )(NA )


Estimated ARIMA Residuals
Value
1.20299920329002
100.792079992533
24.0145515422580
-40.0710159681133
-9.025893106558
-36.0663697389946
111.530624265928
-108.943123996144
-23.4494469113541
34.9818412120295
-84.467520476875
16.8361861822104
-103.894403246485
-81.4438471463232
30.7980891865111
6.76330051673594
12.8243397361665
-9.04326246248892
-70.1678238737551
30.5505797570647
-10.8309977704151
-16.4717739823912
32.6760351492162
18.6661018876525
-95.1930047142183
-101.470798354289
-10.1681191938079
76.7795459057429
12.5131936753571
-20.199222021031
-42.36495028501
-61.3726896170761
-10.119460318368
43.5162238004205
-30.4198099805377
5.56102821643847
-23.6066923729798
-33.1152001396477
-34.7082998353697
29.3885780641615
-11.1810500650284
4.81471942329275
-4.33483161776552
-35.8638227744909
11.7324864713967
-9.5249852026572
6.91401937140765
6.18397458578168
-19.5629564182483
34.3965709489569
-7.52616476875871
28.4674706968307
32.3121423329647
52.2324778402725
38.9570834486802
2.51760429475573
-8.34429838273392
-4.0667043637395
-28.6320456397001
-13.8710967407836

\begin{tabular}{lllllllll}
\hline
Estimated ARIMA Residuals \tabularnewline
Value \tabularnewline
1.20299920329002 \tabularnewline
100.792079992533 \tabularnewline
24.0145515422580 \tabularnewline
-40.0710159681133 \tabularnewline
-9.025893106558 \tabularnewline
-36.0663697389946 \tabularnewline
111.530624265928 \tabularnewline
-108.943123996144 \tabularnewline
-23.4494469113541 \tabularnewline
34.9818412120295 \tabularnewline
-84.467520476875 \tabularnewline
16.8361861822104 \tabularnewline
-103.894403246485 \tabularnewline
-81.4438471463232 \tabularnewline
30.7980891865111 \tabularnewline
6.76330051673594 \tabularnewline
12.8243397361665 \tabularnewline
-9.04326246248892 \tabularnewline
-70.1678238737551 \tabularnewline
30.5505797570647 \tabularnewline
-10.8309977704151 \tabularnewline
-16.4717739823912 \tabularnewline
32.6760351492162 \tabularnewline
18.6661018876525 \tabularnewline
-95.1930047142183 \tabularnewline
-101.470798354289 \tabularnewline
-10.1681191938079 \tabularnewline
76.7795459057429 \tabularnewline
12.5131936753571 \tabularnewline
-20.199222021031 \tabularnewline
-42.36495028501 \tabularnewline
-61.3726896170761 \tabularnewline
-10.119460318368 \tabularnewline
43.5162238004205 \tabularnewline
-30.4198099805377 \tabularnewline
5.56102821643847 \tabularnewline
-23.6066923729798 \tabularnewline
-33.1152001396477 \tabularnewline
-34.7082998353697 \tabularnewline
29.3885780641615 \tabularnewline
-11.1810500650284 \tabularnewline
4.81471942329275 \tabularnewline
-4.33483161776552 \tabularnewline
-35.8638227744909 \tabularnewline
11.7324864713967 \tabularnewline
-9.5249852026572 \tabularnewline
6.91401937140765 \tabularnewline
6.18397458578168 \tabularnewline
-19.5629564182483 \tabularnewline
34.3965709489569 \tabularnewline
-7.52616476875871 \tabularnewline
28.4674706968307 \tabularnewline
32.3121423329647 \tabularnewline
52.2324778402725 \tabularnewline
38.9570834486802 \tabularnewline
2.51760429475573 \tabularnewline
-8.34429838273392 \tabularnewline
-4.0667043637395 \tabularnewline
-28.6320456397001 \tabularnewline
-13.8710967407836 \tabularnewline
\hline
\end{tabular}
%Source: https://freestatistics.org/blog/index.php?pk=116572&T=2

[TABLE]
[ROW][C]Estimated ARIMA Residuals[/C][/ROW]
[ROW][C]Value[/C][/ROW]
[ROW][C]1.20299920329002[/C][/ROW]
[ROW][C]100.792079992533[/C][/ROW]
[ROW][C]24.0145515422580[/C][/ROW]
[ROW][C]-40.0710159681133[/C][/ROW]
[ROW][C]-9.025893106558[/C][/ROW]
[ROW][C]-36.0663697389946[/C][/ROW]
[ROW][C]111.530624265928[/C][/ROW]
[ROW][C]-108.943123996144[/C][/ROW]
[ROW][C]-23.4494469113541[/C][/ROW]
[ROW][C]34.9818412120295[/C][/ROW]
[ROW][C]-84.467520476875[/C][/ROW]
[ROW][C]16.8361861822104[/C][/ROW]
[ROW][C]-103.894403246485[/C][/ROW]
[ROW][C]-81.4438471463232[/C][/ROW]
[ROW][C]30.7980891865111[/C][/ROW]
[ROW][C]6.76330051673594[/C][/ROW]
[ROW][C]12.8243397361665[/C][/ROW]
[ROW][C]-9.04326246248892[/C][/ROW]
[ROW][C]-70.1678238737551[/C][/ROW]
[ROW][C]30.5505797570647[/C][/ROW]
[ROW][C]-10.8309977704151[/C][/ROW]
[ROW][C]-16.4717739823912[/C][/ROW]
[ROW][C]32.6760351492162[/C][/ROW]
[ROW][C]18.6661018876525[/C][/ROW]
[ROW][C]-95.1930047142183[/C][/ROW]
[ROW][C]-101.470798354289[/C][/ROW]
[ROW][C]-10.1681191938079[/C][/ROW]
[ROW][C]76.7795459057429[/C][/ROW]
[ROW][C]12.5131936753571[/C][/ROW]
[ROW][C]-20.199222021031[/C][/ROW]
[ROW][C]-42.36495028501[/C][/ROW]
[ROW][C]-61.3726896170761[/C][/ROW]
[ROW][C]-10.119460318368[/C][/ROW]
[ROW][C]43.5162238004205[/C][/ROW]
[ROW][C]-30.4198099805377[/C][/ROW]
[ROW][C]5.56102821643847[/C][/ROW]
[ROW][C]-23.6066923729798[/C][/ROW]
[ROW][C]-33.1152001396477[/C][/ROW]
[ROW][C]-34.7082998353697[/C][/ROW]
[ROW][C]29.3885780641615[/C][/ROW]
[ROW][C]-11.1810500650284[/C][/ROW]
[ROW][C]4.81471942329275[/C][/ROW]
[ROW][C]-4.33483161776552[/C][/ROW]
[ROW][C]-35.8638227744909[/C][/ROW]
[ROW][C]11.7324864713967[/C][/ROW]
[ROW][C]-9.5249852026572[/C][/ROW]
[ROW][C]6.91401937140765[/C][/ROW]
[ROW][C]6.18397458578168[/C][/ROW]
[ROW][C]-19.5629564182483[/C][/ROW]
[ROW][C]34.3965709489569[/C][/ROW]
[ROW][C]-7.52616476875871[/C][/ROW]
[ROW][C]28.4674706968307[/C][/ROW]
[ROW][C]32.3121423329647[/C][/ROW]
[ROW][C]52.2324778402725[/C][/ROW]
[ROW][C]38.9570834486802[/C][/ROW]
[ROW][C]2.51760429475573[/C][/ROW]
[ROW][C]-8.34429838273392[/C][/ROW]
[ROW][C]-4.0667043637395[/C][/ROW]
[ROW][C]-28.6320456397001[/C][/ROW]
[ROW][C]-13.8710967407836[/C][/ROW]
[/TABLE]
Source: https://freestatistics.org/blog/index.php?pk=116572&T=2

Globally Unique Identifier (entire table): ba.freestatistics.org/blog/index.php?pk=116572&T=2

As an alternative you can also use a QR Code:  

The GUIDs for individual cells are displayed in the table below:

Estimated ARIMA Residuals
Value
1.20299920329002
100.792079992533
24.0145515422580
-40.0710159681133
-9.025893106558
-36.0663697389946
111.530624265928
-108.943123996144
-23.4494469113541
34.9818412120295
-84.467520476875
16.8361861822104
-103.894403246485
-81.4438471463232
30.7980891865111
6.76330051673594
12.8243397361665
-9.04326246248892
-70.1678238737551
30.5505797570647
-10.8309977704151
-16.4717739823912
32.6760351492162
18.6661018876525
-95.1930047142183
-101.470798354289
-10.1681191938079
76.7795459057429
12.5131936753571
-20.199222021031
-42.36495028501
-61.3726896170761
-10.119460318368
43.5162238004205
-30.4198099805377
5.56102821643847
-23.6066923729798
-33.1152001396477
-34.7082998353697
29.3885780641615
-11.1810500650284
4.81471942329275
-4.33483161776552
-35.8638227744909
11.7324864713967
-9.5249852026572
6.91401937140765
6.18397458578168
-19.5629564182483
34.3965709489569
-7.52616476875871
28.4674706968307
32.3121423329647
52.2324778402725
38.9570834486802
2.51760429475573
-8.34429838273392
-4.0667043637395
-28.6320456397001
-13.8710967407836


Parameters (Session):
par1 = FALSE ; par2 = 1 ; par3 = 1 ; par4 = 0 ; par5 = 12 ; par6 = 3 ; par7 = 1 ; par8 = 2 ; par9 = 1 ;
Parameters (R input):
par1 = FALSE ; par2 = 1 ; par3 = 1 ; par4 = 0 ; par5 = 12 ; par6 = 3 ; par7 = 1 ; par8 = 2 ; par9 = 1 ;
R code (references can be found in the software module):
library(lattice)
if (par1 == 'TRUE') par1 <- TRUE
if (par1 == 'FALSE') par1 <- FALSE
par2 <- as.numeric(par2) #Box-Cox lambda transformation parameter
par3 <- as.numeric(par3) #degree of non-seasonal differencing
par4 <- as.numeric(par4) #degree of seasonal differencing
par5 <- as.numeric(par5) #seasonal period
par6 <- as.numeric(par6) #degree (p) of the non-seasonal AR(p) polynomial
par7 <- as.numeric(par7) #degree (q) of the non-seasonal MA(q) polynomial
par8 <- as.numeric(par8) #degree (P) of the seasonal AR(P) polynomial
par9 <- as.numeric(par9) #degree (Q) of the seasonal MA(Q) polynomial
armaGR <- function(arima.out, names, n){
try1 <- arima.out$coef
try2 <- sqrt(diag(arima.out$var.coef))
try.data.frame <- data.frame(matrix(NA,ncol=4,nrow=length(names)))
dimnames(try.data.frame) <- list(names,c('coef','std','tstat','pv'))
try.data.frame[,1] <- try1
for(i in 1:length(try2)) try.data.frame[which(rownames(try.data.frame)==names(try2)[i]),2] <- try2[i]
try.data.frame[,3] <- try.data.frame[,1] / try.data.frame[,2]
try.data.frame[,4] <- round((1-pt(abs(try.data.frame[,3]),df=n-(length(try2)+1)))*2,5)
vector <- rep(NA,length(names))
vector[is.na(try.data.frame[,4])] <- 0
maxi <- which.max(try.data.frame[,4])
continue <- max(try.data.frame[,4],na.rm=TRUE) > .05
vector[maxi] <- 0
list(summary=try.data.frame,next.vector=vector,continue=continue)
}
arimaSelect <- function(series, order=c(13,0,0), seasonal=list(order=c(2,0,0),period=12), include.mean=F){
nrc <- order[1]+order[3]+seasonal$order[1]+seasonal$order[3]
coeff <- matrix(NA, nrow=nrc*2, ncol=nrc)
pval <- matrix(NA, nrow=nrc*2, ncol=nrc)
mylist <- rep(list(NULL), nrc)
names <- NULL
if(order[1] > 0) names <- paste('ar',1:order[1],sep='')
if(order[3] > 0) names <- c( names , paste('ma',1:order[3],sep='') )
if(seasonal$order[1] > 0) names <- c(names, paste('sar',1:seasonal$order[1],sep=''))
if(seasonal$order[3] > 0) names <- c(names, paste('sma',1:seasonal$order[3],sep=''))
arima.out <- arima(series, order=order, seasonal=seasonal, include.mean=include.mean, method='ML')
mylist[[1]] <- arima.out
last.arma <- armaGR(arima.out, names, length(series))
mystop <- FALSE
i <- 1
coeff[i,] <- last.arma[[1]][,1]
pval [i,] <- last.arma[[1]][,4]
i <- 2
aic <- arima.out$aic
while(!mystop){
mylist[[i]] <- arima.out
arima.out <- arima(series, order=order, seasonal=seasonal, include.mean=include.mean, method='ML', fixed=last.arma$next.vector)
aic <- c(aic, arima.out$aic)
last.arma <- armaGR(arima.out, names, length(series))
mystop <- !last.arma$continue
coeff[i,] <- last.arma[[1]][,1]
pval [i,] <- last.arma[[1]][,4]
i <- i+1
}
list(coeff, pval, mylist, aic=aic)
}
arimaSelectplot <- function(arimaSelect.out,noms,choix){
noms <- names(arimaSelect.out[[3]][[1]]$coef)
coeff <- arimaSelect.out[[1]]
k <- min(which(is.na(coeff[,1])))-1
coeff <- coeff[1:k,]
pval <- arimaSelect.out[[2]][1:k,]
aic <- arimaSelect.out$aic[1:k]
coeff[coeff==0] <- NA
n <- ncol(coeff)
if(missing(choix)) choix <- k
layout(matrix(c(1,1,1,2,
3,3,3,2,
3,3,3,4,
5,6,7,7),nr=4),
widths=c(10,35,45,15),
heights=c(30,30,15,15))
couleurs <- rainbow(75)[1:50]#(50)
ticks <- pretty(coeff)
par(mar=c(1,1,3,1))
plot(aic,k:1-.5,type='o',pch=21,bg='blue',cex=2,axes=F,lty=2,xpd=NA)
points(aic[choix],k-choix+.5,pch=21,cex=4,bg=2,xpd=NA)
title('aic',line=2)
par(mar=c(3,0,0,0))
plot(0,axes=F,xlab='',ylab='',xlim=range(ticks),ylim=c(.1,1))
rect(xleft = min(ticks) + (0:49)/50*(max(ticks)-min(ticks)),
xright = min(ticks) + (1:50)/50*(max(ticks)-min(ticks)),
ytop = rep(1,50),
ybottom= rep(0,50),col=couleurs,border=NA)
axis(1,ticks)
rect(xleft=min(ticks),xright=max(ticks),ytop=1,ybottom=0)
text(mean(coeff,na.rm=T),.5,'coefficients',cex=2,font=2)
par(mar=c(1,1,3,1))
image(1:n,1:k,t(coeff[k:1,]),axes=F,col=couleurs,zlim=range(ticks))
for(i in 1:n) for(j in 1:k) if(!is.na(coeff[j,i])) {
if(pval[j,i]<.01) symb = 'green'
else if( (pval[j,i]<.05) & (pval[j,i]>=.01)) symb = 'orange'
else if( (pval[j,i]<.1) & (pval[j,i]>=.05)) symb = 'red'
else symb = 'black'
polygon(c(i+.5 ,i+.2 ,i+.5 ,i+.5),
c(k-j+0.5,k-j+0.5,k-j+0.8,k-j+0.5),
col=symb)
if(j==choix) {
rect(xleft=i-.5,
xright=i+.5,
ybottom=k-j+1.5,
ytop=k-j+.5,
lwd=4)
text(i,
k-j+1,
round(coeff[j,i],2),
cex=1.2,
font=2)
}
else{
rect(xleft=i-.5,xright=i+.5,ybottom=k-j+1.5,ytop=k-j+.5)
text(i,k-j+1,round(coeff[j,i],2),cex=1.2,font=1)
}
}
axis(3,1:n,noms)
par(mar=c(0.5,0,0,0.5))
plot(0,axes=F,xlab='',ylab='',type='n',xlim=c(0,8),ylim=c(-.2,.8))
cols <- c('green','orange','red','black')
niv <- c('0','0.01','0.05','0.1')
for(i in 0:3){
polygon(c(1+2*i ,1+2*i ,1+2*i-.5 ,1+2*i),
c(.4 ,.7 , .4 , .4),
col=cols[i+1])
text(2*i,0.5,niv[i+1],cex=1.5)
}
text(8,.5,1,cex=1.5)
text(4,0,'p-value',cex=2)
box()
residus <- arimaSelect.out[[3]][[choix]]$res
par(mar=c(1,2,4,1))
acf(residus,main='')
title('acf',line=.5)
par(mar=c(1,2,4,1))
pacf(residus,main='')
title('pacf',line=.5)
par(mar=c(2,2,4,1))
qqnorm(residus,main='')
title('qq-norm',line=.5)
qqline(residus)
residus
}
if (par2 == 0) x <- log(x)
if (par2 != 0) x <- x^par2
(selection <- arimaSelect(x, order=c(par6,par3,par7), seasonal=list(order=c(par8,par4,par9), period=par5)))
bitmap(file='test1.png')
resid <- arimaSelectplot(selection)
dev.off()
resid
bitmap(file='test2.png')
acf(resid,length(resid)/2, main='Residual Autocorrelation Function')
dev.off()
bitmap(file='test3.png')
pacf(resid,length(resid)/2, main='Residual Partial Autocorrelation Function')
dev.off()
bitmap(file='test4.png')
cpgram(resid, main='Residual Cumulative Periodogram')
dev.off()
bitmap(file='test5.png')
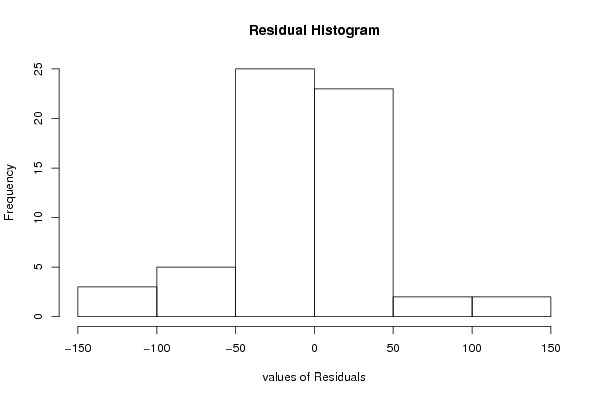
hist(resid, main='Residual Histogram', xlab='values of Residuals')
dev.off()
bitmap(file='test6.png')
densityplot(~resid,col='black',main='Residual Density Plot', xlab='values of Residuals')
dev.off()
bitmap(file='test7.png')
qqnorm(resid, main='Residual Normal Q-Q Plot')
qqline(resid)
dev.off()
ncols <- length(selection[[1]][1,])
nrows <- length(selection[[2]][,1])-1
load(file='createtable')
a<-table.start()
a<-table.row.start(a)
a<-table.element(a,'ARIMA Parameter Estimation and Backward Selection', ncols+1,TRUE)
a<-table.row.end(a)
a<-table.row.start(a)
a<-table.element(a,'Iteration', header=TRUE)
for (i in 1:ncols) {
a<-table.element(a,names(selection[[3]][[1]]$coef)[i],header=TRUE)
}
a<-table.row.end(a)
for (j in 1:nrows) {
a<-table.row.start(a)
mydum <- 'Estimates ('
mydum <- paste(mydum,j)
mydum <- paste(mydum,')')
a<-table.element(a,mydum, header=TRUE)
for (i in 1:ncols) {
a<-table.element(a,round(selection[[1]][j,i],4))
}
a<-table.row.end(a)
a<-table.row.start(a)
a<-table.element(a,'(p-val)', header=TRUE)
for (i in 1:ncols) {
mydum <- '('
mydum <- paste(mydum,round(selection[[2]][j,i],4),sep='')
mydum <- paste(mydum,')')
a<-table.element(a,mydum)
}
a<-table.row.end(a)
}
a<-table.end(a)
table.save(a,file='mytable.tab')
a<-table.start()
a<-table.row.start(a)
a<-table.element(a,'Estimated ARIMA Residuals', 1,TRUE)
a<-table.row.end(a)
a<-table.row.start(a)
a<-table.element(a,'Value', 1,TRUE)
a<-table.row.end(a)
for (i in (par4*par5+par3):length(resid)) {
a<-table.row.start(a)
a<-table.element(a,resid[i])
a<-table.row.end(a)
}
a<-table.end(a)
table.save(a,file='mytable1.tab')