Free Statistics

of Irreproducible Research!

Author's title

Author*The author of this computation has been verified*
R Software Modulerwasp_smp.wasp
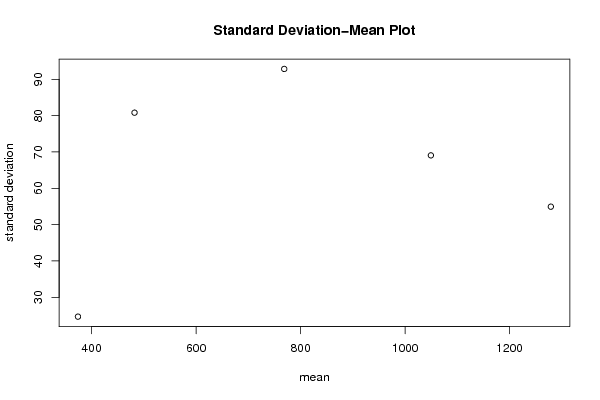
Title produced by softwareStandard Deviation-Mean Plot
Date of computationTue, 28 Dec 2010 22:39:18 +0000
Cite this page as followsStatistical Computations at FreeStatistics.org, Office for Research Development and Education, URL https://freestatistics.org/blog/index.php?v=date/2010/Dec/28/t12935758864y7mq7wdrxady89.htm/, Retrieved Sun, 05 May 2024 05:25:52 +0000
Statistical Computations at FreeStatistics.org, Office for Research Development and Education, URL https://freestatistics.org/blog/index.php?pk=116571, Retrieved Sun, 05 May 2024 05:25:52 +0000
QR Codes:

Original text written by user:
IsPrivate?No (this computation is public)
User-defined keywords
Estimated Impact132
Family? (F = Feedback message, R = changed R code, M = changed R Module, P = changed Parameters, D = changed Data)
-       [Standard Deviation-Mean Plot] [Paper Standard de...] [2010-12-28 22:39:18] [a2e464febd5f86100a78930292e787b9] [Current]
Feedback Forum

Post a new message
Dataseries X:
1203
1319
1328
1260
1286
1274
1389
1255
1244
1336
1214
1239
1174
1061
1116
1123
1086
1074
965
1035
1016
941
1003
998
891
828
833
887
842
793
778
699
686
727
641
619
627
593
535
536
504
487
477
435
433
393
389
377
339
370
350
341
367
396
408
405
391
396
368
356


Summary of computational transaction
Raw Inputview raw input (R code)
Raw Outputview raw output of R engine
Computing time2 seconds
R Server'Sir Ronald Aylmer Fisher' @ 193.190.124.24

\begin{tabular}{lllllllll}
\hline
Summary of computational transaction \tabularnewline
Raw Input & view raw input (R code)  \tabularnewline
Raw Output & view raw output of R engine  \tabularnewline
Computing time & 2 seconds \tabularnewline
R Server & 'Sir Ronald Aylmer Fisher' @ 193.190.124.24 \tabularnewline
\hline
\end{tabular}
%Source: https://freestatistics.org/blog/index.php?pk=116571&T=0

[TABLE]
[ROW][C]Summary of computational transaction[/C][/ROW]
[ROW][C]Raw Input[/C][C]view raw input (R code) [/C][/ROW]
[ROW][C]Raw Output[/C][C]view raw output of R engine [/C][/ROW]
[ROW][C]Computing time[/C][C]2 seconds[/C][/ROW]
[ROW][C]R Server[/C][C]'Sir Ronald Aylmer Fisher' @ 193.190.124.24[/C][/ROW]
[/TABLE]
Source: https://freestatistics.org/blog/index.php?pk=116571&T=0

Globally Unique Identifier (entire table): ba.freestatistics.org/blog/index.php?pk=116571&T=0

As an alternative you can also use a QR Code:  

The GUIDs for individual cells are displayed in the table below:

Summary of computational transaction
Raw Inputview raw input (R code)
Raw Outputview raw output of R engine
Computing time2 seconds
R Server'Sir Ronald Aylmer Fisher' @ 193.190.124.24


Standard Deviation-Mean Plot
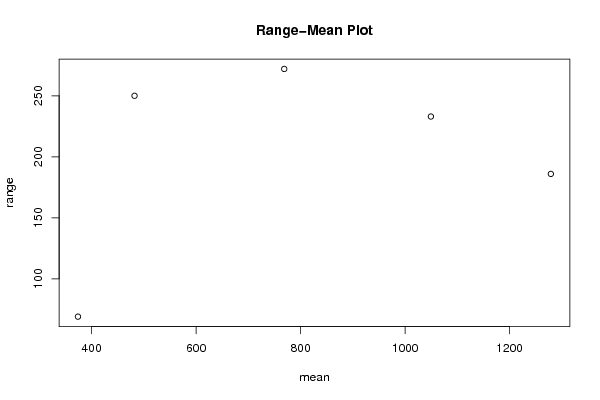
SectionMeanStandard DeviationRange
11278.9166666666754.9271556176216186
21049.3333333333369.051144856987233
3768.66666666666792.837427144379272
4482.16666666666780.7969771411748250
5373.91666666666724.659345760448269

\begin{tabular}{lllllllll}
\hline
Standard Deviation-Mean Plot \tabularnewline
Section & Mean & Standard Deviation & Range \tabularnewline
1 & 1278.91666666667 & 54.9271556176216 & 186 \tabularnewline
2 & 1049.33333333333 & 69.051144856987 & 233 \tabularnewline
3 & 768.666666666667 & 92.837427144379 & 272 \tabularnewline
4 & 482.166666666667 & 80.7969771411748 & 250 \tabularnewline
5 & 373.916666666667 & 24.6593457604482 & 69 \tabularnewline
\hline
\end{tabular}
%Source: https://freestatistics.org/blog/index.php?pk=116571&T=1

[TABLE]
[ROW][C]Standard Deviation-Mean Plot[/C][/ROW]
[ROW][C]Section[/C][C]Mean[/C][C]Standard Deviation[/C][C]Range[/C][/ROW]
[ROW][C]1[/C][C]1278.91666666667[/C][C]54.9271556176216[/C][C]186[/C][/ROW]
[ROW][C]2[/C][C]1049.33333333333[/C][C]69.051144856987[/C][C]233[/C][/ROW]
[ROW][C]3[/C][C]768.666666666667[/C][C]92.837427144379[/C][C]272[/C][/ROW]
[ROW][C]4[/C][C]482.166666666667[/C][C]80.7969771411748[/C][C]250[/C][/ROW]
[ROW][C]5[/C][C]373.916666666667[/C][C]24.6593457604482[/C][C]69[/C][/ROW]
[/TABLE]
Source: https://freestatistics.org/blog/index.php?pk=116571&T=1

Globally Unique Identifier (entire table): ba.freestatistics.org/blog/index.php?pk=116571&T=1

As an alternative you can also use a QR Code:  

The GUIDs for individual cells are displayed in the table below:

Standard Deviation-Mean Plot
SectionMeanStandard DeviationRange
11278.9166666666754.9271556176216186
21049.3333333333369.051144856987233
3768.66666666666792.837427144379272
4482.16666666666780.7969771411748250
5373.91666666666724.659345760448269


Regression: S.E.(k) = alpha + beta * Mean(k)
alpha54.1964331904668
beta0.0129749265287823
S.D.0.0393658932628555
T-STAT0.329598173783219
p-value0.763375526451557

\begin{tabular}{lllllllll}
\hline
Regression: S.E.(k) = alpha + beta * Mean(k) \tabularnewline
alpha & 54.1964331904668 \tabularnewline
beta & 0.0129749265287823 \tabularnewline
S.D. & 0.0393658932628555 \tabularnewline
T-STAT & 0.329598173783219 \tabularnewline
p-value & 0.763375526451557 \tabularnewline
\hline
\end{tabular}
%Source: https://freestatistics.org/blog/index.php?pk=116571&T=2

[TABLE]
[ROW][C]Regression: S.E.(k) = alpha + beta * Mean(k)[/C][/ROW]
[ROW][C]alpha[/C][C]54.1964331904668[/C][/ROW]
[ROW][C]beta[/C][C]0.0129749265287823[/C][/ROW]
[ROW][C]S.D.[/C][C]0.0393658932628555[/C][/ROW]
[ROW][C]T-STAT[/C][C]0.329598173783219[/C][/ROW]
[ROW][C]p-value[/C][C]0.763375526451557[/C][/ROW]
[/TABLE]
Source: https://freestatistics.org/blog/index.php?pk=116571&T=2

Globally Unique Identifier (entire table): ba.freestatistics.org/blog/index.php?pk=116571&T=2

As an alternative you can also use a QR Code:  

The GUIDs for individual cells are displayed in the table below:

Regression: S.E.(k) = alpha + beta * Mean(k)
alpha54.1964331904668
beta0.0129749265287823
S.D.0.0393658932628555
T-STAT0.329598173783219
p-value0.763375526451557


Regression: ln S.E.(k) = alpha + beta * ln Mean(k)
alpha1.03344055329255
beta0.462664139634841
S.D.0.520681865650023
T-STAT0.888573561242137
p-value0.439686961639234
Lambda0.537335860365159

\begin{tabular}{lllllllll}
\hline
Regression: ln S.E.(k) = alpha + beta * ln Mean(k) \tabularnewline
alpha & 1.03344055329255 \tabularnewline
beta & 0.462664139634841 \tabularnewline
S.D. & 0.520681865650023 \tabularnewline
T-STAT & 0.888573561242137 \tabularnewline
p-value & 0.439686961639234 \tabularnewline
Lambda & 0.537335860365159 \tabularnewline
\hline
\end{tabular}
%Source: https://freestatistics.org/blog/index.php?pk=116571&T=3

[TABLE]
[ROW][C]Regression: ln S.E.(k) = alpha + beta * ln Mean(k)[/C][/ROW]
[ROW][C]alpha[/C][C]1.03344055329255[/C][/ROW]
[ROW][C]beta[/C][C]0.462664139634841[/C][/ROW]
[ROW][C]S.D.[/C][C]0.520681865650023[/C][/ROW]
[ROW][C]T-STAT[/C][C]0.888573561242137[/C][/ROW]
[ROW][C]p-value[/C][C]0.439686961639234[/C][/ROW]
[ROW][C]Lambda[/C][C]0.537335860365159[/C][/ROW]
[/TABLE]
Source: https://freestatistics.org/blog/index.php?pk=116571&T=3

Globally Unique Identifier (entire table): ba.freestatistics.org/blog/index.php?pk=116571&T=3

As an alternative you can also use a QR Code:  

The GUIDs for individual cells are displayed in the table below:

Regression: ln S.E.(k) = alpha + beta * ln Mean(k)
alpha1.03344055329255
beta0.462664139634841
S.D.0.520681865650023
T-STAT0.888573561242137
p-value0.439686961639234
Lambda0.537335860365159


Parameters (Session):
par1 = 12 ;
Parameters (R input):
par1 = 12 ;
R code (references can be found in the software module):
par1 <- as.numeric(par1)
(n <- length(x))
(np <- floor(n / par1))
arr <- array(NA,dim=c(par1,np))
j <- 0
k <- 1
for (i in 1:(np*par1))
{
j = j + 1
arr[j,k] <- x[i]
if (j == par1) {
j = 0
k=k+1
}
}
arr
arr.mean <- array(NA,dim=np)
arr.sd <- array(NA,dim=np)
arr.range <- array(NA,dim=np)
for (j in 1:np)
{
arr.mean[j] <- mean(arr[,j],na.rm=TRUE)
arr.sd[j] <- sd(arr[,j],na.rm=TRUE)
arr.range[j] <- max(arr[,j],na.rm=TRUE) - min(arr[,j],na.rm=TRUE)
}
arr.mean
arr.sd
arr.range
(lm1 <- lm(arr.sd~arr.mean))
(lnlm1 <- lm(log(arr.sd)~log(arr.mean)))
(lm2 <- lm(arr.range~arr.mean))
bitmap(file='test1.png')
plot(arr.mean,arr.sd,main='Standard Deviation-Mean Plot',xlab='mean',ylab='standard deviation')
dev.off()
bitmap(file='test2.png')
plot(arr.mean,arr.range,main='Range-Mean Plot',xlab='mean',ylab='range')
dev.off()
load(file='createtable')
a<-table.start()
a<-table.row.start(a)
a<-table.element(a,'Standard Deviation-Mean Plot',4,TRUE)
a<-table.row.end(a)
a<-table.row.start(a)
a<-table.element(a,'Section',header=TRUE)
a<-table.element(a,'Mean',header=TRUE)
a<-table.element(a,'Standard Deviation',header=TRUE)
a<-table.element(a,'Range',header=TRUE)
a<-table.row.end(a)
for (j in 1:np) {
a<-table.row.start(a)
a<-table.element(a,j,header=TRUE)
a<-table.element(a,arr.mean[j])
a<-table.element(a,arr.sd[j] )
a<-table.element(a,arr.range[j] )
a<-table.row.end(a)
}
a<-table.end(a)
table.save(a,file='mytable.tab')
a<-table.start()
a<-table.row.start(a)
a<-table.element(a,'Regression: S.E.(k) = alpha + beta * Mean(k)',2,TRUE)
a<-table.row.end(a)
a<-table.row.start(a)
a<-table.element(a,'alpha',header=TRUE)
a<-table.element(a,lm1$coefficients[[1]])
a<-table.row.end(a)
a<-table.row.start(a)
a<-table.element(a,'beta',header=TRUE)
a<-table.element(a,lm1$coefficients[[2]])
a<-table.row.end(a)
a<-table.row.start(a)
a<-table.element(a,'S.D.',header=TRUE)
a<-table.element(a,summary(lm1)$coefficients[2,2])
a<-table.row.end(a)
a<-table.row.start(a)
a<-table.element(a,'T-STAT',header=TRUE)
a<-table.element(a,summary(lm1)$coefficients[2,3])
a<-table.row.end(a)
a<-table.row.start(a)
a<-table.element(a,'p-value',header=TRUE)
a<-table.element(a,summary(lm1)$coefficients[2,4])
a<-table.row.end(a)
a<-table.end(a)
table.save(a,file='mytable1.tab')
a<-table.start()
a<-table.row.start(a)
a<-table.element(a,'Regression: ln S.E.(k) = alpha + beta * ln Mean(k)',2,TRUE)
a<-table.row.end(a)
a<-table.row.start(a)
a<-table.element(a,'alpha',header=TRUE)
a<-table.element(a,lnlm1$coefficients[[1]])
a<-table.row.end(a)
a<-table.row.start(a)
a<-table.element(a,'beta',header=TRUE)
a<-table.element(a,lnlm1$coefficients[[2]])
a<-table.row.end(a)
a<-table.row.start(a)
a<-table.element(a,'S.D.',header=TRUE)
a<-table.element(a,summary(lnlm1)$coefficients[2,2])
a<-table.row.end(a)
a<-table.row.start(a)
a<-table.element(a,'T-STAT',header=TRUE)
a<-table.element(a,summary(lnlm1)$coefficients[2,3])
a<-table.row.end(a)
a<-table.row.start(a)
a<-table.element(a,'p-value',header=TRUE)
a<-table.element(a,summary(lnlm1)$coefficients[2,4])
a<-table.row.end(a)
a<-table.row.start(a)
a<-table.element(a,'Lambda',header=TRUE)
a<-table.element(a,1-lnlm1$coefficients[[2]])
a<-table.row.end(a)
a<-table.end(a)
table.save(a,file='mytable2.tab')