Free Statistics

of Irreproducible Research!

Author's title

Author*The author of this computation has been verified*
R Software Modulerwasp_autocorrelation.wasp
Title produced by software(Partial) Autocorrelation Function
Date of computationTue, 28 Dec 2010 22:21:13 +0000
Cite this page as followsStatistical Computations at FreeStatistics.org, Office for Research Development and Education, URL https://freestatistics.org/blog/index.php?v=date/2010/Dec/28/t1293574792nrv0alwn8k9n3j7.htm/, Retrieved Sun, 05 May 2024 05:18:11 +0000
Statistical Computations at FreeStatistics.org, Office for Research Development and Education, URL https://freestatistics.org/blog/index.php?pk=116563, Retrieved Sun, 05 May 2024 05:18:11 +0000
QR Codes:

Original text written by user:
IsPrivate?No (this computation is public)
User-defined keywords
Estimated Impact102
Family? (F = Feedback message, R = changed R code, M = changed R Module, P = changed Parameters, D = changed Data)
-       [(Partial) Autocorrelation Function] [Paper ACF] [2010-12-28 22:21:13] [a2e464febd5f86100a78930292e787b9] [Current]
Feedback Forum

Post a new message
Dataseries X:
1203
1319
1328
1260
1286
1274
1389
1255
1244
1336
1214
1239
1174
1061
1116
1123
1086
1074
965
1035
1016
941
1003
998
891
828
833
887
842
793
778
699
686
727
641
619
627
593
535
536
504
487
477
435
433
393
389
377
339
370
350
341
367
396
408
405
391
396
368
356


Summary of computational transaction
Raw Inputview raw input (R code)
Raw Outputview raw output of R engine
Computing time9 seconds
R Server'George Udny Yule' @ 72.249.76.132

\begin{tabular}{lllllllll}
\hline
Summary of computational transaction \tabularnewline
Raw Input & view raw input (R code)  \tabularnewline
Raw Output & view raw output of R engine  \tabularnewline
Computing time & 9 seconds \tabularnewline
R Server & 'George Udny Yule' @ 72.249.76.132 \tabularnewline
\hline
\end{tabular}
%Source: https://freestatistics.org/blog/index.php?pk=116563&T=0

[TABLE]
[ROW][C]Summary of computational transaction[/C][/ROW]
[ROW][C]Raw Input[/C][C]view raw input (R code) [/C][/ROW]
[ROW][C]Raw Output[/C][C]view raw output of R engine [/C][/ROW]
[ROW][C]Computing time[/C][C]9 seconds[/C][/ROW]
[ROW][C]R Server[/C][C]'George Udny Yule' @ 72.249.76.132[/C][/ROW]
[/TABLE]
Source: https://freestatistics.org/blog/index.php?pk=116563&T=0

Globally Unique Identifier (entire table): ba.freestatistics.org/blog/index.php?pk=116563&T=0

As an alternative you can also use a QR Code:  

The GUIDs for individual cells are displayed in the table below:

Summary of computational transaction
Raw Inputview raw input (R code)
Raw Outputview raw output of R engine
Computing time9 seconds
R Server'George Udny Yule' @ 72.249.76.132


Autocorrelation Function
Time lag kACF(k)T-STATP-value
10.9625677.4560
20.923767.15540
30.8891126.8870
40.8495026.58020
50.8117176.28750
60.7664515.93690
70.7135435.52710
80.6667545.16471e-06
90.6111844.73427e-06
100.5549954.2993.2e-05
110.5031153.89710.000124
120.4434553.4350.00054
130.3955563.0640.001635
140.3469162.68720.004655
150.2914322.25740.013817
160.2414771.87050.033149
170.1910531.47990.072067
180.1426661.10510.136766
190.0972010.75290.227223
200.0482190.37350.355046
210.0046320.03590.485748
22-0.040265-0.31190.378101
23-0.08767-0.67910.249847
24-0.129341-1.00190.160216
25-0.167535-1.29770.099675
26-0.201164-1.55820.062222
27-0.230149-1.78270.039845
28-0.268918-2.0830.020759
29-0.303355-2.34980.011046
30-0.328499-2.54450.006767
31-0.353367-2.73720.004071
32-0.371241-2.87560.002787
33-0.386143-2.99110.002014
34-0.406894-3.15180.001266
35-0.422298-3.27110.000889
36-0.434927-3.36890.000662
37-0.439986-3.40810.000587
38-0.44145-3.41950.000567
39-0.445792-3.45310.000511
40-0.443031-3.43170.000546
41-0.438137-3.39380.000613
42-0.436353-3.380.00064
43-0.425457-3.29560.000826
44-0.412475-3.1950.001115
45-0.396188-3.06890.001612
46-0.378232-2.92980.002396
47-0.36331-2.81420.003302
48-0.340361-2.63640.005325

\begin{tabular}{lllllllll}
\hline
Autocorrelation Function \tabularnewline
Time lag k & ACF(k) & T-STAT & P-value \tabularnewline
1 & 0.962567 & 7.456 & 0 \tabularnewline
2 & 0.92376 & 7.1554 & 0 \tabularnewline
3 & 0.889112 & 6.887 & 0 \tabularnewline
4 & 0.849502 & 6.5802 & 0 \tabularnewline
5 & 0.811717 & 6.2875 & 0 \tabularnewline
6 & 0.766451 & 5.9369 & 0 \tabularnewline
7 & 0.713543 & 5.5271 & 0 \tabularnewline
8 & 0.666754 & 5.1647 & 1e-06 \tabularnewline
9 & 0.611184 & 4.7342 & 7e-06 \tabularnewline
10 & 0.554995 & 4.299 & 3.2e-05 \tabularnewline
11 & 0.503115 & 3.8971 & 0.000124 \tabularnewline
12 & 0.443455 & 3.435 & 0.00054 \tabularnewline
13 & 0.395556 & 3.064 & 0.001635 \tabularnewline
14 & 0.346916 & 2.6872 & 0.004655 \tabularnewline
15 & 0.291432 & 2.2574 & 0.013817 \tabularnewline
16 & 0.241477 & 1.8705 & 0.033149 \tabularnewline
17 & 0.191053 & 1.4799 & 0.072067 \tabularnewline
18 & 0.142666 & 1.1051 & 0.136766 \tabularnewline
19 & 0.097201 & 0.7529 & 0.227223 \tabularnewline
20 & 0.048219 & 0.3735 & 0.355046 \tabularnewline
21 & 0.004632 & 0.0359 & 0.485748 \tabularnewline
22 & -0.040265 & -0.3119 & 0.378101 \tabularnewline
23 & -0.08767 & -0.6791 & 0.249847 \tabularnewline
24 & -0.129341 & -1.0019 & 0.160216 \tabularnewline
25 & -0.167535 & -1.2977 & 0.099675 \tabularnewline
26 & -0.201164 & -1.5582 & 0.062222 \tabularnewline
27 & -0.230149 & -1.7827 & 0.039845 \tabularnewline
28 & -0.268918 & -2.083 & 0.020759 \tabularnewline
29 & -0.303355 & -2.3498 & 0.011046 \tabularnewline
30 & -0.328499 & -2.5445 & 0.006767 \tabularnewline
31 & -0.353367 & -2.7372 & 0.004071 \tabularnewline
32 & -0.371241 & -2.8756 & 0.002787 \tabularnewline
33 & -0.386143 & -2.9911 & 0.002014 \tabularnewline
34 & -0.406894 & -3.1518 & 0.001266 \tabularnewline
35 & -0.422298 & -3.2711 & 0.000889 \tabularnewline
36 & -0.434927 & -3.3689 & 0.000662 \tabularnewline
37 & -0.439986 & -3.4081 & 0.000587 \tabularnewline
38 & -0.44145 & -3.4195 & 0.000567 \tabularnewline
39 & -0.445792 & -3.4531 & 0.000511 \tabularnewline
40 & -0.443031 & -3.4317 & 0.000546 \tabularnewline
41 & -0.438137 & -3.3938 & 0.000613 \tabularnewline
42 & -0.436353 & -3.38 & 0.00064 \tabularnewline
43 & -0.425457 & -3.2956 & 0.000826 \tabularnewline
44 & -0.412475 & -3.195 & 0.001115 \tabularnewline
45 & -0.396188 & -3.0689 & 0.001612 \tabularnewline
46 & -0.378232 & -2.9298 & 0.002396 \tabularnewline
47 & -0.36331 & -2.8142 & 0.003302 \tabularnewline
48 & -0.340361 & -2.6364 & 0.005325 \tabularnewline
\hline
\end{tabular}
%Source: https://freestatistics.org/blog/index.php?pk=116563&T=1

[TABLE]
[ROW][C]Autocorrelation Function[/C][/ROW]
[ROW][C]Time lag k[/C][C]ACF(k)[/C][C]T-STAT[/C][C]P-value[/C][/ROW]
[ROW][C]1[/C][C]0.962567[/C][C]7.456[/C][C]0[/C][/ROW]
[ROW][C]2[/C][C]0.92376[/C][C]7.1554[/C][C]0[/C][/ROW]
[ROW][C]3[/C][C]0.889112[/C][C]6.887[/C][C]0[/C][/ROW]
[ROW][C]4[/C][C]0.849502[/C][C]6.5802[/C][C]0[/C][/ROW]
[ROW][C]5[/C][C]0.811717[/C][C]6.2875[/C][C]0[/C][/ROW]
[ROW][C]6[/C][C]0.766451[/C][C]5.9369[/C][C]0[/C][/ROW]
[ROW][C]7[/C][C]0.713543[/C][C]5.5271[/C][C]0[/C][/ROW]
[ROW][C]8[/C][C]0.666754[/C][C]5.1647[/C][C]1e-06[/C][/ROW]
[ROW][C]9[/C][C]0.611184[/C][C]4.7342[/C][C]7e-06[/C][/ROW]
[ROW][C]10[/C][C]0.554995[/C][C]4.299[/C][C]3.2e-05[/C][/ROW]
[ROW][C]11[/C][C]0.503115[/C][C]3.8971[/C][C]0.000124[/C][/ROW]
[ROW][C]12[/C][C]0.443455[/C][C]3.435[/C][C]0.00054[/C][/ROW]
[ROW][C]13[/C][C]0.395556[/C][C]3.064[/C][C]0.001635[/C][/ROW]
[ROW][C]14[/C][C]0.346916[/C][C]2.6872[/C][C]0.004655[/C][/ROW]
[ROW][C]15[/C][C]0.291432[/C][C]2.2574[/C][C]0.013817[/C][/ROW]
[ROW][C]16[/C][C]0.241477[/C][C]1.8705[/C][C]0.033149[/C][/ROW]
[ROW][C]17[/C][C]0.191053[/C][C]1.4799[/C][C]0.072067[/C][/ROW]
[ROW][C]18[/C][C]0.142666[/C][C]1.1051[/C][C]0.136766[/C][/ROW]
[ROW][C]19[/C][C]0.097201[/C][C]0.7529[/C][C]0.227223[/C][/ROW]
[ROW][C]20[/C][C]0.048219[/C][C]0.3735[/C][C]0.355046[/C][/ROW]
[ROW][C]21[/C][C]0.004632[/C][C]0.0359[/C][C]0.485748[/C][/ROW]
[ROW][C]22[/C][C]-0.040265[/C][C]-0.3119[/C][C]0.378101[/C][/ROW]
[ROW][C]23[/C][C]-0.08767[/C][C]-0.6791[/C][C]0.249847[/C][/ROW]
[ROW][C]24[/C][C]-0.129341[/C][C]-1.0019[/C][C]0.160216[/C][/ROW]
[ROW][C]25[/C][C]-0.167535[/C][C]-1.2977[/C][C]0.099675[/C][/ROW]
[ROW][C]26[/C][C]-0.201164[/C][C]-1.5582[/C][C]0.062222[/C][/ROW]
[ROW][C]27[/C][C]-0.230149[/C][C]-1.7827[/C][C]0.039845[/C][/ROW]
[ROW][C]28[/C][C]-0.268918[/C][C]-2.083[/C][C]0.020759[/C][/ROW]
[ROW][C]29[/C][C]-0.303355[/C][C]-2.3498[/C][C]0.011046[/C][/ROW]
[ROW][C]30[/C][C]-0.328499[/C][C]-2.5445[/C][C]0.006767[/C][/ROW]
[ROW][C]31[/C][C]-0.353367[/C][C]-2.7372[/C][C]0.004071[/C][/ROW]
[ROW][C]32[/C][C]-0.371241[/C][C]-2.8756[/C][C]0.002787[/C][/ROW]
[ROW][C]33[/C][C]-0.386143[/C][C]-2.9911[/C][C]0.002014[/C][/ROW]
[ROW][C]34[/C][C]-0.406894[/C][C]-3.1518[/C][C]0.001266[/C][/ROW]
[ROW][C]35[/C][C]-0.422298[/C][C]-3.2711[/C][C]0.000889[/C][/ROW]
[ROW][C]36[/C][C]-0.434927[/C][C]-3.3689[/C][C]0.000662[/C][/ROW]
[ROW][C]37[/C][C]-0.439986[/C][C]-3.4081[/C][C]0.000587[/C][/ROW]
[ROW][C]38[/C][C]-0.44145[/C][C]-3.4195[/C][C]0.000567[/C][/ROW]
[ROW][C]39[/C][C]-0.445792[/C][C]-3.4531[/C][C]0.000511[/C][/ROW]
[ROW][C]40[/C][C]-0.443031[/C][C]-3.4317[/C][C]0.000546[/C][/ROW]
[ROW][C]41[/C][C]-0.438137[/C][C]-3.3938[/C][C]0.000613[/C][/ROW]
[ROW][C]42[/C][C]-0.436353[/C][C]-3.38[/C][C]0.00064[/C][/ROW]
[ROW][C]43[/C][C]-0.425457[/C][C]-3.2956[/C][C]0.000826[/C][/ROW]
[ROW][C]44[/C][C]-0.412475[/C][C]-3.195[/C][C]0.001115[/C][/ROW]
[ROW][C]45[/C][C]-0.396188[/C][C]-3.0689[/C][C]0.001612[/C][/ROW]
[ROW][C]46[/C][C]-0.378232[/C][C]-2.9298[/C][C]0.002396[/C][/ROW]
[ROW][C]47[/C][C]-0.36331[/C][C]-2.8142[/C][C]0.003302[/C][/ROW]
[ROW][C]48[/C][C]-0.340361[/C][C]-2.6364[/C][C]0.005325[/C][/ROW]
[/TABLE]
Source: https://freestatistics.org/blog/index.php?pk=116563&T=1

Globally Unique Identifier (entire table): ba.freestatistics.org/blog/index.php?pk=116563&T=1

As an alternative you can also use a QR Code:  

The GUIDs for individual cells are displayed in the table below:

Autocorrelation Function
Time lag kACF(k)T-STATP-value
10.9625677.4560
20.923767.15540
30.8891126.8870
40.8495026.58020
50.8117176.28750
60.7664515.93690
70.7135435.52710
80.6667545.16471e-06
90.6111844.73427e-06
100.5549954.2993.2e-05
110.5031153.89710.000124
120.4434553.4350.00054
130.3955563.0640.001635
140.3469162.68720.004655
150.2914322.25740.013817
160.2414771.87050.033149
170.1910531.47990.072067
180.1426661.10510.136766
190.0972010.75290.227223
200.0482190.37350.355046
210.0046320.03590.485748
22-0.040265-0.31190.378101
23-0.08767-0.67910.249847
24-0.129341-1.00190.160216
25-0.167535-1.29770.099675
26-0.201164-1.55820.062222
27-0.230149-1.78270.039845
28-0.268918-2.0830.020759
29-0.303355-2.34980.011046
30-0.328499-2.54450.006767
31-0.353367-2.73720.004071
32-0.371241-2.87560.002787
33-0.386143-2.99110.002014
34-0.406894-3.15180.001266
35-0.422298-3.27110.000889
36-0.434927-3.36890.000662
37-0.439986-3.40810.000587
38-0.44145-3.41950.000567
39-0.445792-3.45310.000511
40-0.443031-3.43170.000546
41-0.438137-3.39380.000613
42-0.436353-3.380.00064
43-0.425457-3.29560.000826
44-0.412475-3.1950.001115
45-0.396188-3.06890.001612
46-0.378232-2.92980.002396
47-0.36331-2.81420.003302
48-0.340361-2.63640.005325


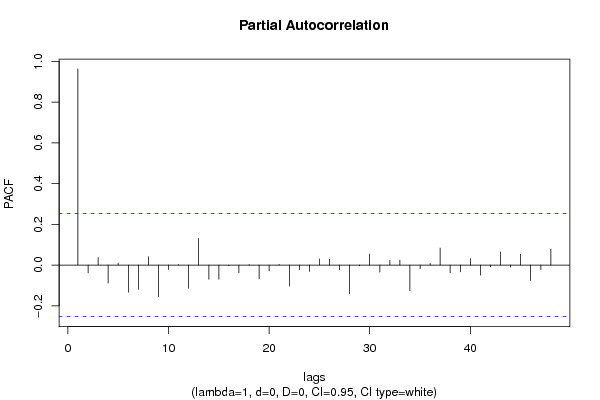
Partial Autocorrelation Function
Time lag kPACF(k)T-STATP-value
10.9625677.4560
2-0.037767-0.29250.385442
30.0368380.28530.388182
4-0.088252-0.68360.24843
50.0097230.07530.470108
6-0.132814-1.02880.153858
7-0.119483-0.92550.179205
80.0411530.31880.375503
9-0.154356-1.19560.118271
10-0.021965-0.17010.432735
110.0028170.02180.491331
12-0.113138-0.87640.192164
130.1306281.01180.157838
14-0.069644-0.53950.295784
15-0.069992-0.54220.29486
16-0.003059-0.02370.490586
17-0.038131-0.29540.384367
180.002790.02160.491414
19-0.066384-0.51420.304498
20-0.028354-0.21960.413454
210.0034720.02690.489317
22-0.103169-0.79910.213679
23-0.023069-0.17870.429391
24-0.030965-0.23990.405632
250.0301280.23340.408135
260.0282390.21870.413797
27-0.022782-0.17650.43026
28-0.139714-1.08220.141742
29-0.003587-0.02780.488963
300.0541520.41950.338188
31-0.033939-0.26290.396769
320.022680.17570.43057
330.0244630.18950.425173
34-0.125352-0.9710.167731
35-0.018209-0.1410.444153
360.0081620.06320.4749
370.0834440.64640.260258
38-0.037759-0.29250.385465
39-0.033277-0.25780.398736
400.0311990.24170.404932
41-0.049472-0.38320.351459
42-0.009039-0.070.472207
430.0645660.50010.309409
44-0.009856-0.07630.469699
450.0529320.410.341629
46-0.076203-0.59030.278615
47-0.021888-0.16950.432968
480.0776350.60140.274934

\begin{tabular}{lllllllll}
\hline
Partial Autocorrelation Function \tabularnewline
Time lag k & PACF(k) & T-STAT & P-value \tabularnewline
1 & 0.962567 & 7.456 & 0 \tabularnewline
2 & -0.037767 & -0.2925 & 0.385442 \tabularnewline
3 & 0.036838 & 0.2853 & 0.388182 \tabularnewline
4 & -0.088252 & -0.6836 & 0.24843 \tabularnewline
5 & 0.009723 & 0.0753 & 0.470108 \tabularnewline
6 & -0.132814 & -1.0288 & 0.153858 \tabularnewline
7 & -0.119483 & -0.9255 & 0.179205 \tabularnewline
8 & 0.041153 & 0.3188 & 0.375503 \tabularnewline
9 & -0.154356 & -1.1956 & 0.118271 \tabularnewline
10 & -0.021965 & -0.1701 & 0.432735 \tabularnewline
11 & 0.002817 & 0.0218 & 0.491331 \tabularnewline
12 & -0.113138 & -0.8764 & 0.192164 \tabularnewline
13 & 0.130628 & 1.0118 & 0.157838 \tabularnewline
14 & -0.069644 & -0.5395 & 0.295784 \tabularnewline
15 & -0.069992 & -0.5422 & 0.29486 \tabularnewline
16 & -0.003059 & -0.0237 & 0.490586 \tabularnewline
17 & -0.038131 & -0.2954 & 0.384367 \tabularnewline
18 & 0.00279 & 0.0216 & 0.491414 \tabularnewline
19 & -0.066384 & -0.5142 & 0.304498 \tabularnewline
20 & -0.028354 & -0.2196 & 0.413454 \tabularnewline
21 & 0.003472 & 0.0269 & 0.489317 \tabularnewline
22 & -0.103169 & -0.7991 & 0.213679 \tabularnewline
23 & -0.023069 & -0.1787 & 0.429391 \tabularnewline
24 & -0.030965 & -0.2399 & 0.405632 \tabularnewline
25 & 0.030128 & 0.2334 & 0.408135 \tabularnewline
26 & 0.028239 & 0.2187 & 0.413797 \tabularnewline
27 & -0.022782 & -0.1765 & 0.43026 \tabularnewline
28 & -0.139714 & -1.0822 & 0.141742 \tabularnewline
29 & -0.003587 & -0.0278 & 0.488963 \tabularnewline
30 & 0.054152 & 0.4195 & 0.338188 \tabularnewline
31 & -0.033939 & -0.2629 & 0.396769 \tabularnewline
32 & 0.02268 & 0.1757 & 0.43057 \tabularnewline
33 & 0.024463 & 0.1895 & 0.425173 \tabularnewline
34 & -0.125352 & -0.971 & 0.167731 \tabularnewline
35 & -0.018209 & -0.141 & 0.444153 \tabularnewline
36 & 0.008162 & 0.0632 & 0.4749 \tabularnewline
37 & 0.083444 & 0.6464 & 0.260258 \tabularnewline
38 & -0.037759 & -0.2925 & 0.385465 \tabularnewline
39 & -0.033277 & -0.2578 & 0.398736 \tabularnewline
40 & 0.031199 & 0.2417 & 0.404932 \tabularnewline
41 & -0.049472 & -0.3832 & 0.351459 \tabularnewline
42 & -0.009039 & -0.07 & 0.472207 \tabularnewline
43 & 0.064566 & 0.5001 & 0.309409 \tabularnewline
44 & -0.009856 & -0.0763 & 0.469699 \tabularnewline
45 & 0.052932 & 0.41 & 0.341629 \tabularnewline
46 & -0.076203 & -0.5903 & 0.278615 \tabularnewline
47 & -0.021888 & -0.1695 & 0.432968 \tabularnewline
48 & 0.077635 & 0.6014 & 0.274934 \tabularnewline
\hline
\end{tabular}
%Source: https://freestatistics.org/blog/index.php?pk=116563&T=2

[TABLE]
[ROW][C]Partial Autocorrelation Function[/C][/ROW]
[ROW][C]Time lag k[/C][C]PACF(k)[/C][C]T-STAT[/C][C]P-value[/C][/ROW]
[ROW][C]1[/C][C]0.962567[/C][C]7.456[/C][C]0[/C][/ROW]
[ROW][C]2[/C][C]-0.037767[/C][C]-0.2925[/C][C]0.385442[/C][/ROW]
[ROW][C]3[/C][C]0.036838[/C][C]0.2853[/C][C]0.388182[/C][/ROW]
[ROW][C]4[/C][C]-0.088252[/C][C]-0.6836[/C][C]0.24843[/C][/ROW]
[ROW][C]5[/C][C]0.009723[/C][C]0.0753[/C][C]0.470108[/C][/ROW]
[ROW][C]6[/C][C]-0.132814[/C][C]-1.0288[/C][C]0.153858[/C][/ROW]
[ROW][C]7[/C][C]-0.119483[/C][C]-0.9255[/C][C]0.179205[/C][/ROW]
[ROW][C]8[/C][C]0.041153[/C][C]0.3188[/C][C]0.375503[/C][/ROW]
[ROW][C]9[/C][C]-0.154356[/C][C]-1.1956[/C][C]0.118271[/C][/ROW]
[ROW][C]10[/C][C]-0.021965[/C][C]-0.1701[/C][C]0.432735[/C][/ROW]
[ROW][C]11[/C][C]0.002817[/C][C]0.0218[/C][C]0.491331[/C][/ROW]
[ROW][C]12[/C][C]-0.113138[/C][C]-0.8764[/C][C]0.192164[/C][/ROW]
[ROW][C]13[/C][C]0.130628[/C][C]1.0118[/C][C]0.157838[/C][/ROW]
[ROW][C]14[/C][C]-0.069644[/C][C]-0.5395[/C][C]0.295784[/C][/ROW]
[ROW][C]15[/C][C]-0.069992[/C][C]-0.5422[/C][C]0.29486[/C][/ROW]
[ROW][C]16[/C][C]-0.003059[/C][C]-0.0237[/C][C]0.490586[/C][/ROW]
[ROW][C]17[/C][C]-0.038131[/C][C]-0.2954[/C][C]0.384367[/C][/ROW]
[ROW][C]18[/C][C]0.00279[/C][C]0.0216[/C][C]0.491414[/C][/ROW]
[ROW][C]19[/C][C]-0.066384[/C][C]-0.5142[/C][C]0.304498[/C][/ROW]
[ROW][C]20[/C][C]-0.028354[/C][C]-0.2196[/C][C]0.413454[/C][/ROW]
[ROW][C]21[/C][C]0.003472[/C][C]0.0269[/C][C]0.489317[/C][/ROW]
[ROW][C]22[/C][C]-0.103169[/C][C]-0.7991[/C][C]0.213679[/C][/ROW]
[ROW][C]23[/C][C]-0.023069[/C][C]-0.1787[/C][C]0.429391[/C][/ROW]
[ROW][C]24[/C][C]-0.030965[/C][C]-0.2399[/C][C]0.405632[/C][/ROW]
[ROW][C]25[/C][C]0.030128[/C][C]0.2334[/C][C]0.408135[/C][/ROW]
[ROW][C]26[/C][C]0.028239[/C][C]0.2187[/C][C]0.413797[/C][/ROW]
[ROW][C]27[/C][C]-0.022782[/C][C]-0.1765[/C][C]0.43026[/C][/ROW]
[ROW][C]28[/C][C]-0.139714[/C][C]-1.0822[/C][C]0.141742[/C][/ROW]
[ROW][C]29[/C][C]-0.003587[/C][C]-0.0278[/C][C]0.488963[/C][/ROW]
[ROW][C]30[/C][C]0.054152[/C][C]0.4195[/C][C]0.338188[/C][/ROW]
[ROW][C]31[/C][C]-0.033939[/C][C]-0.2629[/C][C]0.396769[/C][/ROW]
[ROW][C]32[/C][C]0.02268[/C][C]0.1757[/C][C]0.43057[/C][/ROW]
[ROW][C]33[/C][C]0.024463[/C][C]0.1895[/C][C]0.425173[/C][/ROW]
[ROW][C]34[/C][C]-0.125352[/C][C]-0.971[/C][C]0.167731[/C][/ROW]
[ROW][C]35[/C][C]-0.018209[/C][C]-0.141[/C][C]0.444153[/C][/ROW]
[ROW][C]36[/C][C]0.008162[/C][C]0.0632[/C][C]0.4749[/C][/ROW]
[ROW][C]37[/C][C]0.083444[/C][C]0.6464[/C][C]0.260258[/C][/ROW]
[ROW][C]38[/C][C]-0.037759[/C][C]-0.2925[/C][C]0.385465[/C][/ROW]
[ROW][C]39[/C][C]-0.033277[/C][C]-0.2578[/C][C]0.398736[/C][/ROW]
[ROW][C]40[/C][C]0.031199[/C][C]0.2417[/C][C]0.404932[/C][/ROW]
[ROW][C]41[/C][C]-0.049472[/C][C]-0.3832[/C][C]0.351459[/C][/ROW]
[ROW][C]42[/C][C]-0.009039[/C][C]-0.07[/C][C]0.472207[/C][/ROW]
[ROW][C]43[/C][C]0.064566[/C][C]0.5001[/C][C]0.309409[/C][/ROW]
[ROW][C]44[/C][C]-0.009856[/C][C]-0.0763[/C][C]0.469699[/C][/ROW]
[ROW][C]45[/C][C]0.052932[/C][C]0.41[/C][C]0.341629[/C][/ROW]
[ROW][C]46[/C][C]-0.076203[/C][C]-0.5903[/C][C]0.278615[/C][/ROW]
[ROW][C]47[/C][C]-0.021888[/C][C]-0.1695[/C][C]0.432968[/C][/ROW]
[ROW][C]48[/C][C]0.077635[/C][C]0.6014[/C][C]0.274934[/C][/ROW]
[/TABLE]
Source: https://freestatistics.org/blog/index.php?pk=116563&T=2

Globally Unique Identifier (entire table): ba.freestatistics.org/blog/index.php?pk=116563&T=2

As an alternative you can also use a QR Code:  

The GUIDs for individual cells are displayed in the table below:

Partial Autocorrelation Function
Time lag kPACF(k)T-STATP-value
10.9625677.4560
2-0.037767-0.29250.385442
30.0368380.28530.388182
4-0.088252-0.68360.24843
50.0097230.07530.470108
6-0.132814-1.02880.153858
7-0.119483-0.92550.179205
80.0411530.31880.375503
9-0.154356-1.19560.118271
10-0.021965-0.17010.432735
110.0028170.02180.491331
12-0.113138-0.87640.192164
130.1306281.01180.157838
14-0.069644-0.53950.295784
15-0.069992-0.54220.29486
16-0.003059-0.02370.490586
17-0.038131-0.29540.384367
180.002790.02160.491414
19-0.066384-0.51420.304498
20-0.028354-0.21960.413454
210.0034720.02690.489317
22-0.103169-0.79910.213679
23-0.023069-0.17870.429391
24-0.030965-0.23990.405632
250.0301280.23340.408135
260.0282390.21870.413797
27-0.022782-0.17650.43026
28-0.139714-1.08220.141742
29-0.003587-0.02780.488963
300.0541520.41950.338188
31-0.033939-0.26290.396769
320.022680.17570.43057
330.0244630.18950.425173
34-0.125352-0.9710.167731
35-0.018209-0.1410.444153
360.0081620.06320.4749
370.0834440.64640.260258
38-0.037759-0.29250.385465
39-0.033277-0.25780.398736
400.0311990.24170.404932
41-0.049472-0.38320.351459
42-0.009039-0.070.472207
430.0645660.50010.309409
44-0.009856-0.07630.469699
450.0529320.410.341629
46-0.076203-0.59030.278615
47-0.021888-0.16950.432968
480.0776350.60140.274934


Parameters (Session):
par1 = 48 ; par2 = 1 ; par3 = 0 ; par4 = 0 ; par5 = 12 ; par6 = White Noise ; par7 = 0.95 ;
Parameters (R input):
par1 = 48 ; par2 = 1 ; par3 = 0 ; par4 = 0 ; par5 = 12 ; par6 = White Noise ; par7 = 0.95 ; par8 = ;
R code (references can be found in the software module):
if (par1 == 'Default') {
par1 = 10*log10(length(x))
} else {
par1 <- as.numeric(par1)
}
par2 <- as.numeric(par2)
par3 <- as.numeric(par3)
par4 <- as.numeric(par4)
par5 <- as.numeric(par5)
if (par6 == 'White Noise') par6 <- 'white' else par6 <- 'ma'
par7 <- as.numeric(par7)
if (par8 != '') par8 <- as.numeric(par8)
ox <- x
if (par8 == '') {
if (par2 == 0) {
x <- log(x)
} else {
x <- (x ^ par2 - 1) / par2
}
} else {
x <- log(x,base=par8)
}
if (par3 > 0) x <- diff(x,lag=1,difference=par3)
if (par4 > 0) x <- diff(x,lag=par5,difference=par4)
bitmap(file='picts.png')
op <- par(mfrow=c(2,1))
plot(ox,type='l',main='Original Time Series',xlab='time',ylab='value')
if (par8=='') {
mytitle <- paste('Working Time Series (lambda=',par2,', d=',par3,', D=',par4,')',sep='')
mysub <- paste('(lambda=',par2,', d=',par3,', D=',par4,', CI=', par7, ', CI type=',par6,')',sep='')
} else {
mytitle <- paste('Working Time Series (base=',par8,', d=',par3,', D=',par4,')',sep='')
mysub <- paste('(base=',par8,', d=',par3,', D=',par4,', CI=', par7, ', CI type=',par6,')',sep='')
}
plot(x,type='l', main=mytitle,xlab='time',ylab='value')
par(op)
dev.off()
bitmap(file='pic1.png')
racf <- acf(x, par1, main='Autocorrelation', xlab='time lag', ylab='ACF', ci.type=par6, ci=par7, sub=mysub)
dev.off()
bitmap(file='pic2.png')
rpacf <- pacf(x,par1,main='Partial Autocorrelation',xlab='lags',ylab='PACF',sub=mysub)
dev.off()
(myacf <- c(racf$acf))
(mypacf <- c(rpacf$acf))
lengthx <- length(x)
sqrtn <- sqrt(lengthx)
load(file='createtable')
a<-table.start()
a<-table.row.start(a)
a<-table.element(a,'Autocorrelation Function',4,TRUE)
a<-table.row.end(a)
a<-table.row.start(a)
a<-table.element(a,'Time lag k',header=TRUE)
a<-table.element(a,hyperlink('basics.htm','ACF(k)','click here for more information about the Autocorrelation Function'),header=TRUE)
a<-table.element(a,'T-STAT',header=TRUE)
a<-table.element(a,'P-value',header=TRUE)
a<-table.row.end(a)
for (i in 2:(par1+1)) {
a<-table.row.start(a)
a<-table.element(a,i-1,header=TRUE)
a<-table.element(a,round(myacf[i],6))
mytstat <- myacf[i]*sqrtn
a<-table.element(a,round(mytstat,4))
a<-table.element(a,round(1-pt(abs(mytstat),lengthx),6))
a<-table.row.end(a)
}
a<-table.end(a)
table.save(a,file='mytable.tab')
a<-table.start()
a<-table.row.start(a)
a<-table.element(a,'Partial Autocorrelation Function',4,TRUE)
a<-table.row.end(a)
a<-table.row.start(a)
a<-table.element(a,'Time lag k',header=TRUE)
a<-table.element(a,hyperlink('basics.htm','PACF(k)','click here for more information about the Partial Autocorrelation Function'),header=TRUE)
a<-table.element(a,'T-STAT',header=TRUE)
a<-table.element(a,'P-value',header=TRUE)
a<-table.row.end(a)
for (i in 1:par1) {
a<-table.row.start(a)
a<-table.element(a,i,header=TRUE)
a<-table.element(a,round(mypacf[i],6))
mytstat <- mypacf[i]*sqrtn
a<-table.element(a,round(mytstat,4))
a<-table.element(a,round(1-pt(abs(mytstat),lengthx),6))
a<-table.row.end(a)
}
a<-table.end(a)
table.save(a,file='mytable1.tab')