| Multiple Linear Regression - Estimated Regression Equation |
| Y[t] = + 0.161444463225237 + 0.0791592781596746X[t] + 2.06064556081534Y1[t] -1.51248435858741Y2[t] + 0.399499156624229Y3[t] + 0.00955021927819122Y4[t] + 0.0378650408289318M1[t] -0.0484576135319395M2[t] + 0.0596382358271586M3[t] -0.0446390881700724M4[t] + 0.0169784404865373M5[t] + 0.0241710147035326M6[t] -0.0756529773410106M7[t] -0.0303723197500138M8[t] -0.00954782897581095M9[t] -0.0461532281989728M10[t] -0.000389226894001394M11[t] -0.000475364960323572t + e[t] |
| Multiple Linear Regression - Ordinary Least Squares | |||||
| Variable | Parameter | S.D. | T-STAT H0: parameter = 0 | 2-tail p-value | 1-tail p-value |
| (Intercept) | 0.161444463225237 | 0.083204 | 1.9404 | 0.057986 | 0.028993 |
| X | 0.0791592781596746 | 0.056882 | 1.3916 | 0.170194 | 0.085097 |
| Y1 | 2.06064556081534 | 0.16355 | 12.5995 | 0 | 0 |
| Y2 | -1.51248435858741 | 0.33353 | -4.5348 | 3.6e-05 | 1.8e-05 |
| Y3 | 0.399499156624229 | 0.371107 | 1.0765 | 0.286867 | 0.143434 |
| Y4 | 0.00955021927819122 | 0.19915 | 0.048 | 0.961943 | 0.480972 |
| M1 | 0.0378650408289318 | 0.058331 | 0.6491 | 0.519217 | 0.259609 |
| M2 | -0.0484576135319395 | 0.059371 | -0.8162 | 0.418266 | 0.209133 |
| M3 | 0.0596382358271586 | 0.060524 | 0.9854 | 0.32919 | 0.164595 |
| M4 | -0.0446390881700724 | 0.059125 | -0.755 | 0.453795 | 0.226897 |
| M5 | 0.0169784404865373 | 0.06062 | 0.2801 | 0.780573 | 0.390287 |
| M6 | 0.0241710147035326 | 0.058795 | 0.4111 | 0.68275 | 0.341375 |
| M7 | -0.0756529773410106 | 0.058939 | -1.2836 | 0.205209 | 0.102605 |
| M8 | -0.0303723197500138 | 0.059955 | -0.5066 | 0.614673 | 0.307337 |
| M9 | -0.00954782897581095 | 0.060623 | -0.1575 | 0.875489 | 0.437744 |
| M10 | -0.0461532281989728 | 0.060888 | -0.758 | 0.45201 | 0.226005 |
| M11 | -0.000389226894001394 | 0.060942 | -0.0064 | 0.994929 | 0.497465 |
| t | -0.000475364960323572 | 0.001429 | -0.3326 | 0.740843 | 0.370421 |
| Multiple Linear Regression - Regression Statistics | |
| Multiple R | 0.99576834325729 |
| R-squared | 0.99155459343337 |
| Adjusted R-squared | 0.988683155200714 |
| F-TEST (value) | 345.316358247658 |
| F-TEST (DF numerator) | 17 |
| F-TEST (DF denominator) | 50 |
| p-value | 0 |
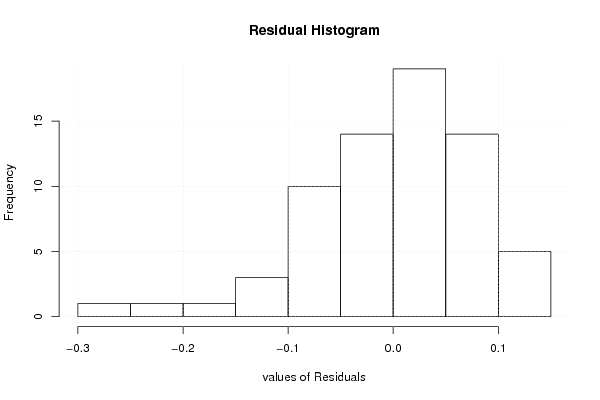
| Multiple Linear Regression - Residual Statistics | |
| Residual Standard Deviation | 0.0952174421747424 |
| Sum Squared Residuals | 0.45331806471502 |
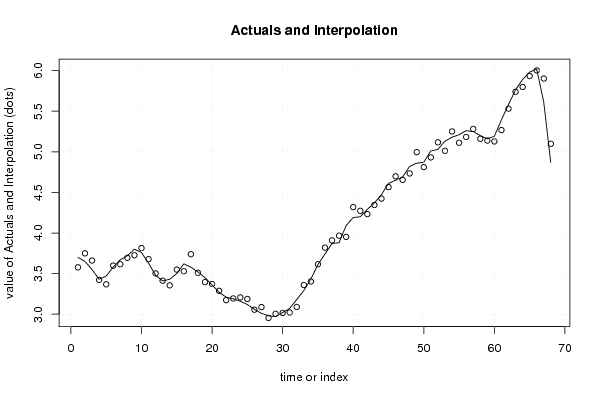
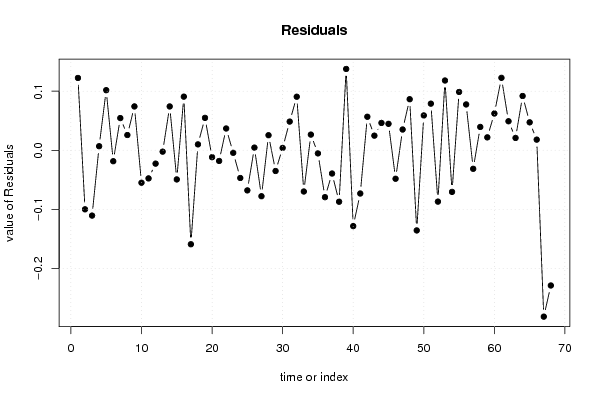
| Multiple Linear Regression - Actuals, Interpolation, and Residuals | |||
| Time or Index | Actuals | Interpolation Forecast | Residuals Prediction Error |
| 1 | 3.7 | 3.57757361459218 | 0.122426385407819 |
| 2 | 3.65 | 3.74989766355371 | -0.0998976635537103 |
| 3 | 3.55 | 3.66050001564694 | -0.110500015646943 |
| 4 | 3.43 | 3.42311043810324 | 0.00688956189675844 |
| 5 | 3.47 | 3.36824861252922 | 0.101751387470783 |
| 6 | 3.58 | 3.59846234062266 | -0.0184623406226591 |
| 7 | 3.67 | 3.61543970024126 | 0.0545602997587431 |
| 8 | 3.72 | 3.69416375385228 | 0.0258362461477184 |
| 9 | 3.8 | 3.72574848143385 | 0.0742515185661449 |
| 10 | 3.76 | 3.81490059240301 | -0.0549005924030069 |
| 11 | 3.63 | 3.6775991351943 | -0.0475991351942975 |
| 12 | 3.48 | 3.50256589205933 | -0.0225658920593253 |
| 13 | 3.41 | 3.41226575169928 | -0.00226575169928146 |
| 14 | 3.43 | 3.35577829777685 | 0.074221702223153 |
| 15 | 3.5 | 3.54931919649325 | -0.0493191964932478 |
| 16 | 3.62 | 3.52916453576559 | 0.0908354642344062 |
| 17 | 3.58 | 3.73903172944161 | -0.159031729441614 |
| 18 | 3.52 | 3.50998093858444 | 0.0100190614155575 |
| 19 | 3.45 | 3.39515063641853 | 0.0548493635814677 |
| 20 | 3.36 | 3.37162586135579 | -0.0116258613557907 |
| 21 | 3.27 | 3.28803883362883 | -0.0180388336288255 |
| 22 | 3.21 | 3.17308560712444 | 0.0369143928755603 |
| 23 | 3.19 | 3.19423566264738 | -0.00423566264737936 |
| 24 | 3.16 | 3.20687123104878 | -0.0468712310487771 |
| 25 | 3.12 | 3.18786175813218 | -0.0678617581321828 |
| 26 | 3.06 | 3.05544945084682 | 0.00455054915317979 |
| 27 | 3.01 | 3.08775459685588 | -0.0777545968558802 |
| 28 | 2.98 | 2.95445221852949 | 0.0255477814705124 |
| 29 | 2.97 | 3.00504727516210 | -0.0350472751621032 |
| 30 | 3.02 | 3.01598458858034 | 0.00401541141965914 |
| 31 | 3.07 | 3.02137986753948 | 0.0486201324605214 |
| 32 | 3.18 | 3.08931172213696 | 0.09068827786304 |
| 33 | 3.29 | 3.35974637550926 | -0.0697463755092619 |
| 34 | 3.43 | 3.40341581236597 | 0.0265841876340307 |
| 35 | 3.61 | 3.61524396597273 | -0.00524396597272548 |
| 36 | 3.74 | 3.81932165000019 | -0.0793216500001923 |
| 37 | 3.87 | 3.90932847027706 | -0.0393284702770553 |
| 38 | 3.88 | 3.9670382861368 | -0.0870382861367992 |
| 39 | 4.09 | 3.95229618935859 | 0.137703810641412 |
| 40 | 4.19 | 4.3183306434537 | -0.128330643453695 |
| 41 | 4.2 | 4.27315216800057 | -0.073152168000568 |
| 42 | 4.29 | 4.23321772209052 | 0.0567822779094791 |
| 43 | 4.37 | 4.345207083684 | 0.024792916315996 |
| 44 | 4.47 | 4.4236904424011 | 0.0463095575989001 |
| 45 | 4.61 | 4.56515580189848 | 0.0448441981015185 |
| 46 | 4.65 | 4.69813643263538 | -0.0481364326353802 |
| 47 | 4.69 | 4.65481701441508 | 0.0351829855849185 |
| 48 | 4.82 | 4.73354222829309 | 0.0864577717069119 |
| 49 | 4.86 | 4.99563344968811 | -0.135633449688110 |
| 50 | 4.87 | 4.81100026121926 | 0.0589997387807372 |
| 51 | 5.01 | 4.93104472601497 | 0.0789552739850286 |
| 52 | 5.03 | 5.11687906675682 | -0.0868790667568239 |
| 53 | 5.13 | 5.01186333180455 | 0.118136668195449 |
| 54 | 5.18 | 5.25042079409118 | -0.0704207940911813 |
| 55 | 5.21 | 5.11123229309977 | 0.0987677069002278 |
| 56 | 5.26 | 5.18237365467352 | 0.0776263453264774 |
| 57 | 5.25 | 5.28131050752958 | -0.0313105075295761 |
| 58 | 5.2 | 5.1604615554712 | 0.0395384445287960 |
| 59 | 5.16 | 5.13810422177052 | 0.021895778229484 |
| 60 | 5.19 | 5.12769899859862 | 0.0623010014013826 |
| 61 | 5.39 | 5.26733695561119 | 0.122663044388810 |
| 62 | 5.58 | 5.53083604046656 | 0.0491639595334396 |
| 63 | 5.76 | 5.73908527563037 | 0.0209147243696306 |
| 64 | 5.89 | 5.79806309739116 | 0.091936902608842 |
| 65 | 5.98 | 5.93265688306195 | 0.0473431169380536 |
| 66 | 6.02 | 6.00193361603085 | 0.0180663839691445 |
| 67 | 5.62 | 5.90159041901696 | -0.281590419016956 |
| 68 | 4.87 | 5.09883456558035 | -0.228834565580345 |
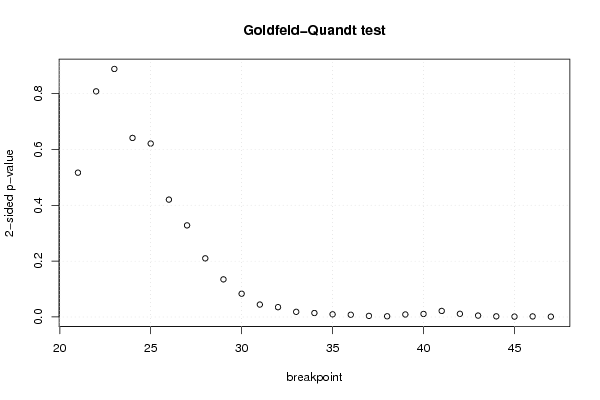
| Goldfeld-Quandt test for Heteroskedasticity | |||
| p-values | Alternative Hypothesis | ||
| breakpoint index | greater | 2-sided | less |
| 21 | 0.74166429384776 | 0.516671412304479 | 0.258335706152240 |
| 22 | 0.596034891411991 | 0.807930217176018 | 0.403965108588009 |
| 23 | 0.444057105083052 | 0.888114210166104 | 0.555942894916948 |
| 24 | 0.320567637693601 | 0.641135275387202 | 0.679432362306399 |
| 25 | 0.310497870889949 | 0.620995741779899 | 0.68950212911005 |
| 26 | 0.210115102065215 | 0.420230204130431 | 0.789884897934785 |
| 27 | 0.164027879371093 | 0.328055758742185 | 0.835972120628907 |
| 28 | 0.104988031577055 | 0.20997606315411 | 0.895011968422945 |
| 29 | 0.0673906416709273 | 0.134781283341855 | 0.932609358329073 |
| 30 | 0.0416630941362966 | 0.0833261882725932 | 0.958336905863703 |
| 31 | 0.0222568890266107 | 0.0445137780532214 | 0.97774311097339 |
| 32 | 0.0176115951322445 | 0.035223190264489 | 0.982388404867755 |
| 33 | 0.0092342052825104 | 0.0184684105650208 | 0.99076579471749 |
| 34 | 0.00709021344132131 | 0.0141804268826426 | 0.992909786558679 |
| 35 | 0.0047942124170052 | 0.0095884248340104 | 0.995205787582995 |
| 36 | 0.00398268961211176 | 0.00796537922422352 | 0.996017310387888 |
| 37 | 0.00192965010760882 | 0.00385930021521765 | 0.998070349892391 |
| 38 | 0.00129384957505266 | 0.00258769915010532 | 0.998706150424947 |
| 39 | 0.00451371166876899 | 0.00902742333753798 | 0.99548628833123 |
| 40 | 0.00543436666309991 | 0.0108687333261998 | 0.9945656333369 |
| 41 | 0.0108542905009707 | 0.0217085810019413 | 0.98914570949903 |
| 42 | 0.00568019891541294 | 0.0113603978308259 | 0.994319801084587 |
| 43 | 0.00252471351507257 | 0.00504942703014514 | 0.997475286484927 |
| 44 | 0.00115393796177871 | 0.00230787592355742 | 0.998846062038221 |
| 45 | 0.000646263882195267 | 0.00129252776439053 | 0.999353736117805 |
| 46 | 0.00101450776107983 | 0.00202901552215966 | 0.99898549223892 |
| 47 | 0.000601725610441741 | 0.00120345122088348 | 0.999398274389558 |
| Meta Analysis of Goldfeld-Quandt test for Heteroskedasticity | |||
| Description | # significant tests | % significant tests | OK/NOK |
| 1% type I error level | 10 | 0.370370370370370 | NOK |
| 5% type I error level | 17 | 0.62962962962963 | NOK |
| 10% type I error level | 18 | 0.666666666666667 | NOK |