Free Statistics

of Irreproducible Research!

Author's title

Author*The author of this computation has been verified*
R Software Modulerwasp_autocorrelation.wasp
Title produced by software(Partial) Autocorrelation Function
Date of computationTue, 28 Dec 2010 19:10:02 +0000
Cite this page as followsStatistical Computations at FreeStatistics.org, Office for Research Development and Education, URL https://freestatistics.org/blog/index.php?v=date/2010/Dec/28/t1293563322wzxba0g5an7f2xu.htm/, Retrieved Sun, 05 May 2024 02:37:46 +0000
Statistical Computations at FreeStatistics.org, Office for Research Development and Education, URL https://freestatistics.org/blog/index.php?pk=116499, Retrieved Sun, 05 May 2024 02:37:46 +0000
QR Codes:

Original text written by user:
IsPrivate?No (this computation is public)
User-defined keywords
Estimated Impact98
Family? (F = Feedback message, R = changed R code, M = changed R Module, P = changed Parameters, D = changed Data)
-       [(Partial) Autocorrelation Function] [] [2010-12-28 19:10:02] [0956ee981dded61b2e7128dae94e5715] [Current]
Feedback Forum

Post a new message
Dataseries X:
9.1
9.27
9.59
10.64
12.17
12.81
12.33
11.92
11.92
12.17
12.33
10.39
10.96
11.44
11.36
11.84
11.2
12.17
11.92
11.92
12.73
12.89
15.47
17
14.91
13.62
12.89
12.33
12.33
11.36
10.96
11.36
10.15
9.35
9.59
9.59
9.67
9.19
9.02
8.94
8.38
8.3
8.14
8.3
8.54
9.02
9.27
9.02
9.02
8.38
8.46
7.9
7.17
7.25
7.33
7.41
7.98
7.65
7.41
7.57
7.41
7.49
7.49
8.14
8.38
8.22
8.46
7.98
8.06
8.06
8.54
9.75
12.17
15.23
15.79
15.39
14.34
13.78
13.21
12.65
11.84
11.84
11.6
11.04
10.64
10.39
10.15
9.67
9.67
9.91
9.91
9.91
9.71
9.51
9.32
9.12
9.22
9.22
8.92
8.82
8.82
8.82
8.72
8.34
8.14
8.14
8.04
8.04
8.04
8.14
8.24
8.34
8.53
8.63
8.53
8.72
9.11
8.92
8.82
9.21
9.21
9.4
9.6
9.69
9.74
10.64
12.82
15.06
17.3
20.04
17.9
16.77
17.07
17.1
17.53
17.7
17.37
17.13
17.13
16.7
15.23
13.66
12.96
13.39
13.73
13.86
14.36
14.09
13.89
14.03
14.73
16.3
17.3
17.6
18
19.54
22.34
24.08
23.85
24.08
25.98
26.55
26.75
26.88
26.78
27.18
28.15
28.92
29.16
29.62
29.92
30.26
30.62
31.03
31.56
32.46
33.4
34.8
36.67
38.84
40.51
41.85
44.45
49.33
53.84
56.94
60.61
65.22
72.57
82.38
90.93
96.5
99.6
103.9
107.6
109.6
113.6
118.3
124
130.7
136.2
140.3
144.5
148.2
152.4
156.9
160.5
163
166.6
172.2
177.1
179.9
184
188.9
195.3
201.6
207.34
215.3
214.54


Summary of computational transaction
Raw Inputview raw input (R code)
Raw Outputview raw output of R engine
Computing time2 seconds
R Server'Gwilym Jenkins' @ 72.249.127.135

\begin{tabular}{lllllllll}
\hline
Summary of computational transaction \tabularnewline
Raw Input & view raw input (R code)  \tabularnewline
Raw Output & view raw output of R engine  \tabularnewline
Computing time & 2 seconds \tabularnewline
R Server & 'Gwilym Jenkins' @ 72.249.127.135 \tabularnewline
\hline
\end{tabular}
%Source: https://freestatistics.org/blog/index.php?pk=116499&T=0

[TABLE]
[ROW][C]Summary of computational transaction[/C][/ROW]
[ROW][C]Raw Input[/C][C]view raw input (R code) [/C][/ROW]
[ROW][C]Raw Output[/C][C]view raw output of R engine [/C][/ROW]
[ROW][C]Computing time[/C][C]2 seconds[/C][/ROW]
[ROW][C]R Server[/C][C]'Gwilym Jenkins' @ 72.249.127.135[/C][/ROW]
[/TABLE]
Source: https://freestatistics.org/blog/index.php?pk=116499&T=0

Globally Unique Identifier (entire table): ba.freestatistics.org/blog/index.php?pk=116499&T=0

As an alternative you can also use a QR Code:  

The GUIDs for individual cells are displayed in the table below:

Summary of computational transaction
Raw Inputview raw input (R code)
Raw Outputview raw output of R engine
Computing time2 seconds
R Server'Gwilym Jenkins' @ 72.249.127.135


Autocorrelation Function
Time lag kACF(k)T-STATP-value
1-0.079452-1.17040.121561
2-0.203949-3.00440.001487
3-0.04857-0.71550.23754
4-0.145996-2.15070.016304
50.1015431.49580.068076
6-0.054226-0.79880.212642
7-0.019461-0.28670.387314
80.0250330.36880.356335
9-0.045746-0.67390.25055
100.0793811.16930.121773
110.0392960.57890.281641
12-0.05824-0.85790.195939
130.0016380.02410.490388
14-0.049832-0.73410.231847
15-0.010996-0.1620.435736
160.0527310.77680.21907
170.0309920.45650.324227
180.0313050.46120.322575
19-0.00604-0.0890.464594
20-0.062768-0.92460.178094
21-0.037077-0.54620.292752
22-0.068187-1.00450.158138
230.0784451.15560.124564

\begin{tabular}{lllllllll}
\hline
Autocorrelation Function \tabularnewline
Time lag k & ACF(k) & T-STAT & P-value \tabularnewline
1 & -0.079452 & -1.1704 & 0.121561 \tabularnewline
2 & -0.203949 & -3.0044 & 0.001487 \tabularnewline
3 & -0.04857 & -0.7155 & 0.23754 \tabularnewline
4 & -0.145996 & -2.1507 & 0.016304 \tabularnewline
5 & 0.101543 & 1.4958 & 0.068076 \tabularnewline
6 & -0.054226 & -0.7988 & 0.212642 \tabularnewline
7 & -0.019461 & -0.2867 & 0.387314 \tabularnewline
8 & 0.025033 & 0.3688 & 0.356335 \tabularnewline
9 & -0.045746 & -0.6739 & 0.25055 \tabularnewline
10 & 0.079381 & 1.1693 & 0.121773 \tabularnewline
11 & 0.039296 & 0.5789 & 0.281641 \tabularnewline
12 & -0.05824 & -0.8579 & 0.195939 \tabularnewline
13 & 0.001638 & 0.0241 & 0.490388 \tabularnewline
14 & -0.049832 & -0.7341 & 0.231847 \tabularnewline
15 & -0.010996 & -0.162 & 0.435736 \tabularnewline
16 & 0.052731 & 0.7768 & 0.21907 \tabularnewline
17 & 0.030992 & 0.4565 & 0.324227 \tabularnewline
18 & 0.031305 & 0.4612 & 0.322575 \tabularnewline
19 & -0.00604 & -0.089 & 0.464594 \tabularnewline
20 & -0.062768 & -0.9246 & 0.178094 \tabularnewline
21 & -0.037077 & -0.5462 & 0.292752 \tabularnewline
22 & -0.068187 & -1.0045 & 0.158138 \tabularnewline
23 & 0.078445 & 1.1556 & 0.124564 \tabularnewline
\hline
\end{tabular}
%Source: https://freestatistics.org/blog/index.php?pk=116499&T=1

[TABLE]
[ROW][C]Autocorrelation Function[/C][/ROW]
[ROW][C]Time lag k[/C][C]ACF(k)[/C][C]T-STAT[/C][C]P-value[/C][/ROW]
[ROW][C]1[/C][C]-0.079452[/C][C]-1.1704[/C][C]0.121561[/C][/ROW]
[ROW][C]2[/C][C]-0.203949[/C][C]-3.0044[/C][C]0.001487[/C][/ROW]
[ROW][C]3[/C][C]-0.04857[/C][C]-0.7155[/C][C]0.23754[/C][/ROW]
[ROW][C]4[/C][C]-0.145996[/C][C]-2.1507[/C][C]0.016304[/C][/ROW]
[ROW][C]5[/C][C]0.101543[/C][C]1.4958[/C][C]0.068076[/C][/ROW]
[ROW][C]6[/C][C]-0.054226[/C][C]-0.7988[/C][C]0.212642[/C][/ROW]
[ROW][C]7[/C][C]-0.019461[/C][C]-0.2867[/C][C]0.387314[/C][/ROW]
[ROW][C]8[/C][C]0.025033[/C][C]0.3688[/C][C]0.356335[/C][/ROW]
[ROW][C]9[/C][C]-0.045746[/C][C]-0.6739[/C][C]0.25055[/C][/ROW]
[ROW][C]10[/C][C]0.079381[/C][C]1.1693[/C][C]0.121773[/C][/ROW]
[ROW][C]11[/C][C]0.039296[/C][C]0.5789[/C][C]0.281641[/C][/ROW]
[ROW][C]12[/C][C]-0.05824[/C][C]-0.8579[/C][C]0.195939[/C][/ROW]
[ROW][C]13[/C][C]0.001638[/C][C]0.0241[/C][C]0.490388[/C][/ROW]
[ROW][C]14[/C][C]-0.049832[/C][C]-0.7341[/C][C]0.231847[/C][/ROW]
[ROW][C]15[/C][C]-0.010996[/C][C]-0.162[/C][C]0.435736[/C][/ROW]
[ROW][C]16[/C][C]0.052731[/C][C]0.7768[/C][C]0.21907[/C][/ROW]
[ROW][C]17[/C][C]0.030992[/C][C]0.4565[/C][C]0.324227[/C][/ROW]
[ROW][C]18[/C][C]0.031305[/C][C]0.4612[/C][C]0.322575[/C][/ROW]
[ROW][C]19[/C][C]-0.00604[/C][C]-0.089[/C][C]0.464594[/C][/ROW]
[ROW][C]20[/C][C]-0.062768[/C][C]-0.9246[/C][C]0.178094[/C][/ROW]
[ROW][C]21[/C][C]-0.037077[/C][C]-0.5462[/C][C]0.292752[/C][/ROW]
[ROW][C]22[/C][C]-0.068187[/C][C]-1.0045[/C][C]0.158138[/C][/ROW]
[ROW][C]23[/C][C]0.078445[/C][C]1.1556[/C][C]0.124564[/C][/ROW]
[/TABLE]
Source: https://freestatistics.org/blog/index.php?pk=116499&T=1

Globally Unique Identifier (entire table): ba.freestatistics.org/blog/index.php?pk=116499&T=1

As an alternative you can also use a QR Code:  

The GUIDs for individual cells are displayed in the table below:

Autocorrelation Function
Time lag kACF(k)T-STATP-value
1-0.079452-1.17040.121561
2-0.203949-3.00440.001487
3-0.04857-0.71550.23754
4-0.145996-2.15070.016304
50.1015431.49580.068076
6-0.054226-0.79880.212642
7-0.019461-0.28670.387314
80.0250330.36880.356335
9-0.045746-0.67390.25055
100.0793811.16930.121773
110.0392960.57890.281641
12-0.05824-0.85790.195939
130.0016380.02410.490388
14-0.049832-0.73410.231847
15-0.010996-0.1620.435736
160.0527310.77680.21907
170.0309920.45650.324227
180.0313050.46120.322575
19-0.00604-0.0890.464594
20-0.062768-0.92460.178094
21-0.037077-0.54620.292752
22-0.068187-1.00450.158138
230.0784451.15560.124564


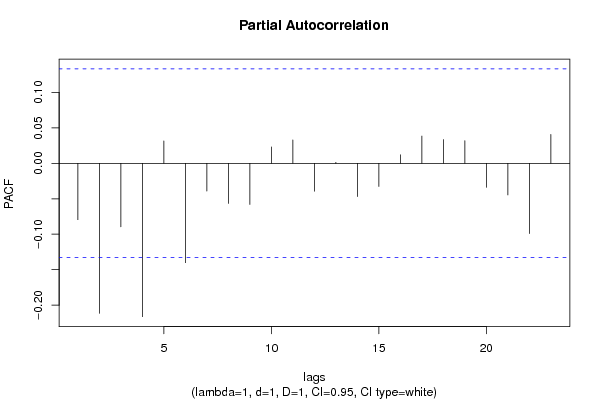
Partial Autocorrelation Function
Time lag kPACF(k)T-STATP-value
1-0.079452-1.17040.121561
2-0.211597-3.1170.001037
3-0.089565-1.31940.094217
4-0.216255-3.18560.000828
50.0315920.46540.321066
6-0.140195-2.06520.020046
7-0.039127-0.57640.28248
8-0.056683-0.8350.202318
9-0.058032-0.85490.196784
100.0231120.34050.366922
110.0329990.48610.31369
12-0.039314-0.57910.281551
130.0014070.02070.49174
14-0.046885-0.69070.245258
15-0.032591-0.48010.315822
160.0120010.17680.429919
170.0384390.56620.285907
180.0335260.49390.310951
190.0318570.46930.319667
20-0.033837-0.49850.309335
21-0.044648-0.65770.255714
22-0.099027-1.45880.073038
230.0406270.59850.275074

\begin{tabular}{lllllllll}
\hline
Partial Autocorrelation Function \tabularnewline
Time lag k & PACF(k) & T-STAT & P-value \tabularnewline
1 & -0.079452 & -1.1704 & 0.121561 \tabularnewline
2 & -0.211597 & -3.117 & 0.001037 \tabularnewline
3 & -0.089565 & -1.3194 & 0.094217 \tabularnewline
4 & -0.216255 & -3.1856 & 0.000828 \tabularnewline
5 & 0.031592 & 0.4654 & 0.321066 \tabularnewline
6 & -0.140195 & -2.0652 & 0.020046 \tabularnewline
7 & -0.039127 & -0.5764 & 0.28248 \tabularnewline
8 & -0.056683 & -0.835 & 0.202318 \tabularnewline
9 & -0.058032 & -0.8549 & 0.196784 \tabularnewline
10 & 0.023112 & 0.3405 & 0.366922 \tabularnewline
11 & 0.032999 & 0.4861 & 0.31369 \tabularnewline
12 & -0.039314 & -0.5791 & 0.281551 \tabularnewline
13 & 0.001407 & 0.0207 & 0.49174 \tabularnewline
14 & -0.046885 & -0.6907 & 0.245258 \tabularnewline
15 & -0.032591 & -0.4801 & 0.315822 \tabularnewline
16 & 0.012001 & 0.1768 & 0.429919 \tabularnewline
17 & 0.038439 & 0.5662 & 0.285907 \tabularnewline
18 & 0.033526 & 0.4939 & 0.310951 \tabularnewline
19 & 0.031857 & 0.4693 & 0.319667 \tabularnewline
20 & -0.033837 & -0.4985 & 0.309335 \tabularnewline
21 & -0.044648 & -0.6577 & 0.255714 \tabularnewline
22 & -0.099027 & -1.4588 & 0.073038 \tabularnewline
23 & 0.040627 & 0.5985 & 0.275074 \tabularnewline
\hline
\end{tabular}
%Source: https://freestatistics.org/blog/index.php?pk=116499&T=2

[TABLE]
[ROW][C]Partial Autocorrelation Function[/C][/ROW]
[ROW][C]Time lag k[/C][C]PACF(k)[/C][C]T-STAT[/C][C]P-value[/C][/ROW]
[ROW][C]1[/C][C]-0.079452[/C][C]-1.1704[/C][C]0.121561[/C][/ROW]
[ROW][C]2[/C][C]-0.211597[/C][C]-3.117[/C][C]0.001037[/C][/ROW]
[ROW][C]3[/C][C]-0.089565[/C][C]-1.3194[/C][C]0.094217[/C][/ROW]
[ROW][C]4[/C][C]-0.216255[/C][C]-3.1856[/C][C]0.000828[/C][/ROW]
[ROW][C]5[/C][C]0.031592[/C][C]0.4654[/C][C]0.321066[/C][/ROW]
[ROW][C]6[/C][C]-0.140195[/C][C]-2.0652[/C][C]0.020046[/C][/ROW]
[ROW][C]7[/C][C]-0.039127[/C][C]-0.5764[/C][C]0.28248[/C][/ROW]
[ROW][C]8[/C][C]-0.056683[/C][C]-0.835[/C][C]0.202318[/C][/ROW]
[ROW][C]9[/C][C]-0.058032[/C][C]-0.8549[/C][C]0.196784[/C][/ROW]
[ROW][C]10[/C][C]0.023112[/C][C]0.3405[/C][C]0.366922[/C][/ROW]
[ROW][C]11[/C][C]0.032999[/C][C]0.4861[/C][C]0.31369[/C][/ROW]
[ROW][C]12[/C][C]-0.039314[/C][C]-0.5791[/C][C]0.281551[/C][/ROW]
[ROW][C]13[/C][C]0.001407[/C][C]0.0207[/C][C]0.49174[/C][/ROW]
[ROW][C]14[/C][C]-0.046885[/C][C]-0.6907[/C][C]0.245258[/C][/ROW]
[ROW][C]15[/C][C]-0.032591[/C][C]-0.4801[/C][C]0.315822[/C][/ROW]
[ROW][C]16[/C][C]0.012001[/C][C]0.1768[/C][C]0.429919[/C][/ROW]
[ROW][C]17[/C][C]0.038439[/C][C]0.5662[/C][C]0.285907[/C][/ROW]
[ROW][C]18[/C][C]0.033526[/C][C]0.4939[/C][C]0.310951[/C][/ROW]
[ROW][C]19[/C][C]0.031857[/C][C]0.4693[/C][C]0.319667[/C][/ROW]
[ROW][C]20[/C][C]-0.033837[/C][C]-0.4985[/C][C]0.309335[/C][/ROW]
[ROW][C]21[/C][C]-0.044648[/C][C]-0.6577[/C][C]0.255714[/C][/ROW]
[ROW][C]22[/C][C]-0.099027[/C][C]-1.4588[/C][C]0.073038[/C][/ROW]
[ROW][C]23[/C][C]0.040627[/C][C]0.5985[/C][C]0.275074[/C][/ROW]
[/TABLE]
Source: https://freestatistics.org/blog/index.php?pk=116499&T=2

Globally Unique Identifier (entire table): ba.freestatistics.org/blog/index.php?pk=116499&T=2

As an alternative you can also use a QR Code:  

The GUIDs for individual cells are displayed in the table below:

Partial Autocorrelation Function
Time lag kPACF(k)T-STATP-value
1-0.079452-1.17040.121561
2-0.211597-3.1170.001037
3-0.089565-1.31940.094217
4-0.216255-3.18560.000828
50.0315920.46540.321066
6-0.140195-2.06520.020046
7-0.039127-0.57640.28248
8-0.056683-0.8350.202318
9-0.058032-0.85490.196784
100.0231120.34050.366922
110.0329990.48610.31369
12-0.039314-0.57910.281551
130.0014070.02070.49174
14-0.046885-0.69070.245258
15-0.032591-0.48010.315822
160.0120010.17680.429919
170.0384390.56620.285907
180.0335260.49390.310951
190.0318570.46930.319667
20-0.033837-0.49850.309335
21-0.044648-0.65770.255714
22-0.099027-1.45880.073038
230.0406270.59850.275074


Parameters (Session):
par1 = Default ; par2 = 1 ; par3 = 1 ; par4 = 1 ; par5 = 1 ; par6 = White Noise ; par7 = 0.95 ;
Parameters (R input):
par1 = Default ; par2 = 1 ; par3 = 1 ; par4 = 1 ; par5 = 1 ; par6 = White Noise ; par7 = 0.95 ; par8 = ;
R code (references can be found in the software module):
if (par1 == 'Default') {
par1 = 10*log10(length(x))
} else {
par1 <- as.numeric(par1)
}
par2 <- as.numeric(par2)
par3 <- as.numeric(par3)
par4 <- as.numeric(par4)
par5 <- as.numeric(par5)
if (par6 == 'White Noise') par6 <- 'white' else par6 <- 'ma'
par7 <- as.numeric(par7)
if (par8 != '') par8 <- as.numeric(par8)
ox <- x
if (par8 == '') {
if (par2 == 0) {
x <- log(x)
} else {
x <- (x ^ par2 - 1) / par2
}
} else {
x <- log(x,base=par8)
}
if (par3 > 0) x <- diff(x,lag=1,difference=par3)
if (par4 > 0) x <- diff(x,lag=par5,difference=par4)
bitmap(file='picts.png')
op <- par(mfrow=c(2,1))
plot(ox,type='l',main='Original Time Series',xlab='time',ylab='value')
if (par8=='') {
mytitle <- paste('Working Time Series (lambda=',par2,', d=',par3,', D=',par4,')',sep='')
mysub <- paste('(lambda=',par2,', d=',par3,', D=',par4,', CI=', par7, ', CI type=',par6,')',sep='')
} else {
mytitle <- paste('Working Time Series (base=',par8,', d=',par3,', D=',par4,')',sep='')
mysub <- paste('(base=',par8,', d=',par3,', D=',par4,', CI=', par7, ', CI type=',par6,')',sep='')
}
plot(x,type='l', main=mytitle,xlab='time',ylab='value')
par(op)
dev.off()
bitmap(file='pic1.png')
racf <- acf(x, par1, main='Autocorrelation', xlab='time lag', ylab='ACF', ci.type=par6, ci=par7, sub=mysub)
dev.off()
bitmap(file='pic2.png')
rpacf <- pacf(x,par1,main='Partial Autocorrelation',xlab='lags',ylab='PACF',sub=mysub)
dev.off()
(myacf <- c(racf$acf))
(mypacf <- c(rpacf$acf))
lengthx <- length(x)
sqrtn <- sqrt(lengthx)
load(file='createtable')
a<-table.start()
a<-table.row.start(a)
a<-table.element(a,'Autocorrelation Function',4,TRUE)
a<-table.row.end(a)
a<-table.row.start(a)
a<-table.element(a,'Time lag k',header=TRUE)
a<-table.element(a,hyperlink('basics.htm','ACF(k)','click here for more information about the Autocorrelation Function'),header=TRUE)
a<-table.element(a,'T-STAT',header=TRUE)
a<-table.element(a,'P-value',header=TRUE)
a<-table.row.end(a)
for (i in 2:(par1+1)) {
a<-table.row.start(a)
a<-table.element(a,i-1,header=TRUE)
a<-table.element(a,round(myacf[i],6))
mytstat <- myacf[i]*sqrtn
a<-table.element(a,round(mytstat,4))
a<-table.element(a,round(1-pt(abs(mytstat),lengthx),6))
a<-table.row.end(a)
}
a<-table.end(a)
table.save(a,file='mytable.tab')
a<-table.start()
a<-table.row.start(a)
a<-table.element(a,'Partial Autocorrelation Function',4,TRUE)
a<-table.row.end(a)
a<-table.row.start(a)
a<-table.element(a,'Time lag k',header=TRUE)
a<-table.element(a,hyperlink('basics.htm','PACF(k)','click here for more information about the Partial Autocorrelation Function'),header=TRUE)
a<-table.element(a,'T-STAT',header=TRUE)
a<-table.element(a,'P-value',header=TRUE)
a<-table.row.end(a)
for (i in 1:par1) {
a<-table.row.start(a)
a<-table.element(a,i,header=TRUE)
a<-table.element(a,round(mypacf[i],6))
mytstat <- mypacf[i]*sqrtn
a<-table.element(a,round(mytstat,4))
a<-table.element(a,round(1-pt(abs(mytstat),lengthx),6))
a<-table.row.end(a)
}
a<-table.end(a)
table.save(a,file='mytable1.tab')