| Multiple Linear Regression - Estimated Regression Equation |
| GemiddeldeTemperatuur[t] = -4.04530217058801 + 0.0381435714492496UrenZonneschijn[t] + 0.213146642069809Neerslagdagen[t] + 0.0010129530924018Onweersdagen[t] -0.208605928160090Sneeuwdagen[t] + 0.58755377086074GemTemperatuurAuto[t] + e[t] |
| Multiple Linear Regression - Ordinary Least Squares | |||||
| Variable | Parameter | S.D. | T-STAT H0: parameter = 0 | 2-tail p-value | 1-tail p-value |
| (Intercept) | -4.04530217058801 | 2.255823 | -1.7933 | 0.080892 | 0.040446 |
| UrenZonneschijn | 0.0381435714492496 | 0.009171 | 4.1591 | 0.000176 | 8.8e-05 |
| Neerslagdagen | 0.213146642069809 | 0.098636 | 2.1609 | 0.037069 | 0.018534 |
| Onweersdagen | 0.0010129530924018 | 0.107129 | 0.0095 | 0.992505 | 0.496253 |
| Sneeuwdagen | -0.208605928160090 | 0.123561 | -1.6883 | 0.09955 | 0.049775 |
| GemTemperatuurAuto | 0.58755377086074 | 0.09452 | 6.2162 | 0 | 0 |
| Multiple Linear Regression - Regression Statistics | |
| Multiple R | 0.954893570708105 |
| R-squared | 0.911821731379675 |
| Adjusted R-squared | 0.900219327613843 |
| F-TEST (value) | 78.5890363568357 |
| F-TEST (DF numerator) | 5 |
| F-TEST (DF denominator) | 38 |
| p-value | 0 |
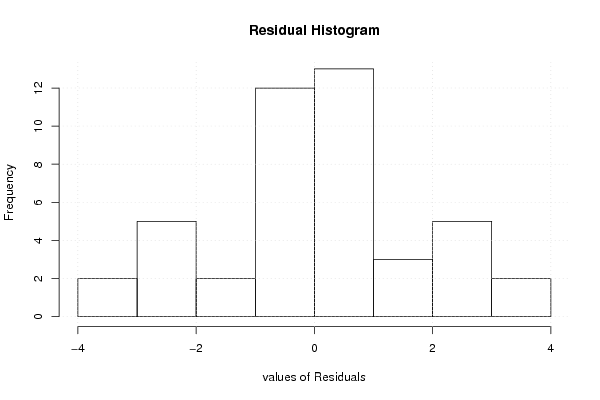
| Multiple Linear Regression - Residual Statistics | |
| Residual Standard Deviation | 1.79003426320843 |
| Sum Squared Residuals | 121.760461211486 |
| Multiple Linear Regression - Actuals, Interpolation, and Residuals | |||
| Time or Index | Actuals | Interpolation Forecast | Residuals Prediction Error |
| 1 | 14.3 | 12.254761049281 | 2.04523895071901 |
| 2 | 14.6 | 15.2569145621409 | -0.65691456214086 |
| 3 | 17.5 | 15.1450487556025 | 2.35495124439754 |
| 4 | 17.2 | 20.1088111777256 | -2.90881117772565 |
| 5 | 17.2 | 14.0343958896610 | 3.16560411033896 |
| 6 | 14.1 | 14.1500555887353 | -0.0500555887353311 |
| 7 | 10.4 | 10.8805626816387 | -0.480562681638716 |
| 8 | 6.8 | 7.72839243862457 | -0.928392438624566 |
| 9 | 4.1 | 6.14717899681861 | -2.04717899681861 |
| 10 | 6.5 | 6.48290772610812 | 0.0170922738918758 |
| 11 | 6.1 | 7.10279244282318 | -1.00279244282318 |
| 12 | 6.3 | 6.91227239214089 | -0.612272392140886 |
| 13 | 9.3 | 12.5002814182706 | -3.20028141827062 |
| 14 | 16.4 | 15.7019293417246 | 0.698070658275413 |
| 15 | 16.1 | 16.9270719836969 | -0.827071983696898 |
| 16 | 18 | 17.2417233052207 | 0.758276694779287 |
| 17 | 17.6 | 15.3873901377408 | 2.21260986225923 |
| 18 | 14 | 12.829727710922 | 1.17027228907801 |
| 19 | 10.5 | 10.3574248247327 | 0.142575175267255 |
| 20 | 6.9 | 6.40091781640139 | 0.499082183598611 |
| 21 | 2.8 | 2.45847233208637 | 0.341527667913632 |
| 22 | 0.7 | 4.68735707539688 | -3.98735707539688 |
| 23 | 3.6 | 3.6032438930405 | -0.00324389304049716 |
| 24 | 6.7 | 8.16186189031866 | -1.46186189031866 |
| 25 | 12.5 | 12.1024170644410 | 0.397582935559046 |
| 26 | 14.4 | 16.7054068871538 | -2.30540688715384 |
| 27 | 16.5 | 16.3554115224126 | 0.144588477587398 |
| 28 | 18.7 | 18.9364124206549 | -0.236412420654902 |
| 29 | 19.4 | 18.0651349400197 | 1.33486505998027 |
| 30 | 15.8 | 12.2673789537054 | 3.53262104629461 |
| 31 | 11.3 | 9.185491534531 | 2.11450846546901 |
| 32 | 9.7 | 7.17546700130712 | 2.52453299869288 |
| 33 | 2.9 | 1.94602328287809 | 0.953976717121914 |
| 34 | 0.1 | -0.848822966956965 | 0.948822966956965 |
| 35 | 2.5 | 2.20956691698301 | 0.290433083016986 |
| 36 | 6.7 | 6.75303468742455 | -0.0530346874245536 |
| 37 | 10.3 | 13.0921198755120 | -2.79211987551198 |
| 38 | 11.2 | 13.9662971266093 | -2.76629712660933 |
| 39 | 17.4 | 17.4498786918753 | -0.0498786918753468 |
| 40 | 20.5 | 19.3371951337351 | 1.16280486626492 |
| 41 | 17 | 17.4583337651999 | -0.458333765199937 |
| 42 | 14.2 | 14.5373213082502 | -0.337321308250162 |
| 43 | 10.6 | 10.5495644342704 | 0.0504355657295827 |
| 44 | 6.1 | 5.79487198914101 | 0.30512801085899 |
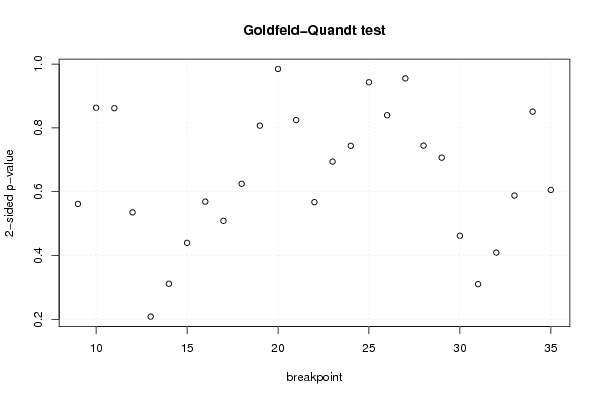
| Goldfeld-Quandt test for Heteroskedasticity | |||
| p-values | Alternative Hypothesis | ||
| breakpoint index | greater | 2-sided | less |
| 9 | 0.719115126358414 | 0.561769747283173 | 0.280884873641586 |
| 10 | 0.568428352810147 | 0.863143294379706 | 0.431571647189853 |
| 11 | 0.430832291952713 | 0.861664583905427 | 0.569167708047287 |
| 12 | 0.732376705352037 | 0.535246589295926 | 0.267623294647963 |
| 13 | 0.895834793841963 | 0.208330412316074 | 0.104165206158037 |
| 14 | 0.844246908208105 | 0.311506183583791 | 0.155753091791895 |
| 15 | 0.780129566788648 | 0.439740866422704 | 0.219870433211352 |
| 16 | 0.715661547245224 | 0.568676905509552 | 0.284338452754776 |
| 17 | 0.745649270918841 | 0.508701458162318 | 0.254350729081159 |
| 18 | 0.687613294899989 | 0.624773410200022 | 0.312386705100011 |
| 19 | 0.596487715798138 | 0.807024568403723 | 0.403512284201862 |
| 20 | 0.507615790906733 | 0.984768418186534 | 0.492384209093267 |
| 21 | 0.412210480339340 | 0.824420960678679 | 0.58778951966066 |
| 22 | 0.716404200971606 | 0.567191598056788 | 0.283595799028394 |
| 23 | 0.652811568148118 | 0.694376863703764 | 0.347188431851882 |
| 24 | 0.628101963220918 | 0.743796073558163 | 0.371898036779082 |
| 25 | 0.52854754456923 | 0.94290491086154 | 0.47145245543077 |
| 26 | 0.580114172220781 | 0.839771655558437 | 0.419885827779219 |
| 27 | 0.477621818113848 | 0.955243636227696 | 0.522378181886152 |
| 28 | 0.372244152537045 | 0.744488305074089 | 0.627755847462955 |
| 29 | 0.353323577231206 | 0.706647154462413 | 0.646676422768794 |
| 30 | 0.768999013503315 | 0.462001972993371 | 0.231000986496685 |
| 31 | 0.844855241255932 | 0.310289517488136 | 0.155144758744068 |
| 32 | 0.795476326014084 | 0.409047347971832 | 0.204523673985916 |
| 33 | 0.706055196087407 | 0.587889607825186 | 0.293944803912593 |
| 34 | 0.574569422428973 | 0.850861155142055 | 0.425430577571027 |
| 35 | 0.697198597245072 | 0.605602805509856 | 0.302801402754928 |
| Meta Analysis of Goldfeld-Quandt test for Heteroskedasticity | |||
| Description | # significant tests | % significant tests | OK/NOK |
| 1% type I error level | 0 | 0 | OK |
| 5% type I error level | 0 | 0 | OK |
| 10% type I error level | 0 | 0 | OK |