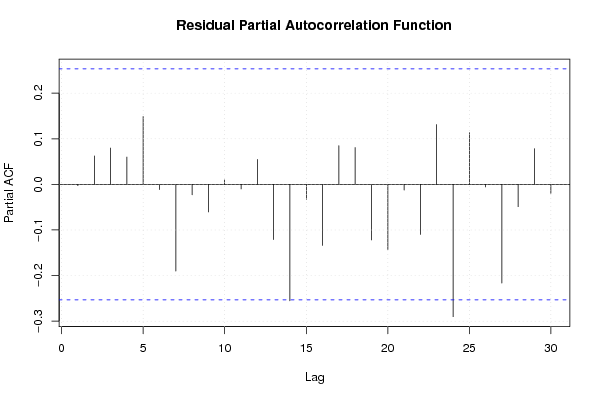
| Multiple Linear Regression - Estimated Regression Equation |
| Y[t] = + 36.0412849947343 -1.07737500078825X[t] + 0.346066086990625Y1[t] + 0.308973906895185Y2[t] + 0.239167122050576Y3[t] + 0.549191143048674M1[t] -20.4478997908501M2[t] -35.6144987271497M3[t] -35.2010923362867M4[t] -21.6096098638476M5[t] -8.96826790774917M6[t] -16.9676387368805M7[t] -21.7652635983034M8[t] -5.96576558472508M9[t] -44.2213929649418M10[t] -30.1782647969586M11[t] -0.097245795559272t + e[t] |
| Multiple Linear Regression - Ordinary Least Squares | |||||
| Variable | Parameter | S.D. | T-STAT H0: parameter = 0 | 2-tail p-value | 1-tail p-value |
| (Intercept) | 36.0412849947343 | 10.58928 | 3.4036 | 0.00145 | 0.000725 |
| X | -1.07737500078825 | 2.990699 | -0.3602 | 0.72043 | 0.360215 |
| Y1 | 0.346066086990625 | 0.14722 | 2.3507 | 0.023395 | 0.011698 |
| Y2 | 0.308973906895185 | 0.147592 | 2.0934 | 0.042245 | 0.021122 |
| Y3 | 0.239167122050576 | 0.143192 | 1.6703 | 0.102133 | 0.051067 |
| M1 | 0.549191143048674 | 9.21253 | 0.0596 | 0.95274 | 0.47637 |
| M2 | -20.4478997908501 | 9.710246 | -2.1058 | 0.041098 | 0.020549 |
| M3 | -35.6144987271497 | 6.993079 | -5.0928 | 7e-06 | 4e-06 |
| M4 | -35.2010923362867 | 5.966444 | -5.8998 | 1e-06 | 0 |
| M5 | -21.6096098638476 | 5.739037 | -3.7654 | 5e-04 | 0.00025 |
| M6 | -8.96826790774917 | 6.305878 | -1.4222 | 0.16218 | 0.08109 |
| M7 | -16.9676387368805 | 7.694286 | -2.2052 | 0.032835 | 0.016417 |
| M8 | -21.7652635983034 | 7.564488 | -2.8773 | 0.006221 | 0.003111 |
| M9 | -5.96576558472508 | 6.261504 | -0.9528 | 0.346033 | 0.173016 |
| M10 | -44.2213929649418 | 7.385429 | -5.9877 | 0 | 0 |
| M11 | -30.1782647969586 | 8.339904 | -3.6185 | 0.000775 | 0.000387 |
| t | -0.097245795559272 | 0.084068 | -1.1567 | 0.253763 | 0.126881 |
| Multiple Linear Regression - Regression Statistics | |
| Multiple R | 0.936965555361769 |
| R-squared | 0.877904451934389 |
| Adjusted R-squared | 0.83247355032858 |
| F-TEST (value) | 19.3239495784548 |
| F-TEST (DF numerator) | 16 |
| F-TEST (DF denominator) | 43 |
| p-value | 1.32116539930394e-14 |
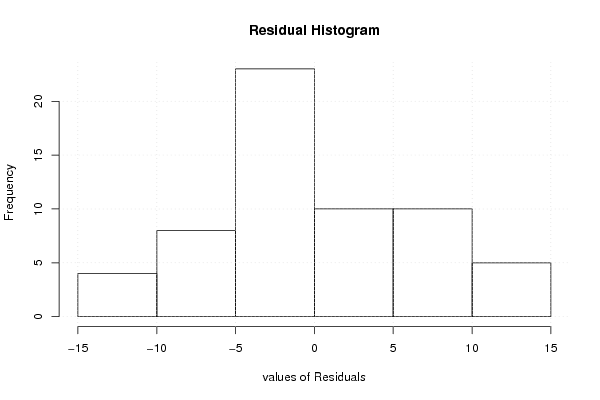
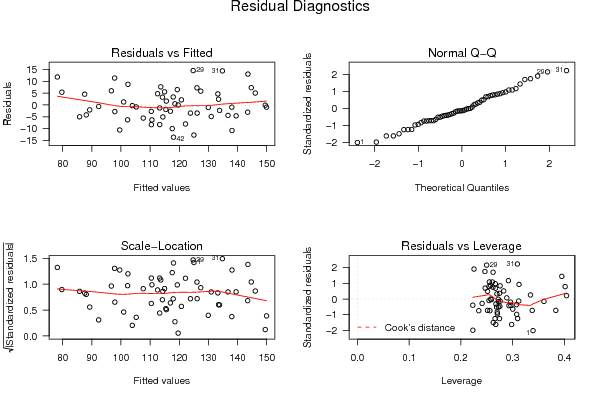
| Multiple Linear Regression - Residual Statistics | |
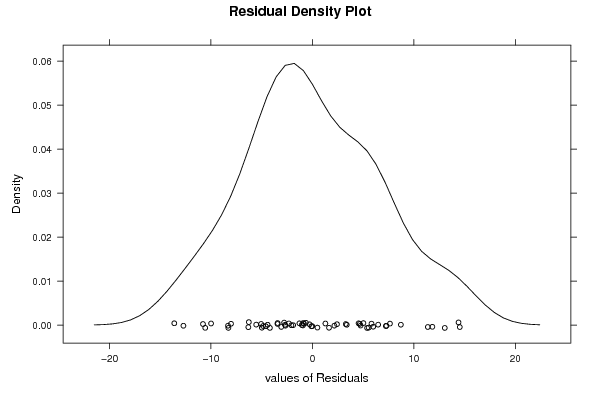
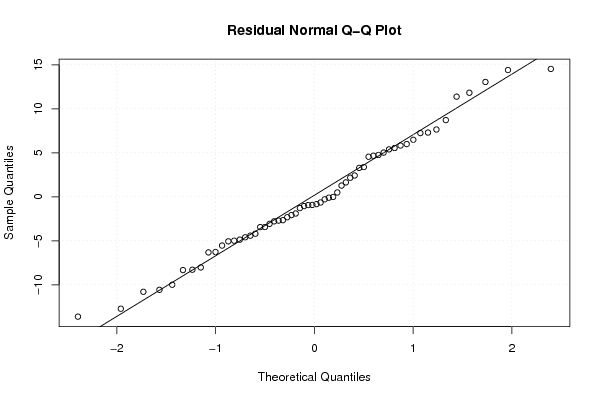
| Residual Standard Deviation | 7.76399012700786 |
| Sum Squared Residuals | 2592.02033576785 |
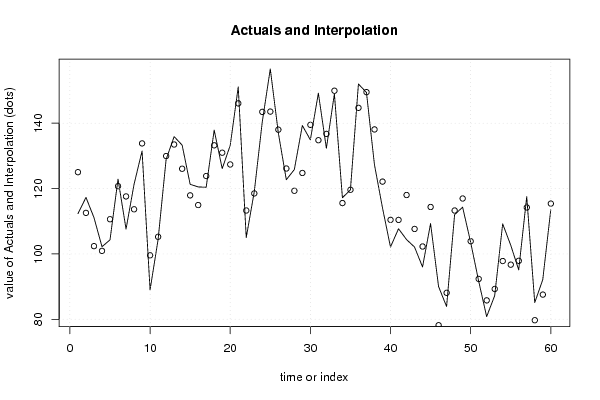
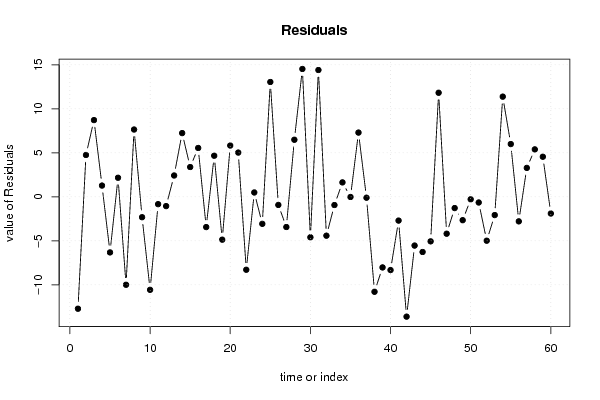
| Multiple Linear Regression - Actuals, Interpolation, and Residuals | |||
| Time or Index | Actuals | Interpolation Forecast | Residuals Prediction Error |
| 1 | 112.3 | 125.016844688237 | -12.7168446882366 |
| 2 | 117.3 | 112.547859483636 | 4.75214051636404 |
| 3 | 111.1 | 102.379382332776 | 8.72061766722434 |
| 4 | 102.2 | 100.922883825166 | 1.27711617483445 |
| 5 | 104.3 | 110.617329715332 | -6.31732971533162 |
| 6 | 122.9 | 120.732835731259 | 2.16716426874133 |
| 7 | 107.6 | 117.593306142823 | -9.9933061428234 |
| 8 | 121.3 | 113.652789979441 | 7.64721002055865 |
| 9 | 131.5 | 133.817355283876 | -2.31735528387632 |
| 10 | 89 | 99.5680417524949 | -10.5680417524949 |
| 11 | 104.4 | 105.234238850241 | -0.834238850241086 |
| 12 | 128.9 | 129.952789193167 | -1.05278919316651 |
| 13 | 135.9 | 133.476949150963 | 2.42305084903736 |
| 14 | 133.3 | 126.058109428950 | 7.24189057105015 |
| 15 | 121.3 | 117.916904709421 | 3.38309529057920 |
| 16 | 120.5 | 114.951109957264 | 5.54889004273647 |
| 17 | 120.4 | 123.838972364477 | -3.43897236447719 |
| 18 | 137.9 | 133.231277326194 | 4.66872267380579 |
| 19 | 126.1 | 130.968586135510 | -4.86858613550955 |
| 20 | 133.2 | 127.373262310499 | 5.82673768950126 |
| 21 | 151.1 | 146.072116280673 | 5.02788371932692 |
| 22 | 105 | 113.285368760788 | -8.28536876078828 |
| 23 | 119 | 118.506324022927 | 0.493675977072679 |
| 24 | 140.4 | 143.469662619033 | -3.06966261903265 |
| 25 | 156.6 | 143.550077597334 | 13.0499224026658 |
| 26 | 137.1 | 138.022392793389 | -0.922392793389313 |
| 27 | 122.7 | 126.133813068798 | -3.4338130687976 |
| 28 | 125.8 | 119.316138204199 | 6.4838617958005 |
| 29 | 139.3 | 124.770196611473 | 14.5298033885266 |
| 30 | 134.9 | 139.499997500233 | -4.59999750023276 |
| 31 | 149.2 | 134.793255914225 | 14.4067440857748 |
| 32 | 132.3 | 136.716401258553 | -4.41640125855294 |
| 33 | 149 | 149.936128138009 | -0.936128138009019 |
| 34 | 117.2 | 115.560989433771 | 1.63901056622894 |
| 35 | 119.6 | 119.619910122388 | -0.0199101223879989 |
| 36 | 152 | 144.700208431543 | 7.29979156845746 |
| 37 | 149.4 | 149.500717892868 | -0.100717892868304 |
| 38 | 127.3 | 138.09136501356 | -10.7913650135600 |
| 39 | 114.1 | 122.125142355720 | -8.02514235571955 |
| 40 | 102.1 | 110.423072743032 | -8.32307274303189 |
| 41 | 107.7 | 110.40046740769 | -2.70046740769009 |
| 42 | 104.4 | 118.017840761567 | -13.6178407615669 |
| 43 | 102.1 | 107.639454463813 | -5.53945446381335 |
| 44 | 96 | 102.268353797482 | -6.26835379748189 |
| 45 | 109.3 | 114.359711396232 | -5.05971139623226 |
| 46 | 90 | 78.1746919646546 | 11.8253080353454 |
| 47 | 83.9 | 88.091932375357 | -4.19193237535695 |
| 48 | 112 | 113.279674566309 | -1.27967456630904 |
| 49 | 114.3 | 116.955410670598 | -2.65541067059826 |
| 50 | 103.6 | 103.880273280465 | -0.280273280464863 |
| 51 | 91.7 | 92.3447575332864 | -0.644757533286418 |
| 52 | 80.8 | 85.7867952703395 | -4.98679527033952 |
| 53 | 87.2 | 89.2730339010277 | -2.0730339010277 |
| 54 | 109.2 | 97.8180486807475 | 11.3819513192525 |
| 55 | 102.7 | 96.7053973436285 | 5.9946026563715 |
| 56 | 95.1 | 97.889192654025 | -2.78919265402508 |
| 57 | 117.5 | 114.214688901209 | 3.28531109879068 |
| 58 | 85.1 | 79.7109080882911 | 5.38909191170884 |
| 59 | 92.1 | 87.5475946290866 | 4.55240537091336 |
| 60 | 113.5 | 115.397665189949 | -1.89766518994922 |
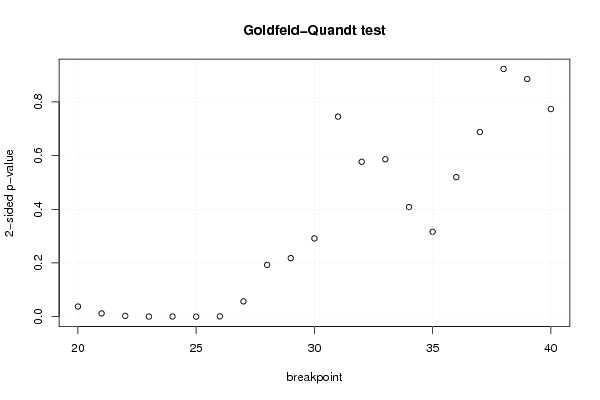
| Goldfeld-Quandt test for Heteroskedasticity | |||
| p-values | Alternative Hypothesis | ||
| breakpoint index | greater | 2-sided | less |
| 20 | 0.0190027095232591 | 0.0380054190465181 | 0.98099729047674 |
| 21 | 0.00615885435926884 | 0.0123177087185377 | 0.993841145640731 |
| 22 | 0.00155048730026150 | 0.00310097460052299 | 0.998449512699739 |
| 23 | 0.000293620813247382 | 0.000587241626494764 | 0.999706379186753 |
| 24 | 0.000366051462255277 | 0.000732102924510555 | 0.999633948537745 |
| 25 | 9.60663313403503e-05 | 0.000192132662680701 | 0.99990393366866 |
| 26 | 0.000693119275723665 | 0.00138623855144733 | 0.999306880724276 |
| 27 | 0.0285393753039088 | 0.0570787506078175 | 0.97146062469609 |
| 28 | 0.0965345141801375 | 0.193069028360275 | 0.903465485819863 |
| 29 | 0.109035517910172 | 0.218071035820345 | 0.890964482089828 |
| 30 | 0.145716396846631 | 0.291432793693262 | 0.854283603153369 |
| 31 | 0.372608277395624 | 0.745216554791248 | 0.627391722604376 |
| 32 | 0.28848768493992 | 0.57697536987984 | 0.71151231506008 |
| 33 | 0.293117477343783 | 0.586234954687566 | 0.706882522656217 |
| 34 | 0.204093135938671 | 0.408186271877342 | 0.795906864061329 |
| 35 | 0.158116712526663 | 0.316233425053326 | 0.841883287473337 |
| 36 | 0.259874600469556 | 0.519749200939111 | 0.740125399530444 |
| 37 | 0.343780462984237 | 0.687560925968474 | 0.656219537015763 |
| 38 | 0.461294575105482 | 0.922589150210965 | 0.538705424894518 |
| 39 | 0.442542451406579 | 0.885084902813157 | 0.557457548593421 |
| 40 | 0.386612535537560 | 0.773225071075121 | 0.61338746446244 |
| Meta Analysis of Goldfeld-Quandt test for Heteroskedasticity | |||
| Description | # significant tests | % significant tests | OK/NOK |
| 1% type I error level | 5 | 0.238095238095238 | NOK |
| 5% type I error level | 7 | 0.333333333333333 | NOK |
| 10% type I error level | 8 | 0.380952380952381 | NOK |