Free Statistics

of Irreproducible Research!

Author's title

Author*The author of this computation has been verified*
R Software Modulerwasp_arimabackwardselection.wasp
Title produced by softwareARIMA Backward Selection
Date of computationTue, 28 Dec 2010 17:20:53 +0000
Cite this page as followsStatistical Computations at FreeStatistics.org, Office for Research Development and Education, URL https://freestatistics.org/blog/index.php?v=date/2010/Dec/28/t12935567330aj9s06tn0xbh1w.htm/, Retrieved Sun, 05 May 2024 02:33:52 +0000
Statistical Computations at FreeStatistics.org, Office for Research Development and Education, URL https://freestatistics.org/blog/index.php?pk=116436, Retrieved Sun, 05 May 2024 02:33:52 +0000
QR Codes:

Original text written by user:
IsPrivate?No (this computation is public)
User-defined keywords
Estimated Impact137
Family? (F = Feedback message, R = changed R code, M = changed R Module, P = changed Parameters, D = changed Data)
-     [Univariate Data Series] [data set] [2008-12-01 19:54:57] [b98453cac15ba1066b407e146608df68]
- RMP   [ARIMA Backward Selection] [] [2009-11-27 14:53:14] [b98453cac15ba1066b407e146608df68]
-   PD    [ARIMA Backward Selection] [] [2009-12-18 16:49:13] [ea26ab7ea3bba830cfeb08d06278d52c]
-   PD      [ARIMA Backward Selection] [ARIMA] [2009-12-21 16:40:00] [9dbb467a28ad600d808a4e47d5e0774e]
-               [ARIMA Backward Selection] [paper] [2010-12-28 17:20:53] [a4671b53c9c003ef222bf9d29c2203ca] [Current]
Feedback Forum

Post a new message
Dataseries X:
36845
35338
35022
34777
26887
23970
22780
17351
21382
24561
17409
11514
31514
27071
29462
26105
22397
23843
21705
18089
20764
25316
17704
15548
28029
29383
36438
32034
22679
24319
18004
17537
20366
22782
19169
13807
29743
25591
29096
26482
22405
27044
17970
18730
19684
19785
18479
10698
31956
29506
34506
27165
26736
23691
18157
17328
18205
20995
17382
9367
31124
26551
30651
25859
25100
25778
20418
18688
20424
24776
19814
12738
31566
30111
30019
31934
25826
26835
20205
17789
20520
22518
15572
11509


Summary of computational transaction
Raw Inputview raw input (R code)
Raw Outputview raw output of R engine
Computing time15 seconds
R Server'Sir Ronald Aylmer Fisher' @ 193.190.124.24

\begin{tabular}{lllllllll}
\hline
Summary of computational transaction \tabularnewline
Raw Input & view raw input (R code)  \tabularnewline
Raw Output & view raw output of R engine  \tabularnewline
Computing time & 15 seconds \tabularnewline
R Server & 'Sir Ronald Aylmer Fisher' @ 193.190.124.24 \tabularnewline
\hline
\end{tabular}
%Source: https://freestatistics.org/blog/index.php?pk=116436&T=0

[TABLE]
[ROW][C]Summary of computational transaction[/C][/ROW]
[ROW][C]Raw Input[/C][C]view raw input (R code) [/C][/ROW]
[ROW][C]Raw Output[/C][C]view raw output of R engine [/C][/ROW]
[ROW][C]Computing time[/C][C]15 seconds[/C][/ROW]
[ROW][C]R Server[/C][C]'Sir Ronald Aylmer Fisher' @ 193.190.124.24[/C][/ROW]
[/TABLE]
Source: https://freestatistics.org/blog/index.php?pk=116436&T=0

Globally Unique Identifier (entire table): ba.freestatistics.org/blog/index.php?pk=116436&T=0

As an alternative you can also use a QR Code:  

The GUIDs for individual cells are displayed in the table below:

Summary of computational transaction
Raw Inputview raw input (R code)
Raw Outputview raw output of R engine
Computing time15 seconds
R Server'Sir Ronald Aylmer Fisher' @ 193.190.124.24


ARIMA Parameter Estimation and Backward Selection
Iterationar1ar2ar3ma1sar1sar2sma1
Estimates ( 1 )0.15440.28690.1132-0.8970.05950.158-0.9993
(p-val)(0.5155 )(0.1122 )(0.4661 )(0 )(0.7516 )(0.3684 )(4e-04 )
Estimates ( 2 )0.12790.27570.1299-0.884900.1435-1.0008
(p-val)(0.6104 )(0.1646 )(0.3898 )(2e-04 )(NA )(0.3834 )(0.007 )
Estimates ( 3 )00.1910.093-0.762400.1578-1
(p-val)(NA )(0.2148 )(0.5099 )(0 )(NA )(0.3219 )(0.0034 )
Estimates ( 4 )00.15910-0.723100.133-0.9999
(p-val)(NA )(0.2631 )(NA )(0 )(NA )(0.3982 )(0.0201 )
Estimates ( 5 )00.13820-0.68400-1.0005
(p-val)(NA )(0.3211 )(NA )(0 )(NA )(NA )(0.1344 )
Estimates ( 6 )000-0.638600-0.9993
(p-val)(NA )(NA )(NA )(0 )(NA )(NA )(0.0458 )
Estimates ( 7 )NANANANANANANA
(p-val)(NA )(NA )(NA )(NA )(NA )(NA )(NA )
Estimates ( 8 )NANANANANANANA
(p-val)(NA )(NA )(NA )(NA )(NA )(NA )(NA )
Estimates ( 9 )NANANANANANANA
(p-val)(NA )(NA )(NA )(NA )(NA )(NA )(NA )
Estimates ( 10 )NANANANANANANA
(p-val)(NA )(NA )(NA )(NA )(NA )(NA )(NA )
Estimates ( 11 )NANANANANANANA
(p-val)(NA )(NA )(NA )(NA )(NA )(NA )(NA )
Estimates ( 12 )NANANANANANANA
(p-val)(NA )(NA )(NA )(NA )(NA )(NA )(NA )
Estimates ( 13 )NANANANANANANA
(p-val)(NA )(NA )(NA )(NA )(NA )(NA )(NA )

\begin{tabular}{lllllllll}
\hline
ARIMA Parameter Estimation and Backward Selection \tabularnewline
Iteration & ar1 & ar2 & ar3 & ma1 & sar1 & sar2 & sma1 \tabularnewline
Estimates ( 1 ) & 0.1544 & 0.2869 & 0.1132 & -0.897 & 0.0595 & 0.158 & -0.9993 \tabularnewline
(p-val) & (0.5155 ) & (0.1122 ) & (0.4661 ) & (0 ) & (0.7516 ) & (0.3684 ) & (4e-04 ) \tabularnewline
Estimates ( 2 ) & 0.1279 & 0.2757 & 0.1299 & -0.8849 & 0 & 0.1435 & -1.0008 \tabularnewline
(p-val) & (0.6104 ) & (0.1646 ) & (0.3898 ) & (2e-04 ) & (NA ) & (0.3834 ) & (0.007 ) \tabularnewline
Estimates ( 3 ) & 0 & 0.191 & 0.093 & -0.7624 & 0 & 0.1578 & -1 \tabularnewline
(p-val) & (NA ) & (0.2148 ) & (0.5099 ) & (0 ) & (NA ) & (0.3219 ) & (0.0034 ) \tabularnewline
Estimates ( 4 ) & 0 & 0.1591 & 0 & -0.7231 & 0 & 0.133 & -0.9999 \tabularnewline
(p-val) & (NA ) & (0.2631 ) & (NA ) & (0 ) & (NA ) & (0.3982 ) & (0.0201 ) \tabularnewline
Estimates ( 5 ) & 0 & 0.1382 & 0 & -0.684 & 0 & 0 & -1.0005 \tabularnewline
(p-val) & (NA ) & (0.3211 ) & (NA ) & (0 ) & (NA ) & (NA ) & (0.1344 ) \tabularnewline
Estimates ( 6 ) & 0 & 0 & 0 & -0.6386 & 0 & 0 & -0.9993 \tabularnewline
(p-val) & (NA ) & (NA ) & (NA ) & (0 ) & (NA ) & (NA ) & (0.0458 ) \tabularnewline
Estimates ( 7 ) & NA & NA & NA & NA & NA & NA & NA \tabularnewline
(p-val) & (NA ) & (NA ) & (NA ) & (NA ) & (NA ) & (NA ) & (NA ) \tabularnewline
Estimates ( 8 ) & NA & NA & NA & NA & NA & NA & NA \tabularnewline
(p-val) & (NA ) & (NA ) & (NA ) & (NA ) & (NA ) & (NA ) & (NA ) \tabularnewline
Estimates ( 9 ) & NA & NA & NA & NA & NA & NA & NA \tabularnewline
(p-val) & (NA ) & (NA ) & (NA ) & (NA ) & (NA ) & (NA ) & (NA ) \tabularnewline
Estimates ( 10 ) & NA & NA & NA & NA & NA & NA & NA \tabularnewline
(p-val) & (NA ) & (NA ) & (NA ) & (NA ) & (NA ) & (NA ) & (NA ) \tabularnewline
Estimates ( 11 ) & NA & NA & NA & NA & NA & NA & NA \tabularnewline
(p-val) & (NA ) & (NA ) & (NA ) & (NA ) & (NA ) & (NA ) & (NA ) \tabularnewline
Estimates ( 12 ) & NA & NA & NA & NA & NA & NA & NA \tabularnewline
(p-val) & (NA ) & (NA ) & (NA ) & (NA ) & (NA ) & (NA ) & (NA ) \tabularnewline
Estimates ( 13 ) & NA & NA & NA & NA & NA & NA & NA \tabularnewline
(p-val) & (NA ) & (NA ) & (NA ) & (NA ) & (NA ) & (NA ) & (NA ) \tabularnewline
\hline
\end{tabular}
%Source: https://freestatistics.org/blog/index.php?pk=116436&T=1

[TABLE]
[ROW][C]ARIMA Parameter Estimation and Backward Selection[/C][/ROW]
[ROW][C]Iteration[/C][C]ar1[/C][C]ar2[/C][C]ar3[/C][C]ma1[/C][C]sar1[/C][C]sar2[/C][C]sma1[/C][/ROW]
[ROW][C]Estimates ( 1 )[/C][C]0.1544[/C][C]0.2869[/C][C]0.1132[/C][C]-0.897[/C][C]0.0595[/C][C]0.158[/C][C]-0.9993[/C][/ROW]
[ROW][C](p-val)[/C][C](0.5155 )[/C][C](0.1122 )[/C][C](0.4661 )[/C][C](0 )[/C][C](0.7516 )[/C][C](0.3684 )[/C][C](4e-04 )[/C][/ROW]
[ROW][C]Estimates ( 2 )[/C][C]0.1279[/C][C]0.2757[/C][C]0.1299[/C][C]-0.8849[/C][C]0[/C][C]0.1435[/C][C]-1.0008[/C][/ROW]
[ROW][C](p-val)[/C][C](0.6104 )[/C][C](0.1646 )[/C][C](0.3898 )[/C][C](2e-04 )[/C][C](NA )[/C][C](0.3834 )[/C][C](0.007 )[/C][/ROW]
[ROW][C]Estimates ( 3 )[/C][C]0[/C][C]0.191[/C][C]0.093[/C][C]-0.7624[/C][C]0[/C][C]0.1578[/C][C]-1[/C][/ROW]
[ROW][C](p-val)[/C][C](NA )[/C][C](0.2148 )[/C][C](0.5099 )[/C][C](0 )[/C][C](NA )[/C][C](0.3219 )[/C][C](0.0034 )[/C][/ROW]
[ROW][C]Estimates ( 4 )[/C][C]0[/C][C]0.1591[/C][C]0[/C][C]-0.7231[/C][C]0[/C][C]0.133[/C][C]-0.9999[/C][/ROW]
[ROW][C](p-val)[/C][C](NA )[/C][C](0.2631 )[/C][C](NA )[/C][C](0 )[/C][C](NA )[/C][C](0.3982 )[/C][C](0.0201 )[/C][/ROW]
[ROW][C]Estimates ( 5 )[/C][C]0[/C][C]0.1382[/C][C]0[/C][C]-0.684[/C][C]0[/C][C]0[/C][C]-1.0005[/C][/ROW]
[ROW][C](p-val)[/C][C](NA )[/C][C](0.3211 )[/C][C](NA )[/C][C](0 )[/C][C](NA )[/C][C](NA )[/C][C](0.1344 )[/C][/ROW]
[ROW][C]Estimates ( 6 )[/C][C]0[/C][C]0[/C][C]0[/C][C]-0.6386[/C][C]0[/C][C]0[/C][C]-0.9993[/C][/ROW]
[ROW][C](p-val)[/C][C](NA )[/C][C](NA )[/C][C](NA )[/C][C](0 )[/C][C](NA )[/C][C](NA )[/C][C](0.0458 )[/C][/ROW]
[ROW][C]Estimates ( 7 )[/C][C]NA[/C][C]NA[/C][C]NA[/C][C]NA[/C][C]NA[/C][C]NA[/C][C]NA[/C][/ROW]
[ROW][C](p-val)[/C][C](NA )[/C][C](NA )[/C][C](NA )[/C][C](NA )[/C][C](NA )[/C][C](NA )[/C][C](NA )[/C][/ROW]
[ROW][C]Estimates ( 8 )[/C][C]NA[/C][C]NA[/C][C]NA[/C][C]NA[/C][C]NA[/C][C]NA[/C][C]NA[/C][/ROW]
[ROW][C](p-val)[/C][C](NA )[/C][C](NA )[/C][C](NA )[/C][C](NA )[/C][C](NA )[/C][C](NA )[/C][C](NA )[/C][/ROW]
[ROW][C]Estimates ( 9 )[/C][C]NA[/C][C]NA[/C][C]NA[/C][C]NA[/C][C]NA[/C][C]NA[/C][C]NA[/C][/ROW]
[ROW][C](p-val)[/C][C](NA )[/C][C](NA )[/C][C](NA )[/C][C](NA )[/C][C](NA )[/C][C](NA )[/C][C](NA )[/C][/ROW]
[ROW][C]Estimates ( 10 )[/C][C]NA[/C][C]NA[/C][C]NA[/C][C]NA[/C][C]NA[/C][C]NA[/C][C]NA[/C][/ROW]
[ROW][C](p-val)[/C][C](NA )[/C][C](NA )[/C][C](NA )[/C][C](NA )[/C][C](NA )[/C][C](NA )[/C][C](NA )[/C][/ROW]
[ROW][C]Estimates ( 11 )[/C][C]NA[/C][C]NA[/C][C]NA[/C][C]NA[/C][C]NA[/C][C]NA[/C][C]NA[/C][/ROW]
[ROW][C](p-val)[/C][C](NA )[/C][C](NA )[/C][C](NA )[/C][C](NA )[/C][C](NA )[/C][C](NA )[/C][C](NA )[/C][/ROW]
[ROW][C]Estimates ( 12 )[/C][C]NA[/C][C]NA[/C][C]NA[/C][C]NA[/C][C]NA[/C][C]NA[/C][C]NA[/C][/ROW]
[ROW][C](p-val)[/C][C](NA )[/C][C](NA )[/C][C](NA )[/C][C](NA )[/C][C](NA )[/C][C](NA )[/C][C](NA )[/C][/ROW]
[ROW][C]Estimates ( 13 )[/C][C]NA[/C][C]NA[/C][C]NA[/C][C]NA[/C][C]NA[/C][C]NA[/C][C]NA[/C][/ROW]
[ROW][C](p-val)[/C][C](NA )[/C][C](NA )[/C][C](NA )[/C][C](NA )[/C][C](NA )[/C][C](NA )[/C][C](NA )[/C][/ROW]
[/TABLE]
Source: https://freestatistics.org/blog/index.php?pk=116436&T=1

Globally Unique Identifier (entire table): ba.freestatistics.org/blog/index.php?pk=116436&T=1

As an alternative you can also use a QR Code:  

The GUIDs for individual cells are displayed in the table below:

ARIMA Parameter Estimation and Backward Selection
Iterationar1ar2ar3ma1sar1sar2sma1
Estimates ( 1 )0.15440.28690.1132-0.8970.05950.158-0.9993
(p-val)(0.5155 )(0.1122 )(0.4661 )(0 )(0.7516 )(0.3684 )(4e-04 )
Estimates ( 2 )0.12790.27570.1299-0.884900.1435-1.0008
(p-val)(0.6104 )(0.1646 )(0.3898 )(2e-04 )(NA )(0.3834 )(0.007 )
Estimates ( 3 )00.1910.093-0.762400.1578-1
(p-val)(NA )(0.2148 )(0.5099 )(0 )(NA )(0.3219 )(0.0034 )
Estimates ( 4 )00.15910-0.723100.133-0.9999
(p-val)(NA )(0.2631 )(NA )(0 )(NA )(0.3982 )(0.0201 )
Estimates ( 5 )00.13820-0.68400-1.0005
(p-val)(NA )(0.3211 )(NA )(0 )(NA )(NA )(0.1344 )
Estimates ( 6 )000-0.638600-0.9993
(p-val)(NA )(NA )(NA )(0 )(NA )(NA )(0.0458 )
Estimates ( 7 )NANANANANANANA
(p-val)(NA )(NA )(NA )(NA )(NA )(NA )(NA )
Estimates ( 8 )NANANANANANANA
(p-val)(NA )(NA )(NA )(NA )(NA )(NA )(NA )
Estimates ( 9 )NANANANANANANA
(p-val)(NA )(NA )(NA )(NA )(NA )(NA )(NA )
Estimates ( 10 )NANANANANANANA
(p-val)(NA )(NA )(NA )(NA )(NA )(NA )(NA )
Estimates ( 11 )NANANANANANANA
(p-val)(NA )(NA )(NA )(NA )(NA )(NA )(NA )
Estimates ( 12 )NANANANANANANA
(p-val)(NA )(NA )(NA )(NA )(NA )(NA )(NA )
Estimates ( 13 )NANANANANANANA
(p-val)(NA )(NA )(NA )(NA )(NA )(NA )(NA )


Estimated ARIMA Residuals
Value
-104.037587137534
-1697.02531492926
783.64101955338
-1373.98338285758
1754.33069685636
4563.41330293097
2029.67619793620
2237.11899352775
667.781629812913
1230.30793063823
683.34573832681
2838.20950061129
-3282.96756740885
1132.89747486147
6277.71677200769
1637.08209478142
-2461.67721586522
551.508716595811
-3018.33193707447
978.566021544564
758.704257052165
-1121.87927250465
2316.50332022338
652.735296021531
-611.572080603048
-2486.85237779493
-1201.13102202491
-456.907258076714
2148.12438113946
5427.12659162901
-1710.51527138946
1684.48277784025
-76.5447115443477
-3367.17686984369
2109.11843889747
-1059.55031766391
2982.60908110823
2133.93281925668
2517.04318166443
-2437.26584428693
3317.25752529229
-950.518358853185
-2134.67306731137
279.501330990597
-1266.57572392174
-833.417430782848
794.978431547177
-1936.48755917081
2272.48226386277
-259.754324029001
-165.725368541501
-913.373064129204
3256.65393370842
2674.79174642387
817.437766351631
687.450571133896
42.5499938520233
1593.78075564651
869.303737905436
-779.768447315156
-87.8222230231867
1179.06505004235
-2685.42120652531
3295.76745212931
1119.20448860576
592.746533387843
-941.171225879907
-1212.45843814273
-107.630445754966
-841.822484587518
-2727.78405973303
66.7473443538161

\begin{tabular}{lllllllll}
\hline
Estimated ARIMA Residuals \tabularnewline
Value \tabularnewline
-104.037587137534 \tabularnewline
-1697.02531492926 \tabularnewline
783.64101955338 \tabularnewline
-1373.98338285758 \tabularnewline
1754.33069685636 \tabularnewline
4563.41330293097 \tabularnewline
2029.67619793620 \tabularnewline
2237.11899352775 \tabularnewline
667.781629812913 \tabularnewline
1230.30793063823 \tabularnewline
683.34573832681 \tabularnewline
2838.20950061129 \tabularnewline
-3282.96756740885 \tabularnewline
1132.89747486147 \tabularnewline
6277.71677200769 \tabularnewline
1637.08209478142 \tabularnewline
-2461.67721586522 \tabularnewline
551.508716595811 \tabularnewline
-3018.33193707447 \tabularnewline
978.566021544564 \tabularnewline
758.704257052165 \tabularnewline
-1121.87927250465 \tabularnewline
2316.50332022338 \tabularnewline
652.735296021531 \tabularnewline
-611.572080603048 \tabularnewline
-2486.85237779493 \tabularnewline
-1201.13102202491 \tabularnewline
-456.907258076714 \tabularnewline
2148.12438113946 \tabularnewline
5427.12659162901 \tabularnewline
-1710.51527138946 \tabularnewline
1684.48277784025 \tabularnewline
-76.5447115443477 \tabularnewline
-3367.17686984369 \tabularnewline
2109.11843889747 \tabularnewline
-1059.55031766391 \tabularnewline
2982.60908110823 \tabularnewline
2133.93281925668 \tabularnewline
2517.04318166443 \tabularnewline
-2437.26584428693 \tabularnewline
3317.25752529229 \tabularnewline
-950.518358853185 \tabularnewline
-2134.67306731137 \tabularnewline
279.501330990597 \tabularnewline
-1266.57572392174 \tabularnewline
-833.417430782848 \tabularnewline
794.978431547177 \tabularnewline
-1936.48755917081 \tabularnewline
2272.48226386277 \tabularnewline
-259.754324029001 \tabularnewline
-165.725368541501 \tabularnewline
-913.373064129204 \tabularnewline
3256.65393370842 \tabularnewline
2674.79174642387 \tabularnewline
817.437766351631 \tabularnewline
687.450571133896 \tabularnewline
42.5499938520233 \tabularnewline
1593.78075564651 \tabularnewline
869.303737905436 \tabularnewline
-779.768447315156 \tabularnewline
-87.8222230231867 \tabularnewline
1179.06505004235 \tabularnewline
-2685.42120652531 \tabularnewline
3295.76745212931 \tabularnewline
1119.20448860576 \tabularnewline
592.746533387843 \tabularnewline
-941.171225879907 \tabularnewline
-1212.45843814273 \tabularnewline
-107.630445754966 \tabularnewline
-841.822484587518 \tabularnewline
-2727.78405973303 \tabularnewline
66.7473443538161 \tabularnewline
\hline
\end{tabular}
%Source: https://freestatistics.org/blog/index.php?pk=116436&T=2

[TABLE]
[ROW][C]Estimated ARIMA Residuals[/C][/ROW]
[ROW][C]Value[/C][/ROW]
[ROW][C]-104.037587137534[/C][/ROW]
[ROW][C]-1697.02531492926[/C][/ROW]
[ROW][C]783.64101955338[/C][/ROW]
[ROW][C]-1373.98338285758[/C][/ROW]
[ROW][C]1754.33069685636[/C][/ROW]
[ROW][C]4563.41330293097[/C][/ROW]
[ROW][C]2029.67619793620[/C][/ROW]
[ROW][C]2237.11899352775[/C][/ROW]
[ROW][C]667.781629812913[/C][/ROW]
[ROW][C]1230.30793063823[/C][/ROW]
[ROW][C]683.34573832681[/C][/ROW]
[ROW][C]2838.20950061129[/C][/ROW]
[ROW][C]-3282.96756740885[/C][/ROW]
[ROW][C]1132.89747486147[/C][/ROW]
[ROW][C]6277.71677200769[/C][/ROW]
[ROW][C]1637.08209478142[/C][/ROW]
[ROW][C]-2461.67721586522[/C][/ROW]
[ROW][C]551.508716595811[/C][/ROW]
[ROW][C]-3018.33193707447[/C][/ROW]
[ROW][C]978.566021544564[/C][/ROW]
[ROW][C]758.704257052165[/C][/ROW]
[ROW][C]-1121.87927250465[/C][/ROW]
[ROW][C]2316.50332022338[/C][/ROW]
[ROW][C]652.735296021531[/C][/ROW]
[ROW][C]-611.572080603048[/C][/ROW]
[ROW][C]-2486.85237779493[/C][/ROW]
[ROW][C]-1201.13102202491[/C][/ROW]
[ROW][C]-456.907258076714[/C][/ROW]
[ROW][C]2148.12438113946[/C][/ROW]
[ROW][C]5427.12659162901[/C][/ROW]
[ROW][C]-1710.51527138946[/C][/ROW]
[ROW][C]1684.48277784025[/C][/ROW]
[ROW][C]-76.5447115443477[/C][/ROW]
[ROW][C]-3367.17686984369[/C][/ROW]
[ROW][C]2109.11843889747[/C][/ROW]
[ROW][C]-1059.55031766391[/C][/ROW]
[ROW][C]2982.60908110823[/C][/ROW]
[ROW][C]2133.93281925668[/C][/ROW]
[ROW][C]2517.04318166443[/C][/ROW]
[ROW][C]-2437.26584428693[/C][/ROW]
[ROW][C]3317.25752529229[/C][/ROW]
[ROW][C]-950.518358853185[/C][/ROW]
[ROW][C]-2134.67306731137[/C][/ROW]
[ROW][C]279.501330990597[/C][/ROW]
[ROW][C]-1266.57572392174[/C][/ROW]
[ROW][C]-833.417430782848[/C][/ROW]
[ROW][C]794.978431547177[/C][/ROW]
[ROW][C]-1936.48755917081[/C][/ROW]
[ROW][C]2272.48226386277[/C][/ROW]
[ROW][C]-259.754324029001[/C][/ROW]
[ROW][C]-165.725368541501[/C][/ROW]
[ROW][C]-913.373064129204[/C][/ROW]
[ROW][C]3256.65393370842[/C][/ROW]
[ROW][C]2674.79174642387[/C][/ROW]
[ROW][C]817.437766351631[/C][/ROW]
[ROW][C]687.450571133896[/C][/ROW]
[ROW][C]42.5499938520233[/C][/ROW]
[ROW][C]1593.78075564651[/C][/ROW]
[ROW][C]869.303737905436[/C][/ROW]
[ROW][C]-779.768447315156[/C][/ROW]
[ROW][C]-87.8222230231867[/C][/ROW]
[ROW][C]1179.06505004235[/C][/ROW]
[ROW][C]-2685.42120652531[/C][/ROW]
[ROW][C]3295.76745212931[/C][/ROW]
[ROW][C]1119.20448860576[/C][/ROW]
[ROW][C]592.746533387843[/C][/ROW]
[ROW][C]-941.171225879907[/C][/ROW]
[ROW][C]-1212.45843814273[/C][/ROW]
[ROW][C]-107.630445754966[/C][/ROW]
[ROW][C]-841.822484587518[/C][/ROW]
[ROW][C]-2727.78405973303[/C][/ROW]
[ROW][C]66.7473443538161[/C][/ROW]
[/TABLE]
Source: https://freestatistics.org/blog/index.php?pk=116436&T=2

Globally Unique Identifier (entire table): ba.freestatistics.org/blog/index.php?pk=116436&T=2

As an alternative you can also use a QR Code:  

The GUIDs for individual cells are displayed in the table below:

Estimated ARIMA Residuals
Value
-104.037587137534
-1697.02531492926
783.64101955338
-1373.98338285758
1754.33069685636
4563.41330293097
2029.67619793620
2237.11899352775
667.781629812913
1230.30793063823
683.34573832681
2838.20950061129
-3282.96756740885
1132.89747486147
6277.71677200769
1637.08209478142
-2461.67721586522
551.508716595811
-3018.33193707447
978.566021544564
758.704257052165
-1121.87927250465
2316.50332022338
652.735296021531
-611.572080603048
-2486.85237779493
-1201.13102202491
-456.907258076714
2148.12438113946
5427.12659162901
-1710.51527138946
1684.48277784025
-76.5447115443477
-3367.17686984369
2109.11843889747
-1059.55031766391
2982.60908110823
2133.93281925668
2517.04318166443
-2437.26584428693
3317.25752529229
-950.518358853185
-2134.67306731137
279.501330990597
-1266.57572392174
-833.417430782848
794.978431547177
-1936.48755917081
2272.48226386277
-259.754324029001
-165.725368541501
-913.373064129204
3256.65393370842
2674.79174642387
817.437766351631
687.450571133896
42.5499938520233
1593.78075564651
869.303737905436
-779.768447315156
-87.8222230231867
1179.06505004235
-2685.42120652531
3295.76745212931
1119.20448860576
592.746533387843
-941.171225879907
-1212.45843814273
-107.630445754966
-841.822484587518
-2727.78405973303
66.7473443538161


Parameters (Session):
par1 = FALSE ; par2 = 1 ; par3 = 1 ; par4 = 1 ; par5 = 12 ; par6 = 3 ; par7 = 1 ; par8 = 2 ; par9 = 1 ;
Parameters (R input):
par1 = FALSE ; par2 = 1 ; par3 = 1 ; par4 = 1 ; par5 = 12 ; par6 = 3 ; par7 = 1 ; par8 = 2 ; par9 = 1 ;
R code (references can be found in the software module):
library(lattice)
if (par1 == 'TRUE') par1 <- TRUE
if (par1 == 'FALSE') par1 <- FALSE
par2 <- as.numeric(par2) #Box-Cox lambda transformation parameter
par3 <- as.numeric(par3) #degree of non-seasonal differencing
par4 <- as.numeric(par4) #degree of seasonal differencing
par5 <- as.numeric(par5) #seasonal period
par6 <- as.numeric(par6) #degree (p) of the non-seasonal AR(p) polynomial
par7 <- as.numeric(par7) #degree (q) of the non-seasonal MA(q) polynomial
par8 <- as.numeric(par8) #degree (P) of the seasonal AR(P) polynomial
par9 <- as.numeric(par9) #degree (Q) of the seasonal MA(Q) polynomial
armaGR <- function(arima.out, names, n){
try1 <- arima.out$coef
try2 <- sqrt(diag(arima.out$var.coef))
try.data.frame <- data.frame(matrix(NA,ncol=4,nrow=length(names)))
dimnames(try.data.frame) <- list(names,c('coef','std','tstat','pv'))
try.data.frame[,1] <- try1
for(i in 1:length(try2)) try.data.frame[which(rownames(try.data.frame)==names(try2)[i]),2] <- try2[i]
try.data.frame[,3] <- try.data.frame[,1] / try.data.frame[,2]
try.data.frame[,4] <- round((1-pt(abs(try.data.frame[,3]),df=n-(length(try2)+1)))*2,5)
vector <- rep(NA,length(names))
vector[is.na(try.data.frame[,4])] <- 0
maxi <- which.max(try.data.frame[,4])
continue <- max(try.data.frame[,4],na.rm=TRUE) > .05
vector[maxi] <- 0
list(summary=try.data.frame,next.vector=vector,continue=continue)
}
arimaSelect <- function(series, order=c(13,0,0), seasonal=list(order=c(2,0,0),period=12), include.mean=F){
nrc <- order[1]+order[3]+seasonal$order[1]+seasonal$order[3]
coeff <- matrix(NA, nrow=nrc*2, ncol=nrc)
pval <- matrix(NA, nrow=nrc*2, ncol=nrc)
mylist <- rep(list(NULL), nrc)
names <- NULL
if(order[1] > 0) names <- paste('ar',1:order[1],sep='')
if(order[3] > 0) names <- c( names , paste('ma',1:order[3],sep='') )
if(seasonal$order[1] > 0) names <- c(names, paste('sar',1:seasonal$order[1],sep=''))
if(seasonal$order[3] > 0) names <- c(names, paste('sma',1:seasonal$order[3],sep=''))
arima.out <- arima(series, order=order, seasonal=seasonal, include.mean=include.mean, method='ML')
mylist[[1]] <- arima.out
last.arma <- armaGR(arima.out, names, length(series))
mystop <- FALSE
i <- 1
coeff[i,] <- last.arma[[1]][,1]
pval [i,] <- last.arma[[1]][,4]
i <- 2
aic <- arima.out$aic
while(!mystop){
mylist[[i]] <- arima.out
arima.out <- arima(series, order=order, seasonal=seasonal, include.mean=include.mean, method='ML', fixed=last.arma$next.vector)
aic <- c(aic, arima.out$aic)
last.arma <- armaGR(arima.out, names, length(series))
mystop <- !last.arma$continue
coeff[i,] <- last.arma[[1]][,1]
pval [i,] <- last.arma[[1]][,4]
i <- i+1
}
list(coeff, pval, mylist, aic=aic)
}
arimaSelectplot <- function(arimaSelect.out,noms,choix){
noms <- names(arimaSelect.out[[3]][[1]]$coef)
coeff <- arimaSelect.out[[1]]
k <- min(which(is.na(coeff[,1])))-1
coeff <- coeff[1:k,]
pval <- arimaSelect.out[[2]][1:k,]
aic <- arimaSelect.out$aic[1:k]
coeff[coeff==0] <- NA
n <- ncol(coeff)
if(missing(choix)) choix <- k
layout(matrix(c(1,1,1,2,
3,3,3,2,
3,3,3,4,
5,6,7,7),nr=4),
widths=c(10,35,45,15),
heights=c(30,30,15,15))
couleurs <- rainbow(75)[1:50]#(50)
ticks <- pretty(coeff)
par(mar=c(1,1,3,1))
plot(aic,k:1-.5,type='o',pch=21,bg='blue',cex=2,axes=F,lty=2,xpd=NA)
points(aic[choix],k-choix+.5,pch=21,cex=4,bg=2,xpd=NA)
title('aic',line=2)
par(mar=c(3,0,0,0))
plot(0,axes=F,xlab='',ylab='',xlim=range(ticks),ylim=c(.1,1))
rect(xleft = min(ticks) + (0:49)/50*(max(ticks)-min(ticks)),
xright = min(ticks) + (1:50)/50*(max(ticks)-min(ticks)),
ytop = rep(1,50),
ybottom= rep(0,50),col=couleurs,border=NA)
axis(1,ticks)
rect(xleft=min(ticks),xright=max(ticks),ytop=1,ybottom=0)
text(mean(coeff,na.rm=T),.5,'coefficients',cex=2,font=2)
par(mar=c(1,1,3,1))
image(1:n,1:k,t(coeff[k:1,]),axes=F,col=couleurs,zlim=range(ticks))
for(i in 1:n) for(j in 1:k) if(!is.na(coeff[j,i])) {
if(pval[j,i]<.01) symb = 'green'
else if( (pval[j,i]<.05) & (pval[j,i]>=.01)) symb = 'orange'
else if( (pval[j,i]<.1) & (pval[j,i]>=.05)) symb = 'red'
else symb = 'black'
polygon(c(i+.5 ,i+.2 ,i+.5 ,i+.5),
c(k-j+0.5,k-j+0.5,k-j+0.8,k-j+0.5),
col=symb)
if(j==choix) {
rect(xleft=i-.5,
xright=i+.5,
ybottom=k-j+1.5,
ytop=k-j+.5,
lwd=4)
text(i,
k-j+1,
round(coeff[j,i],2),
cex=1.2,
font=2)
}
else{
rect(xleft=i-.5,xright=i+.5,ybottom=k-j+1.5,ytop=k-j+.5)
text(i,k-j+1,round(coeff[j,i],2),cex=1.2,font=1)
}
}
axis(3,1:n,noms)
par(mar=c(0.5,0,0,0.5))
plot(0,axes=F,xlab='',ylab='',type='n',xlim=c(0,8),ylim=c(-.2,.8))
cols <- c('green','orange','red','black')
niv <- c('0','0.01','0.05','0.1')
for(i in 0:3){
polygon(c(1+2*i ,1+2*i ,1+2*i-.5 ,1+2*i),
c(.4 ,.7 , .4 , .4),
col=cols[i+1])
text(2*i,0.5,niv[i+1],cex=1.5)
}
text(8,.5,1,cex=1.5)
text(4,0,'p-value',cex=2)
box()
residus <- arimaSelect.out[[3]][[choix]]$res
par(mar=c(1,2,4,1))
acf(residus,main='')
title('acf',line=.5)
par(mar=c(1,2,4,1))
pacf(residus,main='')
title('pacf',line=.5)
par(mar=c(2,2,4,1))
qqnorm(residus,main='')
title('qq-norm',line=.5)
qqline(residus)
residus
}
if (par2 == 0) x <- log(x)
if (par2 != 0) x <- x^par2
(selection <- arimaSelect(x, order=c(par6,par3,par7), seasonal=list(order=c(par8,par4,par9), period=par5)))
bitmap(file='test1.png')
resid <- arimaSelectplot(selection)
dev.off()
resid
bitmap(file='test2.png')
acf(resid,length(resid)/2, main='Residual Autocorrelation Function')
dev.off()
bitmap(file='test3.png')
pacf(resid,length(resid)/2, main='Residual Partial Autocorrelation Function')
dev.off()
bitmap(file='test4.png')
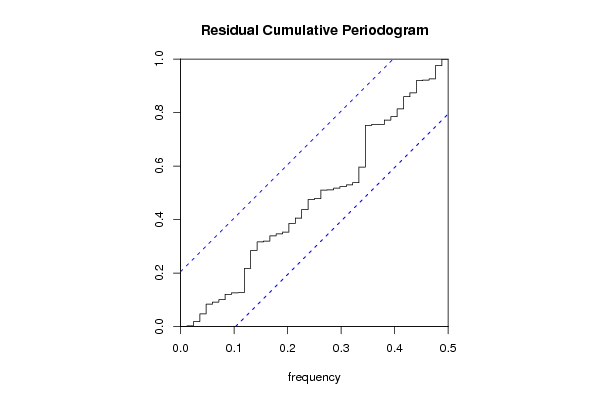
cpgram(resid, main='Residual Cumulative Periodogram')
dev.off()
bitmap(file='test5.png')
hist(resid, main='Residual Histogram', xlab='values of Residuals')
dev.off()
bitmap(file='test6.png')
densityplot(~resid,col='black',main='Residual Density Plot', xlab='values of Residuals')
dev.off()
bitmap(file='test7.png')
qqnorm(resid, main='Residual Normal Q-Q Plot')
qqline(resid)
dev.off()
ncols <- length(selection[[1]][1,])
nrows <- length(selection[[2]][,1])-1
load(file='createtable')
a<-table.start()
a<-table.row.start(a)
a<-table.element(a,'ARIMA Parameter Estimation and Backward Selection', ncols+1,TRUE)
a<-table.row.end(a)
a<-table.row.start(a)
a<-table.element(a,'Iteration', header=TRUE)
for (i in 1:ncols) {
a<-table.element(a,names(selection[[3]][[1]]$coef)[i],header=TRUE)
}
a<-table.row.end(a)
for (j in 1:nrows) {
a<-table.row.start(a)
mydum <- 'Estimates ('
mydum <- paste(mydum,j)
mydum <- paste(mydum,')')
a<-table.element(a,mydum, header=TRUE)
for (i in 1:ncols) {
a<-table.element(a,round(selection[[1]][j,i],4))
}
a<-table.row.end(a)
a<-table.row.start(a)
a<-table.element(a,'(p-val)', header=TRUE)
for (i in 1:ncols) {
mydum <- '('
mydum <- paste(mydum,round(selection[[2]][j,i],4),sep='')
mydum <- paste(mydum,')')
a<-table.element(a,mydum)
}
a<-table.row.end(a)
}
a<-table.end(a)
table.save(a,file='mytable.tab')
a<-table.start()
a<-table.row.start(a)
a<-table.element(a,'Estimated ARIMA Residuals', 1,TRUE)
a<-table.row.end(a)
a<-table.row.start(a)
a<-table.element(a,'Value', 1,TRUE)
a<-table.row.end(a)
for (i in (par4*par5+par3):length(resid)) {
a<-table.row.start(a)
a<-table.element(a,resid[i])
a<-table.row.end(a)
}
a<-table.end(a)
table.save(a,file='mytable1.tab')