| Multiple Linear Regression - Estimated Regression Equation |
| GemiddeldeTemperatuur[t] = + 1.89334475185611 + 0.0456508505260396UrenZonneschijn[t] + 0.13932506715621Neerslagdagen[t] + 0.26861894142388Onweersdagen[t] -0.578107831724152Sneeuwdagen[t] + e[t] |
| Multiple Linear Regression - Ordinary Least Squares | |||||
| Variable | Parameter | S.D. | T-STAT H0: parameter = 0 | 2-tail p-value | 1-tail p-value |
| (Intercept) | 1.89334475185611 | 2.6699 | 0.7091 | 0.481464 | 0.240732 |
| UrenZonneschijn | 0.0456508505260396 | 0.010017 | 4.5573 | 3.3e-05 | 1.6e-05 |
| Neerslagdagen | 0.13932506715621 | 0.115008 | 1.2114 | 0.231313 | 0.115656 |
| Onweersdagen | 0.26861894142388 | 0.096456 | 2.7849 | 0.007496 | 0.003748 |
| Sneeuwdagen | -0.578107831724152 | 0.143342 | -4.0331 | 0.000184 | 9.2e-05 |
| Multiple Linear Regression - Regression Statistics | |
| Multiple R | 0.893898479690697 |
| R-squared | 0.79905449199334 |
| Adjusted R-squared | 0.783294059992818 |
| F-TEST (value) | 50.7000374080391 |
| F-TEST (DF numerator) | 4 |
| F-TEST (DF denominator) | 51 |
| p-value | 0 |
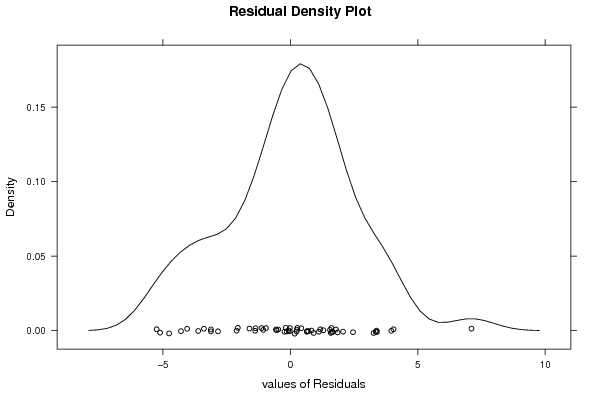
| Multiple Linear Regression - Residual Statistics | |
| Residual Standard Deviation | 2.61024325365338 |
| Sum Squared Residuals | 347.481862005391 |
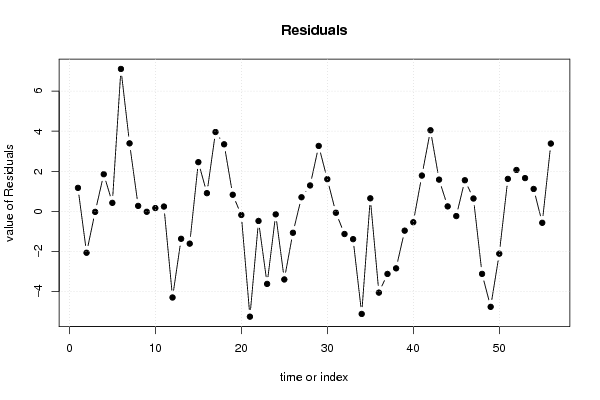
| Multiple Linear Regression - Actuals, Interpolation, and Residuals | |||
| Time or Index | Actuals | Interpolation Forecast | Residuals Prediction Error |
| 1 | 9.3 | 8.12427457700125 | 1.17572542299875 |
| 2 | 14.2 | 16.2607405949993 | -2.0607405949993 |
| 3 | 17.3 | 17.3221567484419 | -0.0221567484418873 |
| 4 | 23 | 21.1433422230102 | 1.85665777698977 |
| 5 | 16.3 | 15.8714754977073 | 0.428524502292716 |
| 6 | 18.4 | 11.2928829223375 | 7.10711707766252 |
| 7 | 14.2 | 10.8038763988672 | 3.39612360113277 |
| 8 | 9.1 | 8.8235011693852 | 0.276498830614809 |
| 9 | 5.9 | 5.9177410914092 | -0.0177410914091945 |
| 10 | 7.2 | 7.03183636857616 | 0.168163631423839 |
| 11 | 6.8 | 6.55634773869104 | 0.243652261308959 |
| 12 | 8 | 12.2919552891988 | -4.29195528919878 |
| 13 | 14.3 | 15.664043125523 | -1.364043125523 |
| 14 | 14.6 | 16.2059008954975 | -1.60590089549754 |
| 15 | 17.5 | 15.0416536004152 | 2.45834639958479 |
| 16 | 17.2 | 16.2877125342373 | 0.91228746576274 |
| 17 | 17.2 | 13.2383876180316 | 3.96161238196842 |
| 18 | 14.1 | 10.7505668710307 | 3.34943312896925 |
| 19 | 10.4 | 9.56764066466033 | 0.832359335339666 |
| 20 | 6.8 | 6.97720071582047 | -0.177200715820468 |
| 21 | 4.1 | 9.34779421319015 | -5.24779421319015 |
| 22 | 6.5 | 6.9742870696662 | -0.474287069666202 |
| 23 | 6.1 | 9.71516553970317 | -3.61516553970317 |
| 24 | 6.3 | 6.44360090869781 | -0.14360090869781 |
| 25 | 9.3 | 12.6929499272972 | -3.3929499272972 |
| 26 | 16.4 | 17.4633132006 | -1.06331320060001 |
| 27 | 16.1 | 15.3934676550678 | 0.706532344932196 |
| 28 | 18 | 16.7033152201278 | 1.2966847798722 |
| 29 | 17.6 | 14.332384638928 | 3.267615361072 |
| 30 | 14 | 12.3897935893882 | 1.61020641061183 |
| 31 | 10.5 | 10.5654227770959 | -0.065422777095902 |
| 32 | 6.9 | 8.02507749660161 | -1.12507749660161 |
| 33 | 2.8 | 4.18162208172829 | -1.38162208172829 |
| 34 | 0.7 | 5.81210786162291 | -5.11210786162291 |
| 35 | 3.6 | 2.94542616454218 | 0.654573835457818 |
| 36 | 6.7 | 10.7491084403524 | -4.04910844035241 |
| 37 | 12.5 | 15.6169768765418 | -3.11697687654182 |
| 38 | 14.4 | 17.2387217179736 | -2.83872171797364 |
| 39 | 16.5 | 17.4580270388677 | -0.958027038867656 |
| 40 | 18.7 | 19.2386182026566 | -0.538618202656589 |
| 41 | 19.4 | 17.611379206219 | 1.78862079378098 |
| 42 | 15.8 | 11.7512228125998 | 4.04877718740021 |
| 43 | 11.3 | 9.71354214797464 | 1.58645785202536 |
| 44 | 9.7 | 9.44804484597841 | 0.251955154021586 |
| 45 | 2.9 | 3.13094321280061 | -0.230943212800607 |
| 46 | 0.1 | -1.45542200769431 | 1.55542200769431 |
| 47 | 2.5 | 1.85441847731428 | 0.645581522685715 |
| 48 | 6.7 | 9.81548791347837 | -3.11548791347837 |
| 49 | 10.3 | 15.0583863534912 | -4.75838635349124 |
| 50 | 11.2 | 13.3075556310651 | -2.10755563106514 |
| 51 | 17.4 | 15.7766974667779 | 1.6233025332221 |
| 52 | 20.5 | 18.4320122545354 | 2.06798774546462 |
| 53 | 17 | 15.3356210893485 | 1.66437891065148 |
| 54 | 14.2 | 13.0782191172826 | 1.12178088271741 |
| 55 | 10.6 | 11.1667106874975 | -0.56671068749746 |
| 56 | 6.1 | 2.71476352584043 | 3.38523647415957 |
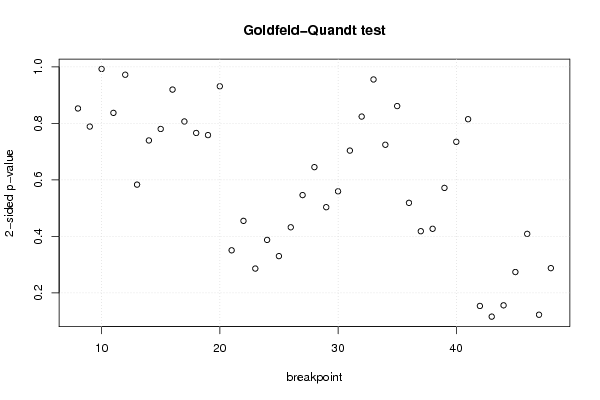
| Goldfeld-Quandt test for Heteroskedasticity | |||
| p-values | Alternative Hypothesis | ||
| breakpoint index | greater | 2-sided | less |
| 8 | 0.573515480297434 | 0.852969039405133 | 0.426484519702566 |
| 9 | 0.605566529340638 | 0.788866941318724 | 0.394433470659362 |
| 10 | 0.496395662161856 | 0.992791324323712 | 0.503604337838144 |
| 11 | 0.418671002891678 | 0.837342005783356 | 0.581328997108322 |
| 12 | 0.513849797875447 | 0.972300404249107 | 0.486150202124553 |
| 13 | 0.708311230714714 | 0.583377538570572 | 0.291688769285286 |
| 14 | 0.6301647919096 | 0.7396704161808 | 0.3698352080904 |
| 15 | 0.609826279163602 | 0.780347441672796 | 0.390173720836398 |
| 16 | 0.540121238117582 | 0.919757523764835 | 0.459878761882418 |
| 17 | 0.596555212763035 | 0.80688957447393 | 0.403444787236965 |
| 18 | 0.616920427837161 | 0.766159144325678 | 0.383079572162839 |
| 19 | 0.62065507498922 | 0.75868985002156 | 0.37934492501078 |
| 20 | 0.534259557788596 | 0.931480884422808 | 0.465740442211404 |
| 21 | 0.824568791404964 | 0.350862417190073 | 0.175431208595036 |
| 22 | 0.772449126287602 | 0.455101747424795 | 0.227550873712398 |
| 23 | 0.856856910589365 | 0.286286178821269 | 0.143143089410635 |
| 24 | 0.80618045835612 | 0.387639083287758 | 0.193819541643879 |
| 25 | 0.834826517784207 | 0.330346964431587 | 0.165173482215793 |
| 26 | 0.783817359329857 | 0.432365281340287 | 0.216182640670144 |
| 27 | 0.72686954948381 | 0.54626090103238 | 0.27313045051619 |
| 28 | 0.677385442534153 | 0.645229114931695 | 0.322614557465847 |
| 29 | 0.74826781515028 | 0.503464369699441 | 0.251732184849721 |
| 30 | 0.720143228983261 | 0.559713542033477 | 0.279856771016739 |
| 31 | 0.648098604690518 | 0.703802790618964 | 0.351901395309482 |
| 32 | 0.587903777373583 | 0.824192445252834 | 0.412096222626417 |
| 33 | 0.522200703586818 | 0.955598592826365 | 0.477799296413182 |
| 34 | 0.637786273136492 | 0.724427453727017 | 0.362213726863508 |
| 35 | 0.569276610987664 | 0.861446778024672 | 0.430723389012336 |
| 36 | 0.740584803939037 | 0.518830392121925 | 0.259415196060963 |
| 37 | 0.79077402182861 | 0.418451956342781 | 0.20922597817139 |
| 38 | 0.786464778024942 | 0.427070443950117 | 0.213535221975058 |
| 39 | 0.714141995299141 | 0.571716009401718 | 0.285858004700859 |
| 40 | 0.632578976362716 | 0.734842047274568 | 0.367421023637284 |
| 41 | 0.59256398359146 | 0.81487203281708 | 0.40743601640854 |
| 42 | 0.923067376264908 | 0.153865247470184 | 0.076932623735092 |
| 43 | 0.941980461975206 | 0.116039076049588 | 0.058019538024794 |
| 44 | 0.921901555223179 | 0.156196889553642 | 0.078098444776821 |
| 45 | 0.86305119226397 | 0.27389761547206 | 0.13694880773603 |
| 46 | 0.795479955124688 | 0.409040089750623 | 0.204520044875312 |
| 47 | 0.938622320549194 | 0.122755358901612 | 0.061377679450806 |
| 48 | 0.856132872331073 | 0.287734255337853 | 0.143867127668927 |
| Meta Analysis of Goldfeld-Quandt test for Heteroskedasticity | |||
| Description | # significant tests | % significant tests | OK/NOK |
| 1% type I error level | 0 | 0 | OK |
| 5% type I error level | 0 | 0 | OK |
| 10% type I error level | 0 | 0 | OK |