Free Statistics

of Irreproducible Research!

Author's title

Author*The author of this computation has been verified*
R Software Modulerwasp_autocorrelation.wasp
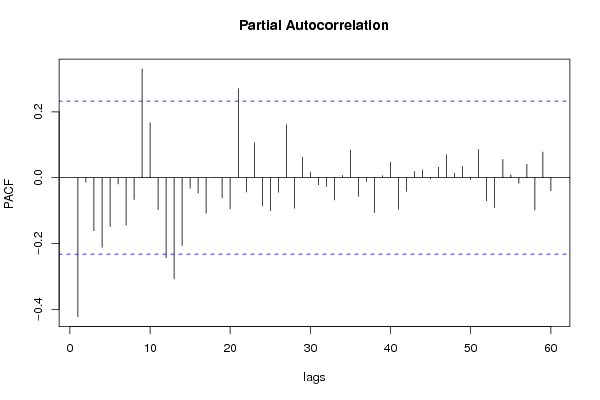
Title produced by software(Partial) Autocorrelation Function
Date of computationTue, 28 Dec 2010 16:33:51 +0000
Cite this page as followsStatistical Computations at FreeStatistics.org, Office for Research Development and Education, URL https://freestatistics.org/blog/index.php?v=date/2010/Dec/28/t129355395335p7ruyvu9tjt4h.htm/, Retrieved Sat, 04 May 2024 23:50:19 +0000
Statistical Computations at FreeStatistics.org, Office for Research Development and Education, URL https://freestatistics.org/blog/index.php?pk=116411, Retrieved Sat, 04 May 2024 23:50:19 +0000
QR Codes:

Original text written by user:
IsPrivate?No (this computation is public)
User-defined keywords
Estimated Impact164
Family? (F = Feedback message, R = changed R code, M = changed R Module, P = changed Parameters, D = changed Data)
-     [(Partial) Autocorrelation Function] [Partial autocorre...] [2008-12-09 20:18:51] [12d343c4448a5f9e527bb31caeac580b]
-   P   [(Partial) Autocorrelation Function] [Partial autocorre...] [2008-12-09 20:27:26] [12d343c4448a5f9e527bb31caeac580b]
- RMPD    [(Partial) Autocorrelation Function] [Autocorrelatie bi...] [2009-12-21 14:51:48] [9dbb467a28ad600d808a4e47d5e0774e]
-   P       [(Partial) Autocorrelation Function] [Autocorrelatie bi...] [2009-12-21 15:18:45] [9dbb467a28ad600d808a4e47d5e0774e]
-               [(Partial) Autocorrelation Function] [paper] [2010-12-28 16:33:51] [d9c9d376f221f20fcf2fb8b8e1a32c2e] [Current]
Feedback Forum

Post a new message
Dataseries X:
36845
35338
35022
34777
26887
23970
22780
17351
21382
24561
17409
11514
31514
27071
29462
26105
22397
23843
21705
18089
20764
25316
17704
15548
28029
29383
36438
32034
22679
24319
18004
17537
20366
22782
19169
13807
29743
25591
29096
26482
22405
27044
17970
18730
19684
19785
18479
10698
31956
29506
34506
27165
26736
23691
18157
17328
18205
20995
17382
9367
31124
26551
30651
25859
25100
25778
20418
18688
20424
24776
19814
12738
31566
30111
30019
31934
25826
26835
20205
17789
20520
22518
15572
11509


Summary of computational transaction
Raw Inputview raw input (R code)
Raw Outputview raw output of R engine
Computing time1 seconds
R Server'George Udny Yule' @ 72.249.76.132

\begin{tabular}{lllllllll}
\hline
Summary of computational transaction \tabularnewline
Raw Input & view raw input (R code)  \tabularnewline
Raw Output & view raw output of R engine  \tabularnewline
Computing time & 1 seconds \tabularnewline
R Server & 'George Udny Yule' @ 72.249.76.132 \tabularnewline
\hline
\end{tabular}
%Source: https://freestatistics.org/blog/index.php?pk=116411&T=0

[TABLE]
[ROW][C]Summary of computational transaction[/C][/ROW]
[ROW][C]Raw Input[/C][C]view raw input (R code) [/C][/ROW]
[ROW][C]Raw Output[/C][C]view raw output of R engine [/C][/ROW]
[ROW][C]Computing time[/C][C]1 seconds[/C][/ROW]
[ROW][C]R Server[/C][C]'George Udny Yule' @ 72.249.76.132[/C][/ROW]
[/TABLE]
Source: https://freestatistics.org/blog/index.php?pk=116411&T=0

Globally Unique Identifier (entire table): ba.freestatistics.org/blog/index.php?pk=116411&T=0

As an alternative you can also use a QR Code:  

The GUIDs for individual cells are displayed in the table below:

Summary of computational transaction
Raw Inputview raw input (R code)
Raw Outputview raw output of R engine
Computing time1 seconds
R Server'George Udny Yule' @ 72.249.76.132


Autocorrelation Function
Time lag kACF(k)T-STATP-value
1-0.422295-3.55830.000335
20.1669721.40690.081905
3-0.198065-1.66890.049768
4-0.029929-0.25220.400813
5-0.032583-0.27460.392229
60.0748890.6310.265024
7-0.094539-0.79660.21417
80.0874730.73710.231757
90.2235171.88340.031872
10-0.100138-0.84380.200813
11-0.063439-0.53450.297318
12-0.201754-1.70.046753
13-0.093858-0.79090.215828
140.0924980.77940.219168
150.1107940.93360.176846
16-0.035186-0.29650.383862
170.0398690.33590.368953
180.0563020.47440.318331
19-0.108121-0.9110.182677
20-0.033651-0.28350.388792
210.0409170.34480.365644
22-0.219948-1.85330.033996
230.3732263.14490.001213
24-0.139331-1.1740.122154
250.1448761.22080.11311
26-0.079282-0.6680.253136
270.0683450.57590.283258
28-0.236698-1.99450.024971
290.2380822.00610.024327
30-0.178382-1.50310.068628
310.0939260.79140.215664
320.0456890.3850.3507
33-0.083801-0.70610.241212
340.0719630.60640.273101
35-0.009791-0.08250.467241
36-0.103072-0.86850.194023
37-0.008692-0.07320.47091
38-0.002241-0.01890.492493
390.0166430.14020.444434
400.0430720.36290.358867
41-0.038966-0.32830.371812
42-0.029985-0.25270.40063
430.0412480.34760.364598
440.0856440.72160.23644
45-0.134805-1.13590.129911
460.0867420.73090.233623
47-0.063439-0.53450.297316
480.066290.55860.289105
490.0307530.25910.398142
500.0390770.32930.371461
51-0.118349-0.99720.161021
520.1222781.03030.153175
53-0.079146-0.66690.253499
540.0683630.5760.283206
55-0.068336-0.57580.283282
56-0.029932-0.25220.400802
570.021930.18480.426963
580.028360.2390.405909
590.0077780.06550.473966
60-0.075443-0.63570.26351

\begin{tabular}{lllllllll}
\hline
Autocorrelation Function \tabularnewline
Time lag k & ACF(k) & T-STAT & P-value \tabularnewline
1 & -0.422295 & -3.5583 & 0.000335 \tabularnewline
2 & 0.166972 & 1.4069 & 0.081905 \tabularnewline
3 & -0.198065 & -1.6689 & 0.049768 \tabularnewline
4 & -0.029929 & -0.2522 & 0.400813 \tabularnewline
5 & -0.032583 & -0.2746 & 0.392229 \tabularnewline
6 & 0.074889 & 0.631 & 0.265024 \tabularnewline
7 & -0.094539 & -0.7966 & 0.21417 \tabularnewline
8 & 0.087473 & 0.7371 & 0.231757 \tabularnewline
9 & 0.223517 & 1.8834 & 0.031872 \tabularnewline
10 & -0.100138 & -0.8438 & 0.200813 \tabularnewline
11 & -0.063439 & -0.5345 & 0.297318 \tabularnewline
12 & -0.201754 & -1.7 & 0.046753 \tabularnewline
13 & -0.093858 & -0.7909 & 0.215828 \tabularnewline
14 & 0.092498 & 0.7794 & 0.219168 \tabularnewline
15 & 0.110794 & 0.9336 & 0.176846 \tabularnewline
16 & -0.035186 & -0.2965 & 0.383862 \tabularnewline
17 & 0.039869 & 0.3359 & 0.368953 \tabularnewline
18 & 0.056302 & 0.4744 & 0.318331 \tabularnewline
19 & -0.108121 & -0.911 & 0.182677 \tabularnewline
20 & -0.033651 & -0.2835 & 0.388792 \tabularnewline
21 & 0.040917 & 0.3448 & 0.365644 \tabularnewline
22 & -0.219948 & -1.8533 & 0.033996 \tabularnewline
23 & 0.373226 & 3.1449 & 0.001213 \tabularnewline
24 & -0.139331 & -1.174 & 0.122154 \tabularnewline
25 & 0.144876 & 1.2208 & 0.11311 \tabularnewline
26 & -0.079282 & -0.668 & 0.253136 \tabularnewline
27 & 0.068345 & 0.5759 & 0.283258 \tabularnewline
28 & -0.236698 & -1.9945 & 0.024971 \tabularnewline
29 & 0.238082 & 2.0061 & 0.024327 \tabularnewline
30 & -0.178382 & -1.5031 & 0.068628 \tabularnewline
31 & 0.093926 & 0.7914 & 0.215664 \tabularnewline
32 & 0.045689 & 0.385 & 0.3507 \tabularnewline
33 & -0.083801 & -0.7061 & 0.241212 \tabularnewline
34 & 0.071963 & 0.6064 & 0.273101 \tabularnewline
35 & -0.009791 & -0.0825 & 0.467241 \tabularnewline
36 & -0.103072 & -0.8685 & 0.194023 \tabularnewline
37 & -0.008692 & -0.0732 & 0.47091 \tabularnewline
38 & -0.002241 & -0.0189 & 0.492493 \tabularnewline
39 & 0.016643 & 0.1402 & 0.444434 \tabularnewline
40 & 0.043072 & 0.3629 & 0.358867 \tabularnewline
41 & -0.038966 & -0.3283 & 0.371812 \tabularnewline
42 & -0.029985 & -0.2527 & 0.40063 \tabularnewline
43 & 0.041248 & 0.3476 & 0.364598 \tabularnewline
44 & 0.085644 & 0.7216 & 0.23644 \tabularnewline
45 & -0.134805 & -1.1359 & 0.129911 \tabularnewline
46 & 0.086742 & 0.7309 & 0.233623 \tabularnewline
47 & -0.063439 & -0.5345 & 0.297316 \tabularnewline
48 & 0.06629 & 0.5586 & 0.289105 \tabularnewline
49 & 0.030753 & 0.2591 & 0.398142 \tabularnewline
50 & 0.039077 & 0.3293 & 0.371461 \tabularnewline
51 & -0.118349 & -0.9972 & 0.161021 \tabularnewline
52 & 0.122278 & 1.0303 & 0.153175 \tabularnewline
53 & -0.079146 & -0.6669 & 0.253499 \tabularnewline
54 & 0.068363 & 0.576 & 0.283206 \tabularnewline
55 & -0.068336 & -0.5758 & 0.283282 \tabularnewline
56 & -0.029932 & -0.2522 & 0.400802 \tabularnewline
57 & 0.02193 & 0.1848 & 0.426963 \tabularnewline
58 & 0.02836 & 0.239 & 0.405909 \tabularnewline
59 & 0.007778 & 0.0655 & 0.473966 \tabularnewline
60 & -0.075443 & -0.6357 & 0.26351 \tabularnewline
\hline
\end{tabular}
%Source: https://freestatistics.org/blog/index.php?pk=116411&T=1

[TABLE]
[ROW][C]Autocorrelation Function[/C][/ROW]
[ROW][C]Time lag k[/C][C]ACF(k)[/C][C]T-STAT[/C][C]P-value[/C][/ROW]
[ROW][C]1[/C][C]-0.422295[/C][C]-3.5583[/C][C]0.000335[/C][/ROW]
[ROW][C]2[/C][C]0.166972[/C][C]1.4069[/C][C]0.081905[/C][/ROW]
[ROW][C]3[/C][C]-0.198065[/C][C]-1.6689[/C][C]0.049768[/C][/ROW]
[ROW][C]4[/C][C]-0.029929[/C][C]-0.2522[/C][C]0.400813[/C][/ROW]
[ROW][C]5[/C][C]-0.032583[/C][C]-0.2746[/C][C]0.392229[/C][/ROW]
[ROW][C]6[/C][C]0.074889[/C][C]0.631[/C][C]0.265024[/C][/ROW]
[ROW][C]7[/C][C]-0.094539[/C][C]-0.7966[/C][C]0.21417[/C][/ROW]
[ROW][C]8[/C][C]0.087473[/C][C]0.7371[/C][C]0.231757[/C][/ROW]
[ROW][C]9[/C][C]0.223517[/C][C]1.8834[/C][C]0.031872[/C][/ROW]
[ROW][C]10[/C][C]-0.100138[/C][C]-0.8438[/C][C]0.200813[/C][/ROW]
[ROW][C]11[/C][C]-0.063439[/C][C]-0.5345[/C][C]0.297318[/C][/ROW]
[ROW][C]12[/C][C]-0.201754[/C][C]-1.7[/C][C]0.046753[/C][/ROW]
[ROW][C]13[/C][C]-0.093858[/C][C]-0.7909[/C][C]0.215828[/C][/ROW]
[ROW][C]14[/C][C]0.092498[/C][C]0.7794[/C][C]0.219168[/C][/ROW]
[ROW][C]15[/C][C]0.110794[/C][C]0.9336[/C][C]0.176846[/C][/ROW]
[ROW][C]16[/C][C]-0.035186[/C][C]-0.2965[/C][C]0.383862[/C][/ROW]
[ROW][C]17[/C][C]0.039869[/C][C]0.3359[/C][C]0.368953[/C][/ROW]
[ROW][C]18[/C][C]0.056302[/C][C]0.4744[/C][C]0.318331[/C][/ROW]
[ROW][C]19[/C][C]-0.108121[/C][C]-0.911[/C][C]0.182677[/C][/ROW]
[ROW][C]20[/C][C]-0.033651[/C][C]-0.2835[/C][C]0.388792[/C][/ROW]
[ROW][C]21[/C][C]0.040917[/C][C]0.3448[/C][C]0.365644[/C][/ROW]
[ROW][C]22[/C][C]-0.219948[/C][C]-1.8533[/C][C]0.033996[/C][/ROW]
[ROW][C]23[/C][C]0.373226[/C][C]3.1449[/C][C]0.001213[/C][/ROW]
[ROW][C]24[/C][C]-0.139331[/C][C]-1.174[/C][C]0.122154[/C][/ROW]
[ROW][C]25[/C][C]0.144876[/C][C]1.2208[/C][C]0.11311[/C][/ROW]
[ROW][C]26[/C][C]-0.079282[/C][C]-0.668[/C][C]0.253136[/C][/ROW]
[ROW][C]27[/C][C]0.068345[/C][C]0.5759[/C][C]0.283258[/C][/ROW]
[ROW][C]28[/C][C]-0.236698[/C][C]-1.9945[/C][C]0.024971[/C][/ROW]
[ROW][C]29[/C][C]0.238082[/C][C]2.0061[/C][C]0.024327[/C][/ROW]
[ROW][C]30[/C][C]-0.178382[/C][C]-1.5031[/C][C]0.068628[/C][/ROW]
[ROW][C]31[/C][C]0.093926[/C][C]0.7914[/C][C]0.215664[/C][/ROW]
[ROW][C]32[/C][C]0.045689[/C][C]0.385[/C][C]0.3507[/C][/ROW]
[ROW][C]33[/C][C]-0.083801[/C][C]-0.7061[/C][C]0.241212[/C][/ROW]
[ROW][C]34[/C][C]0.071963[/C][C]0.6064[/C][C]0.273101[/C][/ROW]
[ROW][C]35[/C][C]-0.009791[/C][C]-0.0825[/C][C]0.467241[/C][/ROW]
[ROW][C]36[/C][C]-0.103072[/C][C]-0.8685[/C][C]0.194023[/C][/ROW]
[ROW][C]37[/C][C]-0.008692[/C][C]-0.0732[/C][C]0.47091[/C][/ROW]
[ROW][C]38[/C][C]-0.002241[/C][C]-0.0189[/C][C]0.492493[/C][/ROW]
[ROW][C]39[/C][C]0.016643[/C][C]0.1402[/C][C]0.444434[/C][/ROW]
[ROW][C]40[/C][C]0.043072[/C][C]0.3629[/C][C]0.358867[/C][/ROW]
[ROW][C]41[/C][C]-0.038966[/C][C]-0.3283[/C][C]0.371812[/C][/ROW]
[ROW][C]42[/C][C]-0.029985[/C][C]-0.2527[/C][C]0.40063[/C][/ROW]
[ROW][C]43[/C][C]0.041248[/C][C]0.3476[/C][C]0.364598[/C][/ROW]
[ROW][C]44[/C][C]0.085644[/C][C]0.7216[/C][C]0.23644[/C][/ROW]
[ROW][C]45[/C][C]-0.134805[/C][C]-1.1359[/C][C]0.129911[/C][/ROW]
[ROW][C]46[/C][C]0.086742[/C][C]0.7309[/C][C]0.233623[/C][/ROW]
[ROW][C]47[/C][C]-0.063439[/C][C]-0.5345[/C][C]0.297316[/C][/ROW]
[ROW][C]48[/C][C]0.06629[/C][C]0.5586[/C][C]0.289105[/C][/ROW]
[ROW][C]49[/C][C]0.030753[/C][C]0.2591[/C][C]0.398142[/C][/ROW]
[ROW][C]50[/C][C]0.039077[/C][C]0.3293[/C][C]0.371461[/C][/ROW]
[ROW][C]51[/C][C]-0.118349[/C][C]-0.9972[/C][C]0.161021[/C][/ROW]
[ROW][C]52[/C][C]0.122278[/C][C]1.0303[/C][C]0.153175[/C][/ROW]
[ROW][C]53[/C][C]-0.079146[/C][C]-0.6669[/C][C]0.253499[/C][/ROW]
[ROW][C]54[/C][C]0.068363[/C][C]0.576[/C][C]0.283206[/C][/ROW]
[ROW][C]55[/C][C]-0.068336[/C][C]-0.5758[/C][C]0.283282[/C][/ROW]
[ROW][C]56[/C][C]-0.029932[/C][C]-0.2522[/C][C]0.400802[/C][/ROW]
[ROW][C]57[/C][C]0.02193[/C][C]0.1848[/C][C]0.426963[/C][/ROW]
[ROW][C]58[/C][C]0.02836[/C][C]0.239[/C][C]0.405909[/C][/ROW]
[ROW][C]59[/C][C]0.007778[/C][C]0.0655[/C][C]0.473966[/C][/ROW]
[ROW][C]60[/C][C]-0.075443[/C][C]-0.6357[/C][C]0.26351[/C][/ROW]
[/TABLE]
Source: https://freestatistics.org/blog/index.php?pk=116411&T=1

Globally Unique Identifier (entire table): ba.freestatistics.org/blog/index.php?pk=116411&T=1

As an alternative you can also use a QR Code:  

The GUIDs for individual cells are displayed in the table below:

Autocorrelation Function
Time lag kACF(k)T-STATP-value
1-0.422295-3.55830.000335
20.1669721.40690.081905
3-0.198065-1.66890.049768
4-0.029929-0.25220.400813
5-0.032583-0.27460.392229
60.0748890.6310.265024
7-0.094539-0.79660.21417
80.0874730.73710.231757
90.2235171.88340.031872
10-0.100138-0.84380.200813
11-0.063439-0.53450.297318
12-0.201754-1.70.046753
13-0.093858-0.79090.215828
140.0924980.77940.219168
150.1107940.93360.176846
16-0.035186-0.29650.383862
170.0398690.33590.368953
180.0563020.47440.318331
19-0.108121-0.9110.182677
20-0.033651-0.28350.388792
210.0409170.34480.365644
22-0.219948-1.85330.033996
230.3732263.14490.001213
24-0.139331-1.1740.122154
250.1448761.22080.11311
26-0.079282-0.6680.253136
270.0683450.57590.283258
28-0.236698-1.99450.024971
290.2380822.00610.024327
30-0.178382-1.50310.068628
310.0939260.79140.215664
320.0456890.3850.3507
33-0.083801-0.70610.241212
340.0719630.60640.273101
35-0.009791-0.08250.467241
36-0.103072-0.86850.194023
37-0.008692-0.07320.47091
38-0.002241-0.01890.492493
390.0166430.14020.444434
400.0430720.36290.358867
41-0.038966-0.32830.371812
42-0.029985-0.25270.40063
430.0412480.34760.364598
440.0856440.72160.23644
45-0.134805-1.13590.129911
460.0867420.73090.233623
47-0.063439-0.53450.297316
480.066290.55860.289105
490.0307530.25910.398142
500.0390770.32930.371461
51-0.118349-0.99720.161021
520.1222781.03030.153175
53-0.079146-0.66690.253499
540.0683630.5760.283206
55-0.068336-0.57580.283282
56-0.029932-0.25220.400802
570.021930.18480.426963
580.028360.2390.405909
590.0077780.06550.473966
60-0.075443-0.63570.26351


Partial Autocorrelation Function
Time lag kPACF(k)T-STATP-value
1-0.422295-3.55830.000335
2-0.013827-0.11650.453791
3-0.161188-1.35820.089351
4-0.211714-1.78390.039354
5-0.14869-1.25290.107179
6-0.019046-0.16050.436477
7-0.144249-1.21550.114108
8-0.066302-0.55870.289073
90.330262.78280.00345
100.1667891.40540.082133
11-0.096396-0.81220.209683
12-0.243318-2.05020.022018
13-0.307614-2.5920.005788
14-0.205825-1.73430.043602
15-0.032102-0.27050.393781
16-0.04668-0.39330.347628
17-0.108058-0.91050.182816
180.0007110.0060.497617
19-0.061193-0.51560.30386
20-0.094571-0.79690.214092
210.2703172.27770.012878
22-0.043803-0.36910.356578
230.1063620.89620.186581
24-0.085876-0.72360.235843
25-0.100337-0.84550.20035
26-0.044454-0.37460.354547
270.1612141.35840.089317
28-0.092586-0.78010.21895
290.0622060.52420.300901
300.0170330.14350.443141
31-0.021664-0.18250.427838
32-0.026696-0.22490.411335
33-0.067683-0.57030.285136
340.0068260.05750.477147
350.0838940.70690.240971
36-0.056814-0.47870.316804
37-0.011542-0.09730.461398
38-0.106237-0.89520.186862
390.0057150.04820.480863
400.0466140.39280.347832
41-0.096363-0.8120.209761
42-0.041497-0.34970.363814
430.0185910.15670.437982
440.0237830.20040.420869
45-0.00429-0.03620.485631
460.0317960.26790.394769
470.0698620.58870.278977
480.0134330.11320.4551
490.0340690.28710.387447
50-0.005536-0.04660.481464
510.0854770.72020.236869
52-0.0701-0.59070.278307
53-0.091052-0.76720.222747
540.0551810.4650.321689
550.0090950.07660.469563
56-0.017102-0.14410.442915
570.0403990.34040.367276
58-0.098515-0.83010.204631
590.0783170.65990.255723
60-0.039485-0.33270.370169

\begin{tabular}{lllllllll}
\hline
Partial Autocorrelation Function \tabularnewline
Time lag k & PACF(k) & T-STAT & P-value \tabularnewline
1 & -0.422295 & -3.5583 & 0.000335 \tabularnewline
2 & -0.013827 & -0.1165 & 0.453791 \tabularnewline
3 & -0.161188 & -1.3582 & 0.089351 \tabularnewline
4 & -0.211714 & -1.7839 & 0.039354 \tabularnewline
5 & -0.14869 & -1.2529 & 0.107179 \tabularnewline
6 & -0.019046 & -0.1605 & 0.436477 \tabularnewline
7 & -0.144249 & -1.2155 & 0.114108 \tabularnewline
8 & -0.066302 & -0.5587 & 0.289073 \tabularnewline
9 & 0.33026 & 2.7828 & 0.00345 \tabularnewline
10 & 0.166789 & 1.4054 & 0.082133 \tabularnewline
11 & -0.096396 & -0.8122 & 0.209683 \tabularnewline
12 & -0.243318 & -2.0502 & 0.022018 \tabularnewline
13 & -0.307614 & -2.592 & 0.005788 \tabularnewline
14 & -0.205825 & -1.7343 & 0.043602 \tabularnewline
15 & -0.032102 & -0.2705 & 0.393781 \tabularnewline
16 & -0.04668 & -0.3933 & 0.347628 \tabularnewline
17 & -0.108058 & -0.9105 & 0.182816 \tabularnewline
18 & 0.000711 & 0.006 & 0.497617 \tabularnewline
19 & -0.061193 & -0.5156 & 0.30386 \tabularnewline
20 & -0.094571 & -0.7969 & 0.214092 \tabularnewline
21 & 0.270317 & 2.2777 & 0.012878 \tabularnewline
22 & -0.043803 & -0.3691 & 0.356578 \tabularnewline
23 & 0.106362 & 0.8962 & 0.186581 \tabularnewline
24 & -0.085876 & -0.7236 & 0.235843 \tabularnewline
25 & -0.100337 & -0.8455 & 0.20035 \tabularnewline
26 & -0.044454 & -0.3746 & 0.354547 \tabularnewline
27 & 0.161214 & 1.3584 & 0.089317 \tabularnewline
28 & -0.092586 & -0.7801 & 0.21895 \tabularnewline
29 & 0.062206 & 0.5242 & 0.300901 \tabularnewline
30 & 0.017033 & 0.1435 & 0.443141 \tabularnewline
31 & -0.021664 & -0.1825 & 0.427838 \tabularnewline
32 & -0.026696 & -0.2249 & 0.411335 \tabularnewline
33 & -0.067683 & -0.5703 & 0.285136 \tabularnewline
34 & 0.006826 & 0.0575 & 0.477147 \tabularnewline
35 & 0.083894 & 0.7069 & 0.240971 \tabularnewline
36 & -0.056814 & -0.4787 & 0.316804 \tabularnewline
37 & -0.011542 & -0.0973 & 0.461398 \tabularnewline
38 & -0.106237 & -0.8952 & 0.186862 \tabularnewline
39 & 0.005715 & 0.0482 & 0.480863 \tabularnewline
40 & 0.046614 & 0.3928 & 0.347832 \tabularnewline
41 & -0.096363 & -0.812 & 0.209761 \tabularnewline
42 & -0.041497 & -0.3497 & 0.363814 \tabularnewline
43 & 0.018591 & 0.1567 & 0.437982 \tabularnewline
44 & 0.023783 & 0.2004 & 0.420869 \tabularnewline
45 & -0.00429 & -0.0362 & 0.485631 \tabularnewline
46 & 0.031796 & 0.2679 & 0.394769 \tabularnewline
47 & 0.069862 & 0.5887 & 0.278977 \tabularnewline
48 & 0.013433 & 0.1132 & 0.4551 \tabularnewline
49 & 0.034069 & 0.2871 & 0.387447 \tabularnewline
50 & -0.005536 & -0.0466 & 0.481464 \tabularnewline
51 & 0.085477 & 0.7202 & 0.236869 \tabularnewline
52 & -0.0701 & -0.5907 & 0.278307 \tabularnewline
53 & -0.091052 & -0.7672 & 0.222747 \tabularnewline
54 & 0.055181 & 0.465 & 0.321689 \tabularnewline
55 & 0.009095 & 0.0766 & 0.469563 \tabularnewline
56 & -0.017102 & -0.1441 & 0.442915 \tabularnewline
57 & 0.040399 & 0.3404 & 0.367276 \tabularnewline
58 & -0.098515 & -0.8301 & 0.204631 \tabularnewline
59 & 0.078317 & 0.6599 & 0.255723 \tabularnewline
60 & -0.039485 & -0.3327 & 0.370169 \tabularnewline
\hline
\end{tabular}
%Source: https://freestatistics.org/blog/index.php?pk=116411&T=2

[TABLE]
[ROW][C]Partial Autocorrelation Function[/C][/ROW]
[ROW][C]Time lag k[/C][C]PACF(k)[/C][C]T-STAT[/C][C]P-value[/C][/ROW]
[ROW][C]1[/C][C]-0.422295[/C][C]-3.5583[/C][C]0.000335[/C][/ROW]
[ROW][C]2[/C][C]-0.013827[/C][C]-0.1165[/C][C]0.453791[/C][/ROW]
[ROW][C]3[/C][C]-0.161188[/C][C]-1.3582[/C][C]0.089351[/C][/ROW]
[ROW][C]4[/C][C]-0.211714[/C][C]-1.7839[/C][C]0.039354[/C][/ROW]
[ROW][C]5[/C][C]-0.14869[/C][C]-1.2529[/C][C]0.107179[/C][/ROW]
[ROW][C]6[/C][C]-0.019046[/C][C]-0.1605[/C][C]0.436477[/C][/ROW]
[ROW][C]7[/C][C]-0.144249[/C][C]-1.2155[/C][C]0.114108[/C][/ROW]
[ROW][C]8[/C][C]-0.066302[/C][C]-0.5587[/C][C]0.289073[/C][/ROW]
[ROW][C]9[/C][C]0.33026[/C][C]2.7828[/C][C]0.00345[/C][/ROW]
[ROW][C]10[/C][C]0.166789[/C][C]1.4054[/C][C]0.082133[/C][/ROW]
[ROW][C]11[/C][C]-0.096396[/C][C]-0.8122[/C][C]0.209683[/C][/ROW]
[ROW][C]12[/C][C]-0.243318[/C][C]-2.0502[/C][C]0.022018[/C][/ROW]
[ROW][C]13[/C][C]-0.307614[/C][C]-2.592[/C][C]0.005788[/C][/ROW]
[ROW][C]14[/C][C]-0.205825[/C][C]-1.7343[/C][C]0.043602[/C][/ROW]
[ROW][C]15[/C][C]-0.032102[/C][C]-0.2705[/C][C]0.393781[/C][/ROW]
[ROW][C]16[/C][C]-0.04668[/C][C]-0.3933[/C][C]0.347628[/C][/ROW]
[ROW][C]17[/C][C]-0.108058[/C][C]-0.9105[/C][C]0.182816[/C][/ROW]
[ROW][C]18[/C][C]0.000711[/C][C]0.006[/C][C]0.497617[/C][/ROW]
[ROW][C]19[/C][C]-0.061193[/C][C]-0.5156[/C][C]0.30386[/C][/ROW]
[ROW][C]20[/C][C]-0.094571[/C][C]-0.7969[/C][C]0.214092[/C][/ROW]
[ROW][C]21[/C][C]0.270317[/C][C]2.2777[/C][C]0.012878[/C][/ROW]
[ROW][C]22[/C][C]-0.043803[/C][C]-0.3691[/C][C]0.356578[/C][/ROW]
[ROW][C]23[/C][C]0.106362[/C][C]0.8962[/C][C]0.186581[/C][/ROW]
[ROW][C]24[/C][C]-0.085876[/C][C]-0.7236[/C][C]0.235843[/C][/ROW]
[ROW][C]25[/C][C]-0.100337[/C][C]-0.8455[/C][C]0.20035[/C][/ROW]
[ROW][C]26[/C][C]-0.044454[/C][C]-0.3746[/C][C]0.354547[/C][/ROW]
[ROW][C]27[/C][C]0.161214[/C][C]1.3584[/C][C]0.089317[/C][/ROW]
[ROW][C]28[/C][C]-0.092586[/C][C]-0.7801[/C][C]0.21895[/C][/ROW]
[ROW][C]29[/C][C]0.062206[/C][C]0.5242[/C][C]0.300901[/C][/ROW]
[ROW][C]30[/C][C]0.017033[/C][C]0.1435[/C][C]0.443141[/C][/ROW]
[ROW][C]31[/C][C]-0.021664[/C][C]-0.1825[/C][C]0.427838[/C][/ROW]
[ROW][C]32[/C][C]-0.026696[/C][C]-0.2249[/C][C]0.411335[/C][/ROW]
[ROW][C]33[/C][C]-0.067683[/C][C]-0.5703[/C][C]0.285136[/C][/ROW]
[ROW][C]34[/C][C]0.006826[/C][C]0.0575[/C][C]0.477147[/C][/ROW]
[ROW][C]35[/C][C]0.083894[/C][C]0.7069[/C][C]0.240971[/C][/ROW]
[ROW][C]36[/C][C]-0.056814[/C][C]-0.4787[/C][C]0.316804[/C][/ROW]
[ROW][C]37[/C][C]-0.011542[/C][C]-0.0973[/C][C]0.461398[/C][/ROW]
[ROW][C]38[/C][C]-0.106237[/C][C]-0.8952[/C][C]0.186862[/C][/ROW]
[ROW][C]39[/C][C]0.005715[/C][C]0.0482[/C][C]0.480863[/C][/ROW]
[ROW][C]40[/C][C]0.046614[/C][C]0.3928[/C][C]0.347832[/C][/ROW]
[ROW][C]41[/C][C]-0.096363[/C][C]-0.812[/C][C]0.209761[/C][/ROW]
[ROW][C]42[/C][C]-0.041497[/C][C]-0.3497[/C][C]0.363814[/C][/ROW]
[ROW][C]43[/C][C]0.018591[/C][C]0.1567[/C][C]0.437982[/C][/ROW]
[ROW][C]44[/C][C]0.023783[/C][C]0.2004[/C][C]0.420869[/C][/ROW]
[ROW][C]45[/C][C]-0.00429[/C][C]-0.0362[/C][C]0.485631[/C][/ROW]
[ROW][C]46[/C][C]0.031796[/C][C]0.2679[/C][C]0.394769[/C][/ROW]
[ROW][C]47[/C][C]0.069862[/C][C]0.5887[/C][C]0.278977[/C][/ROW]
[ROW][C]48[/C][C]0.013433[/C][C]0.1132[/C][C]0.4551[/C][/ROW]
[ROW][C]49[/C][C]0.034069[/C][C]0.2871[/C][C]0.387447[/C][/ROW]
[ROW][C]50[/C][C]-0.005536[/C][C]-0.0466[/C][C]0.481464[/C][/ROW]
[ROW][C]51[/C][C]0.085477[/C][C]0.7202[/C][C]0.236869[/C][/ROW]
[ROW][C]52[/C][C]-0.0701[/C][C]-0.5907[/C][C]0.278307[/C][/ROW]
[ROW][C]53[/C][C]-0.091052[/C][C]-0.7672[/C][C]0.222747[/C][/ROW]
[ROW][C]54[/C][C]0.055181[/C][C]0.465[/C][C]0.321689[/C][/ROW]
[ROW][C]55[/C][C]0.009095[/C][C]0.0766[/C][C]0.469563[/C][/ROW]
[ROW][C]56[/C][C]-0.017102[/C][C]-0.1441[/C][C]0.442915[/C][/ROW]
[ROW][C]57[/C][C]0.040399[/C][C]0.3404[/C][C]0.367276[/C][/ROW]
[ROW][C]58[/C][C]-0.098515[/C][C]-0.8301[/C][C]0.204631[/C][/ROW]
[ROW][C]59[/C][C]0.078317[/C][C]0.6599[/C][C]0.255723[/C][/ROW]
[ROW][C]60[/C][C]-0.039485[/C][C]-0.3327[/C][C]0.370169[/C][/ROW]
[/TABLE]
Source: https://freestatistics.org/blog/index.php?pk=116411&T=2

Globally Unique Identifier (entire table): ba.freestatistics.org/blog/index.php?pk=116411&T=2

As an alternative you can also use a QR Code:  

The GUIDs for individual cells are displayed in the table below:

Partial Autocorrelation Function
Time lag kPACF(k)T-STATP-value
1-0.422295-3.55830.000335
2-0.013827-0.11650.453791
3-0.161188-1.35820.089351
4-0.211714-1.78390.039354
5-0.14869-1.25290.107179
6-0.019046-0.16050.436477
7-0.144249-1.21550.114108
8-0.066302-0.55870.289073
90.330262.78280.00345
100.1667891.40540.082133
11-0.096396-0.81220.209683
12-0.243318-2.05020.022018
13-0.307614-2.5920.005788
14-0.205825-1.73430.043602
15-0.032102-0.27050.393781
16-0.04668-0.39330.347628
17-0.108058-0.91050.182816
180.0007110.0060.497617
19-0.061193-0.51560.30386
20-0.094571-0.79690.214092
210.2703172.27770.012878
22-0.043803-0.36910.356578
230.1063620.89620.186581
24-0.085876-0.72360.235843
25-0.100337-0.84550.20035
26-0.044454-0.37460.354547
270.1612141.35840.089317
28-0.092586-0.78010.21895
290.0622060.52420.300901
300.0170330.14350.443141
31-0.021664-0.18250.427838
32-0.026696-0.22490.411335
33-0.067683-0.57030.285136
340.0068260.05750.477147
350.0838940.70690.240971
36-0.056814-0.47870.316804
37-0.011542-0.09730.461398
38-0.106237-0.89520.186862
390.0057150.04820.480863
400.0466140.39280.347832
41-0.096363-0.8120.209761
42-0.041497-0.34970.363814
430.0185910.15670.437982
440.0237830.20040.420869
45-0.00429-0.03620.485631
460.0317960.26790.394769
470.0698620.58870.278977
480.0134330.11320.4551
490.0340690.28710.387447
50-0.005536-0.04660.481464
510.0854770.72020.236869
52-0.0701-0.59070.278307
53-0.091052-0.76720.222747
540.0551810.4650.321689
550.0090950.07660.469563
56-0.017102-0.14410.442915
570.0403990.34040.367276
58-0.098515-0.83010.204631
590.0783170.65990.255723
60-0.039485-0.33270.370169


Parameters (Session):
par1 = 60 ; par2 = 1 ; par3 = 1 ; par4 = 1 ; par5 = 12 ; par6 = White Noise ; par7 = 0.95 ;
Parameters (R input):
par1 = 60 ; par2 = 1 ; par3 = 1 ; par4 = 1 ; par5 = 12 ; par6 = White Noise ; par7 = 0.95 ; par8 = ;
R code (references can be found in the software module):
if (par1 == 'Default') {
par1 = 10*log10(length(x))
} else {
par1 <- as.numeric(par1)
}
par2 <- as.numeric(par2)
par3 <- as.numeric(par3)
par4 <- as.numeric(par4)
par5 <- as.numeric(par5)
if (par6 == 'White Noise') par6 <- 'white' else par6 <- 'ma'
par7 <- as.numeric(par7)
if (par2 == 0) {
x <- log(x)
} else {
x <- (x ^ par2 - 1) / par2
}
if (par3 > 0) x <- diff(x,lag=1,difference=par3)
if (par4 > 0) x <- diff(x,lag=par5,difference=par4)
bitmap(file='pic1.png')
racf <- acf(x, par1, main='Autocorrelation', xlab='time lag', ylab='ACF', ci.type=par6, ci=par7, sub=paste('(lambda=',par2,', d=',par3,', D=',par4,', CI=', par7, ', CI type=',par6,')',sep=''))
dev.off()
bitmap(file='pic2.png')
rpacf <- pacf(x,par1,main='Partial Autocorrelation',xlab='lags',ylab='PACF')
dev.off()
(myacf <- c(racf$acf))
(mypacf <- c(rpacf$acf))
lengthx <- length(x)
sqrtn <- sqrt(lengthx)
load(file='createtable')
a<-table.start()
a<-table.row.start(a)
a<-table.element(a,'Autocorrelation Function',4,TRUE)
a<-table.row.end(a)
a<-table.row.start(a)
a<-table.element(a,'Time lag k',header=TRUE)
a<-table.element(a,hyperlink('basics.htm','ACF(k)','click here for more information about the Autocorrelation Function'),header=TRUE)
a<-table.element(a,'T-STAT',header=TRUE)
a<-table.element(a,'P-value',header=TRUE)
a<-table.row.end(a)
for (i in 2:(par1+1)) {
a<-table.row.start(a)
a<-table.element(a,i-1,header=TRUE)
a<-table.element(a,round(myacf[i],6))
mytstat <- myacf[i]*sqrtn
a<-table.element(a,round(mytstat,4))
a<-table.element(a,round(1-pt(abs(mytstat),lengthx),6))
a<-table.row.end(a)
}
a<-table.end(a)
table.save(a,file='mytable.tab')
a<-table.start()
a<-table.row.start(a)
a<-table.element(a,'Partial Autocorrelation Function',4,TRUE)
a<-table.row.end(a)
a<-table.row.start(a)
a<-table.element(a,'Time lag k',header=TRUE)
a<-table.element(a,hyperlink('basics.htm','PACF(k)','click here for more information about the Partial Autocorrelation Function'),header=TRUE)
a<-table.element(a,'T-STAT',header=TRUE)
a<-table.element(a,'P-value',header=TRUE)
a<-table.row.end(a)
for (i in 1:par1) {
a<-table.row.start(a)
a<-table.element(a,i,header=TRUE)
a<-table.element(a,round(mypacf[i],6))
mytstat <- mypacf[i]*sqrtn
a<-table.element(a,round(mytstat,4))
a<-table.element(a,round(1-pt(abs(mytstat),lengthx),6))
a<-table.row.end(a)
}
a<-table.end(a)
table.save(a,file='mytable1.tab')