Free Statistics

of Irreproducible Research!

Author's title

Author*The author of this computation has been verified*
R Software Modulerwasp_autocorrelation.wasp
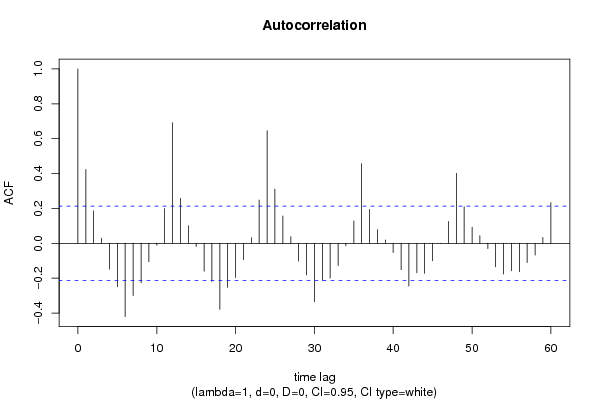
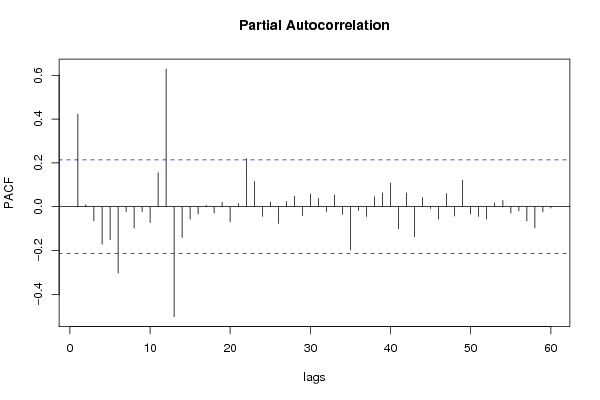
Title produced by software(Partial) Autocorrelation Function
Date of computationTue, 28 Dec 2010 16:27:45 +0000
Cite this page as followsStatistical Computations at FreeStatistics.org, Office for Research Development and Education, URL https://freestatistics.org/blog/index.php?v=date/2010/Dec/28/t1293553554dg9lvv3bp52lvze.htm/, Retrieved Sat, 04 May 2024 22:43:55 +0000
Statistical Computations at FreeStatistics.org, Office for Research Development and Education, URL https://freestatistics.org/blog/index.php?pk=116406, Retrieved Sat, 04 May 2024 22:43:55 +0000
QR Codes:

Original text written by user:
IsPrivate?No (this computation is public)
User-defined keywords
Estimated Impact135
Family? (F = Feedback message, R = changed R code, M = changed R Module, P = changed Parameters, D = changed Data)
-     [(Partial) Autocorrelation Function] [Partial autocorre...] [2008-12-09 20:18:51] [12d343c4448a5f9e527bb31caeac580b]
-   P   [(Partial) Autocorrelation Function] [Partial autocorre...] [2008-12-09 20:27:26] [12d343c4448a5f9e527bb31caeac580b]
- RMPD    [(Partial) Autocorrelation Function] [Autocorrelatie bi...] [2009-12-21 14:51:48] [9dbb467a28ad600d808a4e47d5e0774e]
-             [(Partial) Autocorrelation Function] [paper] [2010-12-28 16:27:45] [a4671b53c9c003ef222bf9d29c2203ca] [Current]
Feedback Forum

Post a new message
Dataseries X:
36845
35338
35022
34777
26887
23970
22780
17351
21382
24561
17409
11514
31514
27071
29462
26105
22397
23843
21705
18089
20764
25316
17704
15548
28029
29383
36438
32034
22679
24319
18004
17537
20366
22782
19169
13807
29743
25591
29096
26482
22405
27044
17970
18730
19684
19785
18479
10698
31956
29506
34506
27165
26736
23691
18157
17328
18205
20995
17382
9367
31124
26551
30651
25859
25100
25778
20418
18688
20424
24776
19814
12738
31566
30111
30019
31934
25826
26835
20205
17789
20520
22518
15572
11509


Summary of computational transaction
Raw Inputview raw input (R code)
Raw Outputview raw output of R engine
Computing time3 seconds
R Server'Sir Ronald Aylmer Fisher' @ 193.190.124.24

\begin{tabular}{lllllllll}
\hline
Summary of computational transaction \tabularnewline
Raw Input & view raw input (R code)  \tabularnewline
Raw Output & view raw output of R engine  \tabularnewline
Computing time & 3 seconds \tabularnewline
R Server & 'Sir Ronald Aylmer Fisher' @ 193.190.124.24 \tabularnewline
\hline
\end{tabular}
%Source: https://freestatistics.org/blog/index.php?pk=116406&T=0

[TABLE]
[ROW][C]Summary of computational transaction[/C][/ROW]
[ROW][C]Raw Input[/C][C]view raw input (R code) [/C][/ROW]
[ROW][C]Raw Output[/C][C]view raw output of R engine [/C][/ROW]
[ROW][C]Computing time[/C][C]3 seconds[/C][/ROW]
[ROW][C]R Server[/C][C]'Sir Ronald Aylmer Fisher' @ 193.190.124.24[/C][/ROW]
[/TABLE]
Source: https://freestatistics.org/blog/index.php?pk=116406&T=0

Globally Unique Identifier (entire table): ba.freestatistics.org/blog/index.php?pk=116406&T=0

As an alternative you can also use a QR Code:  

The GUIDs for individual cells are displayed in the table below:

Summary of computational transaction
Raw Inputview raw input (R code)
Raw Outputview raw output of R engine
Computing time3 seconds
R Server'Sir Ronald Aylmer Fisher' @ 193.190.124.24


Autocorrelation Function
Time lag kACF(k)T-STATP-value
10.4226433.87360.000106
20.1861041.70570.045882
30.0289770.26560.395607
4-0.148175-1.3580.089042
5-0.249563-2.28730.012347
6-0.420709-3.85590.000113
7-0.299591-2.74580.003691
8-0.226668-2.07740.020407
9-0.105669-0.96850.167795
10-0.011111-0.10180.459564
110.1998831.8320.035251
120.6911886.33480
130.258042.3650.010168
140.1008570.92440.178971
15-0.018164-0.16650.43409
16-0.159858-1.46510.07331
17-0.217675-1.9950.024641
18-0.379268-3.47610.000404
19-0.25358-2.32410.011268
20-0.196299-1.79910.037796
21-0.0948-0.86890.1937
220.0322610.29570.384102
230.2486932.27930.012592
240.6456965.91790
250.3099632.84090.002822
260.1566891.43610.077347
270.0383510.35150.363049
28-0.100801-0.92390.179104
29-0.182431-1.6720.049122
30-0.334843-3.06890.001446
31-0.212701-1.94940.02729
32-0.199262-1.82630.035681
33-0.127997-1.17310.122034
34-0.014709-0.13480.446542
350.1279061.17230.122201
360.4565574.18443.5e-05
370.1940671.77870.039457
380.0786850.72120.236406
390.0193790.17760.429728
40-0.05252-0.48140.315757
41-0.151239-1.38610.084688
42-0.244691-2.24260.013777
43-0.169082-1.54970.062492
44-0.172337-1.57950.058991
45-0.100612-0.92210.179553
46-0.000142-0.00130.499483
470.1257181.15220.126249
480.4012273.67730.000207
490.2095151.92020.029111
500.092070.84380.20058
510.0432830.39670.346298
52-0.029916-0.27420.392306
53-0.134238-1.23030.111008
54-0.175712-1.61040.055528
55-0.157899-1.44720.075785
56-0.163326-1.49690.069082
57-0.110531-1.0130.156976
58-0.067526-0.61890.268834
590.0339750.31140.37814
600.233262.13790.017717

\begin{tabular}{lllllllll}
\hline
Autocorrelation Function \tabularnewline
Time lag k & ACF(k) & T-STAT & P-value \tabularnewline
1 & 0.422643 & 3.8736 & 0.000106 \tabularnewline
2 & 0.186104 & 1.7057 & 0.045882 \tabularnewline
3 & 0.028977 & 0.2656 & 0.395607 \tabularnewline
4 & -0.148175 & -1.358 & 0.089042 \tabularnewline
5 & -0.249563 & -2.2873 & 0.012347 \tabularnewline
6 & -0.420709 & -3.8559 & 0.000113 \tabularnewline
7 & -0.299591 & -2.7458 & 0.003691 \tabularnewline
8 & -0.226668 & -2.0774 & 0.020407 \tabularnewline
9 & -0.105669 & -0.9685 & 0.167795 \tabularnewline
10 & -0.011111 & -0.1018 & 0.459564 \tabularnewline
11 & 0.199883 & 1.832 & 0.035251 \tabularnewline
12 & 0.691188 & 6.3348 & 0 \tabularnewline
13 & 0.25804 & 2.365 & 0.010168 \tabularnewline
14 & 0.100857 & 0.9244 & 0.178971 \tabularnewline
15 & -0.018164 & -0.1665 & 0.43409 \tabularnewline
16 & -0.159858 & -1.4651 & 0.07331 \tabularnewline
17 & -0.217675 & -1.995 & 0.024641 \tabularnewline
18 & -0.379268 & -3.4761 & 0.000404 \tabularnewline
19 & -0.25358 & -2.3241 & 0.011268 \tabularnewline
20 & -0.196299 & -1.7991 & 0.037796 \tabularnewline
21 & -0.0948 & -0.8689 & 0.1937 \tabularnewline
22 & 0.032261 & 0.2957 & 0.384102 \tabularnewline
23 & 0.248693 & 2.2793 & 0.012592 \tabularnewline
24 & 0.645696 & 5.9179 & 0 \tabularnewline
25 & 0.309963 & 2.8409 & 0.002822 \tabularnewline
26 & 0.156689 & 1.4361 & 0.077347 \tabularnewline
27 & 0.038351 & 0.3515 & 0.363049 \tabularnewline
28 & -0.100801 & -0.9239 & 0.179104 \tabularnewline
29 & -0.182431 & -1.672 & 0.049122 \tabularnewline
30 & -0.334843 & -3.0689 & 0.001446 \tabularnewline
31 & -0.212701 & -1.9494 & 0.02729 \tabularnewline
32 & -0.199262 & -1.8263 & 0.035681 \tabularnewline
33 & -0.127997 & -1.1731 & 0.122034 \tabularnewline
34 & -0.014709 & -0.1348 & 0.446542 \tabularnewline
35 & 0.127906 & 1.1723 & 0.122201 \tabularnewline
36 & 0.456557 & 4.1844 & 3.5e-05 \tabularnewline
37 & 0.194067 & 1.7787 & 0.039457 \tabularnewline
38 & 0.078685 & 0.7212 & 0.236406 \tabularnewline
39 & 0.019379 & 0.1776 & 0.429728 \tabularnewline
40 & -0.05252 & -0.4814 & 0.315757 \tabularnewline
41 & -0.151239 & -1.3861 & 0.084688 \tabularnewline
42 & -0.244691 & -2.2426 & 0.013777 \tabularnewline
43 & -0.169082 & -1.5497 & 0.062492 \tabularnewline
44 & -0.172337 & -1.5795 & 0.058991 \tabularnewline
45 & -0.100612 & -0.9221 & 0.179553 \tabularnewline
46 & -0.000142 & -0.0013 & 0.499483 \tabularnewline
47 & 0.125718 & 1.1522 & 0.126249 \tabularnewline
48 & 0.401227 & 3.6773 & 0.000207 \tabularnewline
49 & 0.209515 & 1.9202 & 0.029111 \tabularnewline
50 & 0.09207 & 0.8438 & 0.20058 \tabularnewline
51 & 0.043283 & 0.3967 & 0.346298 \tabularnewline
52 & -0.029916 & -0.2742 & 0.392306 \tabularnewline
53 & -0.134238 & -1.2303 & 0.111008 \tabularnewline
54 & -0.175712 & -1.6104 & 0.055528 \tabularnewline
55 & -0.157899 & -1.4472 & 0.075785 \tabularnewline
56 & -0.163326 & -1.4969 & 0.069082 \tabularnewline
57 & -0.110531 & -1.013 & 0.156976 \tabularnewline
58 & -0.067526 & -0.6189 & 0.268834 \tabularnewline
59 & 0.033975 & 0.3114 & 0.37814 \tabularnewline
60 & 0.23326 & 2.1379 & 0.017717 \tabularnewline
\hline
\end{tabular}
%Source: https://freestatistics.org/blog/index.php?pk=116406&T=1

[TABLE]
[ROW][C]Autocorrelation Function[/C][/ROW]
[ROW][C]Time lag k[/C][C]ACF(k)[/C][C]T-STAT[/C][C]P-value[/C][/ROW]
[ROW][C]1[/C][C]0.422643[/C][C]3.8736[/C][C]0.000106[/C][/ROW]
[ROW][C]2[/C][C]0.186104[/C][C]1.7057[/C][C]0.045882[/C][/ROW]
[ROW][C]3[/C][C]0.028977[/C][C]0.2656[/C][C]0.395607[/C][/ROW]
[ROW][C]4[/C][C]-0.148175[/C][C]-1.358[/C][C]0.089042[/C][/ROW]
[ROW][C]5[/C][C]-0.249563[/C][C]-2.2873[/C][C]0.012347[/C][/ROW]
[ROW][C]6[/C][C]-0.420709[/C][C]-3.8559[/C][C]0.000113[/C][/ROW]
[ROW][C]7[/C][C]-0.299591[/C][C]-2.7458[/C][C]0.003691[/C][/ROW]
[ROW][C]8[/C][C]-0.226668[/C][C]-2.0774[/C][C]0.020407[/C][/ROW]
[ROW][C]9[/C][C]-0.105669[/C][C]-0.9685[/C][C]0.167795[/C][/ROW]
[ROW][C]10[/C][C]-0.011111[/C][C]-0.1018[/C][C]0.459564[/C][/ROW]
[ROW][C]11[/C][C]0.199883[/C][C]1.832[/C][C]0.035251[/C][/ROW]
[ROW][C]12[/C][C]0.691188[/C][C]6.3348[/C][C]0[/C][/ROW]
[ROW][C]13[/C][C]0.25804[/C][C]2.365[/C][C]0.010168[/C][/ROW]
[ROW][C]14[/C][C]0.100857[/C][C]0.9244[/C][C]0.178971[/C][/ROW]
[ROW][C]15[/C][C]-0.018164[/C][C]-0.1665[/C][C]0.43409[/C][/ROW]
[ROW][C]16[/C][C]-0.159858[/C][C]-1.4651[/C][C]0.07331[/C][/ROW]
[ROW][C]17[/C][C]-0.217675[/C][C]-1.995[/C][C]0.024641[/C][/ROW]
[ROW][C]18[/C][C]-0.379268[/C][C]-3.4761[/C][C]0.000404[/C][/ROW]
[ROW][C]19[/C][C]-0.25358[/C][C]-2.3241[/C][C]0.011268[/C][/ROW]
[ROW][C]20[/C][C]-0.196299[/C][C]-1.7991[/C][C]0.037796[/C][/ROW]
[ROW][C]21[/C][C]-0.0948[/C][C]-0.8689[/C][C]0.1937[/C][/ROW]
[ROW][C]22[/C][C]0.032261[/C][C]0.2957[/C][C]0.384102[/C][/ROW]
[ROW][C]23[/C][C]0.248693[/C][C]2.2793[/C][C]0.012592[/C][/ROW]
[ROW][C]24[/C][C]0.645696[/C][C]5.9179[/C][C]0[/C][/ROW]
[ROW][C]25[/C][C]0.309963[/C][C]2.8409[/C][C]0.002822[/C][/ROW]
[ROW][C]26[/C][C]0.156689[/C][C]1.4361[/C][C]0.077347[/C][/ROW]
[ROW][C]27[/C][C]0.038351[/C][C]0.3515[/C][C]0.363049[/C][/ROW]
[ROW][C]28[/C][C]-0.100801[/C][C]-0.9239[/C][C]0.179104[/C][/ROW]
[ROW][C]29[/C][C]-0.182431[/C][C]-1.672[/C][C]0.049122[/C][/ROW]
[ROW][C]30[/C][C]-0.334843[/C][C]-3.0689[/C][C]0.001446[/C][/ROW]
[ROW][C]31[/C][C]-0.212701[/C][C]-1.9494[/C][C]0.02729[/C][/ROW]
[ROW][C]32[/C][C]-0.199262[/C][C]-1.8263[/C][C]0.035681[/C][/ROW]
[ROW][C]33[/C][C]-0.127997[/C][C]-1.1731[/C][C]0.122034[/C][/ROW]
[ROW][C]34[/C][C]-0.014709[/C][C]-0.1348[/C][C]0.446542[/C][/ROW]
[ROW][C]35[/C][C]0.127906[/C][C]1.1723[/C][C]0.122201[/C][/ROW]
[ROW][C]36[/C][C]0.456557[/C][C]4.1844[/C][C]3.5e-05[/C][/ROW]
[ROW][C]37[/C][C]0.194067[/C][C]1.7787[/C][C]0.039457[/C][/ROW]
[ROW][C]38[/C][C]0.078685[/C][C]0.7212[/C][C]0.236406[/C][/ROW]
[ROW][C]39[/C][C]0.019379[/C][C]0.1776[/C][C]0.429728[/C][/ROW]
[ROW][C]40[/C][C]-0.05252[/C][C]-0.4814[/C][C]0.315757[/C][/ROW]
[ROW][C]41[/C][C]-0.151239[/C][C]-1.3861[/C][C]0.084688[/C][/ROW]
[ROW][C]42[/C][C]-0.244691[/C][C]-2.2426[/C][C]0.013777[/C][/ROW]
[ROW][C]43[/C][C]-0.169082[/C][C]-1.5497[/C][C]0.062492[/C][/ROW]
[ROW][C]44[/C][C]-0.172337[/C][C]-1.5795[/C][C]0.058991[/C][/ROW]
[ROW][C]45[/C][C]-0.100612[/C][C]-0.9221[/C][C]0.179553[/C][/ROW]
[ROW][C]46[/C][C]-0.000142[/C][C]-0.0013[/C][C]0.499483[/C][/ROW]
[ROW][C]47[/C][C]0.125718[/C][C]1.1522[/C][C]0.126249[/C][/ROW]
[ROW][C]48[/C][C]0.401227[/C][C]3.6773[/C][C]0.000207[/C][/ROW]
[ROW][C]49[/C][C]0.209515[/C][C]1.9202[/C][C]0.029111[/C][/ROW]
[ROW][C]50[/C][C]0.09207[/C][C]0.8438[/C][C]0.20058[/C][/ROW]
[ROW][C]51[/C][C]0.043283[/C][C]0.3967[/C][C]0.346298[/C][/ROW]
[ROW][C]52[/C][C]-0.029916[/C][C]-0.2742[/C][C]0.392306[/C][/ROW]
[ROW][C]53[/C][C]-0.134238[/C][C]-1.2303[/C][C]0.111008[/C][/ROW]
[ROW][C]54[/C][C]-0.175712[/C][C]-1.6104[/C][C]0.055528[/C][/ROW]
[ROW][C]55[/C][C]-0.157899[/C][C]-1.4472[/C][C]0.075785[/C][/ROW]
[ROW][C]56[/C][C]-0.163326[/C][C]-1.4969[/C][C]0.069082[/C][/ROW]
[ROW][C]57[/C][C]-0.110531[/C][C]-1.013[/C][C]0.156976[/C][/ROW]
[ROW][C]58[/C][C]-0.067526[/C][C]-0.6189[/C][C]0.268834[/C][/ROW]
[ROW][C]59[/C][C]0.033975[/C][C]0.3114[/C][C]0.37814[/C][/ROW]
[ROW][C]60[/C][C]0.23326[/C][C]2.1379[/C][C]0.017717[/C][/ROW]
[/TABLE]
Source: https://freestatistics.org/blog/index.php?pk=116406&T=1

Globally Unique Identifier (entire table): ba.freestatistics.org/blog/index.php?pk=116406&T=1

As an alternative you can also use a QR Code:  

The GUIDs for individual cells are displayed in the table below:

Autocorrelation Function
Time lag kACF(k)T-STATP-value
10.4226433.87360.000106
20.1861041.70570.045882
30.0289770.26560.395607
4-0.148175-1.3580.089042
5-0.249563-2.28730.012347
6-0.420709-3.85590.000113
7-0.299591-2.74580.003691
8-0.226668-2.07740.020407
9-0.105669-0.96850.167795
10-0.011111-0.10180.459564
110.1998831.8320.035251
120.6911886.33480
130.258042.3650.010168
140.1008570.92440.178971
15-0.018164-0.16650.43409
16-0.159858-1.46510.07331
17-0.217675-1.9950.024641
18-0.379268-3.47610.000404
19-0.25358-2.32410.011268
20-0.196299-1.79910.037796
21-0.0948-0.86890.1937
220.0322610.29570.384102
230.2486932.27930.012592
240.6456965.91790
250.3099632.84090.002822
260.1566891.43610.077347
270.0383510.35150.363049
28-0.100801-0.92390.179104
29-0.182431-1.6720.049122
30-0.334843-3.06890.001446
31-0.212701-1.94940.02729
32-0.199262-1.82630.035681
33-0.127997-1.17310.122034
34-0.014709-0.13480.446542
350.1279061.17230.122201
360.4565574.18443.5e-05
370.1940671.77870.039457
380.0786850.72120.236406
390.0193790.17760.429728
40-0.05252-0.48140.315757
41-0.151239-1.38610.084688
42-0.244691-2.24260.013777
43-0.169082-1.54970.062492
44-0.172337-1.57950.058991
45-0.100612-0.92210.179553
46-0.000142-0.00130.499483
470.1257181.15220.126249
480.4012273.67730.000207
490.2095151.92020.029111
500.092070.84380.20058
510.0432830.39670.346298
52-0.029916-0.27420.392306
53-0.134238-1.23030.111008
54-0.175712-1.61040.055528
55-0.157899-1.44720.075785
56-0.163326-1.49690.069082
57-0.110531-1.0130.156976
58-0.067526-0.61890.268834
590.0339750.31140.37814
600.233262.13790.017717


Partial Autocorrelation Function
Time lag kPACF(k)T-STATP-value
10.4226433.87360.000106
20.0091030.08340.466854
3-0.0643-0.58930.278614
4-0.170994-1.56720.060416
5-0.150358-1.3780.085924
6-0.303134-2.77830.00337
7-0.021699-0.19890.421422
8-0.097656-0.8950.186665
9-0.021679-0.19870.421493
10-0.072403-0.66360.254387
110.1548221.4190.079804
120.6288655.76360
13-0.501897-4.67e-06
14-0.140117-1.28420.101302
15-0.056906-0.52160.301678
16-0.033574-0.30770.379532
170.005350.0490.480504
18-0.028498-0.26120.397293
190.0202310.18540.426674
20-0.068536-0.62810.265807
210.014390.13190.447695
220.2193612.01050.023795
230.1155331.05890.146345
24-0.043515-0.39880.34552
250.0216790.19870.421494
26-0.07616-0.6980.243547
270.0235990.21630.414644
280.0482810.44250.329631
29-0.040374-0.370.356146
300.0580580.53210.298029
310.0379860.34810.364301
32-0.022132-0.20280.419875
330.0533760.48920.312988
34-0.034968-0.32050.374696
35-0.197579-1.81080.03687
36-0.016831-0.15430.438888
37-0.045191-0.41420.339897
380.0456760.41860.33828
390.0630550.57790.282436
400.1077990.9880.162997
41-0.100235-0.91870.18045
420.0624240.57210.284383
43-0.136803-1.25380.106693
440.0409970.37570.354027
45-0.00804-0.07370.470718
46-0.055924-0.51250.304806
470.0599410.54940.292104
48-0.042391-0.38850.349306
490.1209371.10840.135426
50-0.033157-0.30390.380982
51-0.044193-0.4050.34324
52-0.05555-0.50910.306001
530.016440.15070.440296
540.0284620.26090.397422
55-0.029077-0.26650.395255
56-0.018184-0.16670.43402
57-0.06375-0.58430.280299
58-0.096656-0.88590.189109
59-0.023806-0.21820.413905
60-0.005953-0.05460.47831

\begin{tabular}{lllllllll}
\hline
Partial Autocorrelation Function \tabularnewline
Time lag k & PACF(k) & T-STAT & P-value \tabularnewline
1 & 0.422643 & 3.8736 & 0.000106 \tabularnewline
2 & 0.009103 & 0.0834 & 0.466854 \tabularnewline
3 & -0.0643 & -0.5893 & 0.278614 \tabularnewline
4 & -0.170994 & -1.5672 & 0.060416 \tabularnewline
5 & -0.150358 & -1.378 & 0.085924 \tabularnewline
6 & -0.303134 & -2.7783 & 0.00337 \tabularnewline
7 & -0.021699 & -0.1989 & 0.421422 \tabularnewline
8 & -0.097656 & -0.895 & 0.186665 \tabularnewline
9 & -0.021679 & -0.1987 & 0.421493 \tabularnewline
10 & -0.072403 & -0.6636 & 0.254387 \tabularnewline
11 & 0.154822 & 1.419 & 0.079804 \tabularnewline
12 & 0.628865 & 5.7636 & 0 \tabularnewline
13 & -0.501897 & -4.6 & 7e-06 \tabularnewline
14 & -0.140117 & -1.2842 & 0.101302 \tabularnewline
15 & -0.056906 & -0.5216 & 0.301678 \tabularnewline
16 & -0.033574 & -0.3077 & 0.379532 \tabularnewline
17 & 0.00535 & 0.049 & 0.480504 \tabularnewline
18 & -0.028498 & -0.2612 & 0.397293 \tabularnewline
19 & 0.020231 & 0.1854 & 0.426674 \tabularnewline
20 & -0.068536 & -0.6281 & 0.265807 \tabularnewline
21 & 0.01439 & 0.1319 & 0.447695 \tabularnewline
22 & 0.219361 & 2.0105 & 0.023795 \tabularnewline
23 & 0.115533 & 1.0589 & 0.146345 \tabularnewline
24 & -0.043515 & -0.3988 & 0.34552 \tabularnewline
25 & 0.021679 & 0.1987 & 0.421494 \tabularnewline
26 & -0.07616 & -0.698 & 0.243547 \tabularnewline
27 & 0.023599 & 0.2163 & 0.414644 \tabularnewline
28 & 0.048281 & 0.4425 & 0.329631 \tabularnewline
29 & -0.040374 & -0.37 & 0.356146 \tabularnewline
30 & 0.058058 & 0.5321 & 0.298029 \tabularnewline
31 & 0.037986 & 0.3481 & 0.364301 \tabularnewline
32 & -0.022132 & -0.2028 & 0.419875 \tabularnewline
33 & 0.053376 & 0.4892 & 0.312988 \tabularnewline
34 & -0.034968 & -0.3205 & 0.374696 \tabularnewline
35 & -0.197579 & -1.8108 & 0.03687 \tabularnewline
36 & -0.016831 & -0.1543 & 0.438888 \tabularnewline
37 & -0.045191 & -0.4142 & 0.339897 \tabularnewline
38 & 0.045676 & 0.4186 & 0.33828 \tabularnewline
39 & 0.063055 & 0.5779 & 0.282436 \tabularnewline
40 & 0.107799 & 0.988 & 0.162997 \tabularnewline
41 & -0.100235 & -0.9187 & 0.18045 \tabularnewline
42 & 0.062424 & 0.5721 & 0.284383 \tabularnewline
43 & -0.136803 & -1.2538 & 0.106693 \tabularnewline
44 & 0.040997 & 0.3757 & 0.354027 \tabularnewline
45 & -0.00804 & -0.0737 & 0.470718 \tabularnewline
46 & -0.055924 & -0.5125 & 0.304806 \tabularnewline
47 & 0.059941 & 0.5494 & 0.292104 \tabularnewline
48 & -0.042391 & -0.3885 & 0.349306 \tabularnewline
49 & 0.120937 & 1.1084 & 0.135426 \tabularnewline
50 & -0.033157 & -0.3039 & 0.380982 \tabularnewline
51 & -0.044193 & -0.405 & 0.34324 \tabularnewline
52 & -0.05555 & -0.5091 & 0.306001 \tabularnewline
53 & 0.01644 & 0.1507 & 0.440296 \tabularnewline
54 & 0.028462 & 0.2609 & 0.397422 \tabularnewline
55 & -0.029077 & -0.2665 & 0.395255 \tabularnewline
56 & -0.018184 & -0.1667 & 0.43402 \tabularnewline
57 & -0.06375 & -0.5843 & 0.280299 \tabularnewline
58 & -0.096656 & -0.8859 & 0.189109 \tabularnewline
59 & -0.023806 & -0.2182 & 0.413905 \tabularnewline
60 & -0.005953 & -0.0546 & 0.47831 \tabularnewline
\hline
\end{tabular}
%Source: https://freestatistics.org/blog/index.php?pk=116406&T=2

[TABLE]
[ROW][C]Partial Autocorrelation Function[/C][/ROW]
[ROW][C]Time lag k[/C][C]PACF(k)[/C][C]T-STAT[/C][C]P-value[/C][/ROW]
[ROW][C]1[/C][C]0.422643[/C][C]3.8736[/C][C]0.000106[/C][/ROW]
[ROW][C]2[/C][C]0.009103[/C][C]0.0834[/C][C]0.466854[/C][/ROW]
[ROW][C]3[/C][C]-0.0643[/C][C]-0.5893[/C][C]0.278614[/C][/ROW]
[ROW][C]4[/C][C]-0.170994[/C][C]-1.5672[/C][C]0.060416[/C][/ROW]
[ROW][C]5[/C][C]-0.150358[/C][C]-1.378[/C][C]0.085924[/C][/ROW]
[ROW][C]6[/C][C]-0.303134[/C][C]-2.7783[/C][C]0.00337[/C][/ROW]
[ROW][C]7[/C][C]-0.021699[/C][C]-0.1989[/C][C]0.421422[/C][/ROW]
[ROW][C]8[/C][C]-0.097656[/C][C]-0.895[/C][C]0.186665[/C][/ROW]
[ROW][C]9[/C][C]-0.021679[/C][C]-0.1987[/C][C]0.421493[/C][/ROW]
[ROW][C]10[/C][C]-0.072403[/C][C]-0.6636[/C][C]0.254387[/C][/ROW]
[ROW][C]11[/C][C]0.154822[/C][C]1.419[/C][C]0.079804[/C][/ROW]
[ROW][C]12[/C][C]0.628865[/C][C]5.7636[/C][C]0[/C][/ROW]
[ROW][C]13[/C][C]-0.501897[/C][C]-4.6[/C][C]7e-06[/C][/ROW]
[ROW][C]14[/C][C]-0.140117[/C][C]-1.2842[/C][C]0.101302[/C][/ROW]
[ROW][C]15[/C][C]-0.056906[/C][C]-0.5216[/C][C]0.301678[/C][/ROW]
[ROW][C]16[/C][C]-0.033574[/C][C]-0.3077[/C][C]0.379532[/C][/ROW]
[ROW][C]17[/C][C]0.00535[/C][C]0.049[/C][C]0.480504[/C][/ROW]
[ROW][C]18[/C][C]-0.028498[/C][C]-0.2612[/C][C]0.397293[/C][/ROW]
[ROW][C]19[/C][C]0.020231[/C][C]0.1854[/C][C]0.426674[/C][/ROW]
[ROW][C]20[/C][C]-0.068536[/C][C]-0.6281[/C][C]0.265807[/C][/ROW]
[ROW][C]21[/C][C]0.01439[/C][C]0.1319[/C][C]0.447695[/C][/ROW]
[ROW][C]22[/C][C]0.219361[/C][C]2.0105[/C][C]0.023795[/C][/ROW]
[ROW][C]23[/C][C]0.115533[/C][C]1.0589[/C][C]0.146345[/C][/ROW]
[ROW][C]24[/C][C]-0.043515[/C][C]-0.3988[/C][C]0.34552[/C][/ROW]
[ROW][C]25[/C][C]0.021679[/C][C]0.1987[/C][C]0.421494[/C][/ROW]
[ROW][C]26[/C][C]-0.07616[/C][C]-0.698[/C][C]0.243547[/C][/ROW]
[ROW][C]27[/C][C]0.023599[/C][C]0.2163[/C][C]0.414644[/C][/ROW]
[ROW][C]28[/C][C]0.048281[/C][C]0.4425[/C][C]0.329631[/C][/ROW]
[ROW][C]29[/C][C]-0.040374[/C][C]-0.37[/C][C]0.356146[/C][/ROW]
[ROW][C]30[/C][C]0.058058[/C][C]0.5321[/C][C]0.298029[/C][/ROW]
[ROW][C]31[/C][C]0.037986[/C][C]0.3481[/C][C]0.364301[/C][/ROW]
[ROW][C]32[/C][C]-0.022132[/C][C]-0.2028[/C][C]0.419875[/C][/ROW]
[ROW][C]33[/C][C]0.053376[/C][C]0.4892[/C][C]0.312988[/C][/ROW]
[ROW][C]34[/C][C]-0.034968[/C][C]-0.3205[/C][C]0.374696[/C][/ROW]
[ROW][C]35[/C][C]-0.197579[/C][C]-1.8108[/C][C]0.03687[/C][/ROW]
[ROW][C]36[/C][C]-0.016831[/C][C]-0.1543[/C][C]0.438888[/C][/ROW]
[ROW][C]37[/C][C]-0.045191[/C][C]-0.4142[/C][C]0.339897[/C][/ROW]
[ROW][C]38[/C][C]0.045676[/C][C]0.4186[/C][C]0.33828[/C][/ROW]
[ROW][C]39[/C][C]0.063055[/C][C]0.5779[/C][C]0.282436[/C][/ROW]
[ROW][C]40[/C][C]0.107799[/C][C]0.988[/C][C]0.162997[/C][/ROW]
[ROW][C]41[/C][C]-0.100235[/C][C]-0.9187[/C][C]0.18045[/C][/ROW]
[ROW][C]42[/C][C]0.062424[/C][C]0.5721[/C][C]0.284383[/C][/ROW]
[ROW][C]43[/C][C]-0.136803[/C][C]-1.2538[/C][C]0.106693[/C][/ROW]
[ROW][C]44[/C][C]0.040997[/C][C]0.3757[/C][C]0.354027[/C][/ROW]
[ROW][C]45[/C][C]-0.00804[/C][C]-0.0737[/C][C]0.470718[/C][/ROW]
[ROW][C]46[/C][C]-0.055924[/C][C]-0.5125[/C][C]0.304806[/C][/ROW]
[ROW][C]47[/C][C]0.059941[/C][C]0.5494[/C][C]0.292104[/C][/ROW]
[ROW][C]48[/C][C]-0.042391[/C][C]-0.3885[/C][C]0.349306[/C][/ROW]
[ROW][C]49[/C][C]0.120937[/C][C]1.1084[/C][C]0.135426[/C][/ROW]
[ROW][C]50[/C][C]-0.033157[/C][C]-0.3039[/C][C]0.380982[/C][/ROW]
[ROW][C]51[/C][C]-0.044193[/C][C]-0.405[/C][C]0.34324[/C][/ROW]
[ROW][C]52[/C][C]-0.05555[/C][C]-0.5091[/C][C]0.306001[/C][/ROW]
[ROW][C]53[/C][C]0.01644[/C][C]0.1507[/C][C]0.440296[/C][/ROW]
[ROW][C]54[/C][C]0.028462[/C][C]0.2609[/C][C]0.397422[/C][/ROW]
[ROW][C]55[/C][C]-0.029077[/C][C]-0.2665[/C][C]0.395255[/C][/ROW]
[ROW][C]56[/C][C]-0.018184[/C][C]-0.1667[/C][C]0.43402[/C][/ROW]
[ROW][C]57[/C][C]-0.06375[/C][C]-0.5843[/C][C]0.280299[/C][/ROW]
[ROW][C]58[/C][C]-0.096656[/C][C]-0.8859[/C][C]0.189109[/C][/ROW]
[ROW][C]59[/C][C]-0.023806[/C][C]-0.2182[/C][C]0.413905[/C][/ROW]
[ROW][C]60[/C][C]-0.005953[/C][C]-0.0546[/C][C]0.47831[/C][/ROW]
[/TABLE]
Source: https://freestatistics.org/blog/index.php?pk=116406&T=2

Globally Unique Identifier (entire table): ba.freestatistics.org/blog/index.php?pk=116406&T=2

As an alternative you can also use a QR Code:  

The GUIDs for individual cells are displayed in the table below:

Partial Autocorrelation Function
Time lag kPACF(k)T-STATP-value
10.4226433.87360.000106
20.0091030.08340.466854
3-0.0643-0.58930.278614
4-0.170994-1.56720.060416
5-0.150358-1.3780.085924
6-0.303134-2.77830.00337
7-0.021699-0.19890.421422
8-0.097656-0.8950.186665
9-0.021679-0.19870.421493
10-0.072403-0.66360.254387
110.1548221.4190.079804
120.6288655.76360
13-0.501897-4.67e-06
14-0.140117-1.28420.101302
15-0.056906-0.52160.301678
16-0.033574-0.30770.379532
170.005350.0490.480504
18-0.028498-0.26120.397293
190.0202310.18540.426674
20-0.068536-0.62810.265807
210.014390.13190.447695
220.2193612.01050.023795
230.1155331.05890.146345
24-0.043515-0.39880.34552
250.0216790.19870.421494
26-0.07616-0.6980.243547
270.0235990.21630.414644
280.0482810.44250.329631
29-0.040374-0.370.356146
300.0580580.53210.298029
310.0379860.34810.364301
32-0.022132-0.20280.419875
330.0533760.48920.312988
34-0.034968-0.32050.374696
35-0.197579-1.81080.03687
36-0.016831-0.15430.438888
37-0.045191-0.41420.339897
380.0456760.41860.33828
390.0630550.57790.282436
400.1077990.9880.162997
41-0.100235-0.91870.18045
420.0624240.57210.284383
43-0.136803-1.25380.106693
440.0409970.37570.354027
45-0.00804-0.07370.470718
46-0.055924-0.51250.304806
470.0599410.54940.292104
48-0.042391-0.38850.349306
490.1209371.10840.135426
50-0.033157-0.30390.380982
51-0.044193-0.4050.34324
52-0.05555-0.50910.306001
530.016440.15070.440296
540.0284620.26090.397422
55-0.029077-0.26650.395255
56-0.018184-0.16670.43402
57-0.06375-0.58430.280299
58-0.096656-0.88590.189109
59-0.023806-0.21820.413905
60-0.005953-0.05460.47831


Parameters (Session):
par1 = 60 ; par2 = 1 ; par3 = 0 ; par4 = 0 ; par5 = 12 ; par6 = White Noise ; par7 = 0.95 ;
Parameters (R input):
par1 = 60 ; par2 = 1 ; par3 = 0 ; par4 = 0 ; par5 = 12 ; par6 = White Noise ; par7 = 0.95 ; par8 = ;
R code (references can be found in the software module):
if (par1 == 'Default') {
par1 = 10*log10(length(x))
} else {
par1 <- as.numeric(par1)
}
par2 <- as.numeric(par2)
par3 <- as.numeric(par3)
par4 <- as.numeric(par4)
par5 <- as.numeric(par5)
if (par6 == 'White Noise') par6 <- 'white' else par6 <- 'ma'
par7 <- as.numeric(par7)
if (par2 == 0) {
x <- log(x)
} else {
x <- (x ^ par2 - 1) / par2
}
if (par3 > 0) x <- diff(x,lag=1,difference=par3)
if (par4 > 0) x <- diff(x,lag=par5,difference=par4)
bitmap(file='pic1.png')
racf <- acf(x, par1, main='Autocorrelation', xlab='time lag', ylab='ACF', ci.type=par6, ci=par7, sub=paste('(lambda=',par2,', d=',par3,', D=',par4,', CI=', par7, ', CI type=',par6,')',sep=''))
dev.off()
bitmap(file='pic2.png')
rpacf <- pacf(x,par1,main='Partial Autocorrelation',xlab='lags',ylab='PACF')
dev.off()
(myacf <- c(racf$acf))
(mypacf <- c(rpacf$acf))
lengthx <- length(x)
sqrtn <- sqrt(lengthx)
load(file='createtable')
a<-table.start()
a<-table.row.start(a)
a<-table.element(a,'Autocorrelation Function',4,TRUE)
a<-table.row.end(a)
a<-table.row.start(a)
a<-table.element(a,'Time lag k',header=TRUE)
a<-table.element(a,hyperlink('basics.htm','ACF(k)','click here for more information about the Autocorrelation Function'),header=TRUE)
a<-table.element(a,'T-STAT',header=TRUE)
a<-table.element(a,'P-value',header=TRUE)
a<-table.row.end(a)
for (i in 2:(par1+1)) {
a<-table.row.start(a)
a<-table.element(a,i-1,header=TRUE)
a<-table.element(a,round(myacf[i],6))
mytstat <- myacf[i]*sqrtn
a<-table.element(a,round(mytstat,4))
a<-table.element(a,round(1-pt(abs(mytstat),lengthx),6))
a<-table.row.end(a)
}
a<-table.end(a)
table.save(a,file='mytable.tab')
a<-table.start()
a<-table.row.start(a)
a<-table.element(a,'Partial Autocorrelation Function',4,TRUE)
a<-table.row.end(a)
a<-table.row.start(a)
a<-table.element(a,'Time lag k',header=TRUE)
a<-table.element(a,hyperlink('basics.htm','PACF(k)','click here for more information about the Partial Autocorrelation Function'),header=TRUE)
a<-table.element(a,'T-STAT',header=TRUE)
a<-table.element(a,'P-value',header=TRUE)
a<-table.row.end(a)
for (i in 1:par1) {
a<-table.row.start(a)
a<-table.element(a,i,header=TRUE)
a<-table.element(a,round(mypacf[i],6))
mytstat <- mypacf[i]*sqrtn
a<-table.element(a,round(mytstat,4))
a<-table.element(a,round(1-pt(abs(mytstat),lengthx),6))
a<-table.row.end(a)
}
a<-table.end(a)
table.save(a,file='mytable1.tab')