Free Statistics

of Irreproducible Research!

Author's title

Author*The author of this computation has been verified*
R Software Modulerwasp_arimabackwardselection.wasp
Title produced by softwareARIMA Backward Selection
Date of computationTue, 28 Dec 2010 16:09:56 +0000
Cite this page as followsStatistical Computations at FreeStatistics.org, Office for Research Development and Education, URL https://freestatistics.org/blog/index.php?v=date/2010/Dec/28/t1293552542hwr0i922cz7qn7k.htm/, Retrieved Sat, 04 May 2024 23:28:14 +0000
Statistical Computations at FreeStatistics.org, Office for Research Development and Education, URL https://freestatistics.org/blog/index.php?pk=116397, Retrieved Sat, 04 May 2024 23:28:14 +0000
QR Codes:

Original text written by user:
IsPrivate?No (this computation is public)
User-defined keywordsARIMA Backward Selection - Handelsbalans België (1995-2009)
Estimated Impact143
Family? (F = Feedback message, R = changed R code, M = changed R Module, P = changed Parameters, D = changed Data)
-     [Standard Deviation-Mean Plot] [SMP prof bach] [2008-12-15 22:25:20] [bc937651ef42bf891200cf0e0edc7238]
- RM    [Variance Reduction Matrix] [VRM prof bach] [2008-12-15 22:31:00] [bc937651ef42bf891200cf0e0edc7238]
- RMP     [(Partial) Autocorrelation Function] [ARIMA Prof bach A...] [2008-12-15 22:38:57] [bc937651ef42bf891200cf0e0edc7238]
- RMP       [ARIMA Backward Selection] [Arima backward se...] [2008-12-19 17:26:16] [bc937651ef42bf891200cf0e0edc7238]
-  MP           [ARIMA Backward Selection] [Paper Statistiek] [2010-12-28 16:09:56] [f6fdc0236f011c1845380977efc505f8] [Current]
Feedback Forum

Post a new message
Dataseries X:
13363
12530
11420
10948
10173
10602
16094
19631
17140
14345
12632
12894
11808
10673
9939
9890
9283
10131
15864
19283
16203
13919
11937
11795
11268
10522
9929
9725
9372
10068
16230
19115
18351
16265
14103
14115
13327
12618
12129
11775
11493
12470
20792
22337
21325
18581
16475
16581
15745
14453
13712
13766
13336
15346
24446
26178
24628
21282
18850
18822
18060
17536
16417
15842
15188
16905
25430
27962
26607
23364
20827
20506
19181
18016
17354
16256
15770
17538
26899
28915
25247
22856
19980
19856
16994
16839
15618
15883
15513
17106
25272
26731
22891
19583
16939
16757
15435
14786
13680
13208
12707
14277
22436
23229
18241
16145
13994
14780
13100
12329
12463
11532
10784
13106
19491
20418
16094
14491
13067


Summary of computational transaction
Raw Inputview raw input (R code)
Raw Outputview raw output of R engine
Computing time6 seconds
R Server'Gwilym Jenkins' @ 72.249.127.135

\begin{tabular}{lllllllll}
\hline
Summary of computational transaction \tabularnewline
Raw Input & view raw input (R code)  \tabularnewline
Raw Output & view raw output of R engine  \tabularnewline
Computing time & 6 seconds \tabularnewline
R Server & 'Gwilym Jenkins' @ 72.249.127.135 \tabularnewline
\hline
\end{tabular}
%Source: https://freestatistics.org/blog/index.php?pk=116397&T=0

[TABLE]
[ROW][C]Summary of computational transaction[/C][/ROW]
[ROW][C]Raw Input[/C][C]view raw input (R code) [/C][/ROW]
[ROW][C]Raw Output[/C][C]view raw output of R engine [/C][/ROW]
[ROW][C]Computing time[/C][C]6 seconds[/C][/ROW]
[ROW][C]R Server[/C][C]'Gwilym Jenkins' @ 72.249.127.135[/C][/ROW]
[/TABLE]
Source: https://freestatistics.org/blog/index.php?pk=116397&T=0

Globally Unique Identifier (entire table): ba.freestatistics.org/blog/index.php?pk=116397&T=0

As an alternative you can also use a QR Code:  

The GUIDs for individual cells are displayed in the table below:

Summary of computational transaction
Raw Inputview raw input (R code)
Raw Outputview raw output of R engine
Computing time6 seconds
R Server'Gwilym Jenkins' @ 72.249.127.135


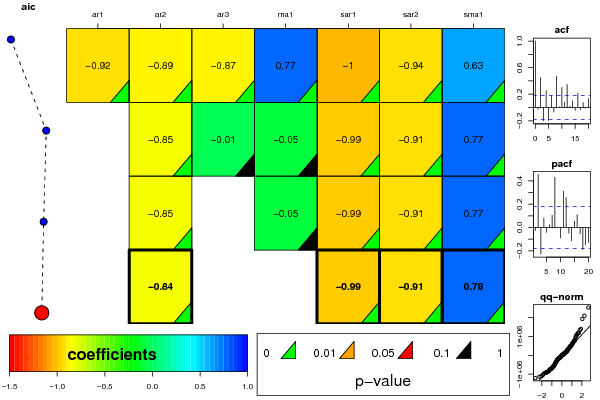
ARIMA Parameter Estimation and Backward Selection
Iterationar1ar2ar3ma1sar1sar2sma1
Estimates ( 1 )-0.9222-0.8893-0.87290.768-1.0026-0.94220.6316
(p-val)(0 )(0 )(0 )(0 )(0 )(0 )(0 )
Estimates ( 2 )0-0.8452-0.0119-0.0505-0.9903-0.91360.7703
(p-val)(NA )(0 )(0.8168 )(0.478 )(0 )(0 )(0 )
Estimates ( 3 )0-0.84530-0.0543-0.9902-0.91390.7696
(p-val)(NA )(0 )(NA )(0.4325 )(0 )(0 )(0 )
Estimates ( 4 )0-0.842300-0.9877-0.90820.7782
(p-val)(NA )(0 )(NA )(NA )(0 )(0 )(0 )
Estimates ( 5 )NANANANANANANA
(p-val)(NA )(NA )(NA )(NA )(NA )(NA )(NA )
Estimates ( 6 )NANANANANANANA
(p-val)(NA )(NA )(NA )(NA )(NA )(NA )(NA )
Estimates ( 7 )NANANANANANANA
(p-val)(NA )(NA )(NA )(NA )(NA )(NA )(NA )
Estimates ( 8 )NANANANANANANA
(p-val)(NA )(NA )(NA )(NA )(NA )(NA )(NA )
Estimates ( 9 )NANANANANANANA
(p-val)(NA )(NA )(NA )(NA )(NA )(NA )(NA )
Estimates ( 10 )NANANANANANANA
(p-val)(NA )(NA )(NA )(NA )(NA )(NA )(NA )
Estimates ( 11 )NANANANANANANA
(p-val)(NA )(NA )(NA )(NA )(NA )(NA )(NA )
Estimates ( 12 )NANANANANANANA
(p-val)(NA )(NA )(NA )(NA )(NA )(NA )(NA )
Estimates ( 13 )NANANANANANANA
(p-val)(NA )(NA )(NA )(NA )(NA )(NA )(NA )

\begin{tabular}{lllllllll}
\hline
ARIMA Parameter Estimation and Backward Selection \tabularnewline
Iteration & ar1 & ar2 & ar3 & ma1 & sar1 & sar2 & sma1 \tabularnewline
Estimates ( 1 ) & -0.9222 & -0.8893 & -0.8729 & 0.768 & -1.0026 & -0.9422 & 0.6316 \tabularnewline
(p-val) & (0 ) & (0 ) & (0 ) & (0 ) & (0 ) & (0 ) & (0 ) \tabularnewline
Estimates ( 2 ) & 0 & -0.8452 & -0.0119 & -0.0505 & -0.9903 & -0.9136 & 0.7703 \tabularnewline
(p-val) & (NA ) & (0 ) & (0.8168 ) & (0.478 ) & (0 ) & (0 ) & (0 ) \tabularnewline
Estimates ( 3 ) & 0 & -0.8453 & 0 & -0.0543 & -0.9902 & -0.9139 & 0.7696 \tabularnewline
(p-val) & (NA ) & (0 ) & (NA ) & (0.4325 ) & (0 ) & (0 ) & (0 ) \tabularnewline
Estimates ( 4 ) & 0 & -0.8423 & 0 & 0 & -0.9877 & -0.9082 & 0.7782 \tabularnewline
(p-val) & (NA ) & (0 ) & (NA ) & (NA ) & (0 ) & (0 ) & (0 ) \tabularnewline
Estimates ( 5 ) & NA & NA & NA & NA & NA & NA & NA \tabularnewline
(p-val) & (NA ) & (NA ) & (NA ) & (NA ) & (NA ) & (NA ) & (NA ) \tabularnewline
Estimates ( 6 ) & NA & NA & NA & NA & NA & NA & NA \tabularnewline
(p-val) & (NA ) & (NA ) & (NA ) & (NA ) & (NA ) & (NA ) & (NA ) \tabularnewline
Estimates ( 7 ) & NA & NA & NA & NA & NA & NA & NA \tabularnewline
(p-val) & (NA ) & (NA ) & (NA ) & (NA ) & (NA ) & (NA ) & (NA ) \tabularnewline
Estimates ( 8 ) & NA & NA & NA & NA & NA & NA & NA \tabularnewline
(p-val) & (NA ) & (NA ) & (NA ) & (NA ) & (NA ) & (NA ) & (NA ) \tabularnewline
Estimates ( 9 ) & NA & NA & NA & NA & NA & NA & NA \tabularnewline
(p-val) & (NA ) & (NA ) & (NA ) & (NA ) & (NA ) & (NA ) & (NA ) \tabularnewline
Estimates ( 10 ) & NA & NA & NA & NA & NA & NA & NA \tabularnewline
(p-val) & (NA ) & (NA ) & (NA ) & (NA ) & (NA ) & (NA ) & (NA ) \tabularnewline
Estimates ( 11 ) & NA & NA & NA & NA & NA & NA & NA \tabularnewline
(p-val) & (NA ) & (NA ) & (NA ) & (NA ) & (NA ) & (NA ) & (NA ) \tabularnewline
Estimates ( 12 ) & NA & NA & NA & NA & NA & NA & NA \tabularnewline
(p-val) & (NA ) & (NA ) & (NA ) & (NA ) & (NA ) & (NA ) & (NA ) \tabularnewline
Estimates ( 13 ) & NA & NA & NA & NA & NA & NA & NA \tabularnewline
(p-val) & (NA ) & (NA ) & (NA ) & (NA ) & (NA ) & (NA ) & (NA ) \tabularnewline
\hline
\end{tabular}
%Source: https://freestatistics.org/blog/index.php?pk=116397&T=1

[TABLE]
[ROW][C]ARIMA Parameter Estimation and Backward Selection[/C][/ROW]
[ROW][C]Iteration[/C][C]ar1[/C][C]ar2[/C][C]ar3[/C][C]ma1[/C][C]sar1[/C][C]sar2[/C][C]sma1[/C][/ROW]
[ROW][C]Estimates ( 1 )[/C][C]-0.9222[/C][C]-0.8893[/C][C]-0.8729[/C][C]0.768[/C][C]-1.0026[/C][C]-0.9422[/C][C]0.6316[/C][/ROW]
[ROW][C](p-val)[/C][C](0 )[/C][C](0 )[/C][C](0 )[/C][C](0 )[/C][C](0 )[/C][C](0 )[/C][C](0 )[/C][/ROW]
[ROW][C]Estimates ( 2 )[/C][C]0[/C][C]-0.8452[/C][C]-0.0119[/C][C]-0.0505[/C][C]-0.9903[/C][C]-0.9136[/C][C]0.7703[/C][/ROW]
[ROW][C](p-val)[/C][C](NA )[/C][C](0 )[/C][C](0.8168 )[/C][C](0.478 )[/C][C](0 )[/C][C](0 )[/C][C](0 )[/C][/ROW]
[ROW][C]Estimates ( 3 )[/C][C]0[/C][C]-0.8453[/C][C]0[/C][C]-0.0543[/C][C]-0.9902[/C][C]-0.9139[/C][C]0.7696[/C][/ROW]
[ROW][C](p-val)[/C][C](NA )[/C][C](0 )[/C][C](NA )[/C][C](0.4325 )[/C][C](0 )[/C][C](0 )[/C][C](0 )[/C][/ROW]
[ROW][C]Estimates ( 4 )[/C][C]0[/C][C]-0.8423[/C][C]0[/C][C]0[/C][C]-0.9877[/C][C]-0.9082[/C][C]0.7782[/C][/ROW]
[ROW][C](p-val)[/C][C](NA )[/C][C](0 )[/C][C](NA )[/C][C](NA )[/C][C](0 )[/C][C](0 )[/C][C](0 )[/C][/ROW]
[ROW][C]Estimates ( 5 )[/C][C]NA[/C][C]NA[/C][C]NA[/C][C]NA[/C][C]NA[/C][C]NA[/C][C]NA[/C][/ROW]
[ROW][C](p-val)[/C][C](NA )[/C][C](NA )[/C][C](NA )[/C][C](NA )[/C][C](NA )[/C][C](NA )[/C][C](NA )[/C][/ROW]
[ROW][C]Estimates ( 6 )[/C][C]NA[/C][C]NA[/C][C]NA[/C][C]NA[/C][C]NA[/C][C]NA[/C][C]NA[/C][/ROW]
[ROW][C](p-val)[/C][C](NA )[/C][C](NA )[/C][C](NA )[/C][C](NA )[/C][C](NA )[/C][C](NA )[/C][C](NA )[/C][/ROW]
[ROW][C]Estimates ( 7 )[/C][C]NA[/C][C]NA[/C][C]NA[/C][C]NA[/C][C]NA[/C][C]NA[/C][C]NA[/C][/ROW]
[ROW][C](p-val)[/C][C](NA )[/C][C](NA )[/C][C](NA )[/C][C](NA )[/C][C](NA )[/C][C](NA )[/C][C](NA )[/C][/ROW]
[ROW][C]Estimates ( 8 )[/C][C]NA[/C][C]NA[/C][C]NA[/C][C]NA[/C][C]NA[/C][C]NA[/C][C]NA[/C][/ROW]
[ROW][C](p-val)[/C][C](NA )[/C][C](NA )[/C][C](NA )[/C][C](NA )[/C][C](NA )[/C][C](NA )[/C][C](NA )[/C][/ROW]
[ROW][C]Estimates ( 9 )[/C][C]NA[/C][C]NA[/C][C]NA[/C][C]NA[/C][C]NA[/C][C]NA[/C][C]NA[/C][/ROW]
[ROW][C](p-val)[/C][C](NA )[/C][C](NA )[/C][C](NA )[/C][C](NA )[/C][C](NA )[/C][C](NA )[/C][C](NA )[/C][/ROW]
[ROW][C]Estimates ( 10 )[/C][C]NA[/C][C]NA[/C][C]NA[/C][C]NA[/C][C]NA[/C][C]NA[/C][C]NA[/C][/ROW]
[ROW][C](p-val)[/C][C](NA )[/C][C](NA )[/C][C](NA )[/C][C](NA )[/C][C](NA )[/C][C](NA )[/C][C](NA )[/C][/ROW]
[ROW][C]Estimates ( 11 )[/C][C]NA[/C][C]NA[/C][C]NA[/C][C]NA[/C][C]NA[/C][C]NA[/C][C]NA[/C][/ROW]
[ROW][C](p-val)[/C][C](NA )[/C][C](NA )[/C][C](NA )[/C][C](NA )[/C][C](NA )[/C][C](NA )[/C][C](NA )[/C][/ROW]
[ROW][C]Estimates ( 12 )[/C][C]NA[/C][C]NA[/C][C]NA[/C][C]NA[/C][C]NA[/C][C]NA[/C][C]NA[/C][/ROW]
[ROW][C](p-val)[/C][C](NA )[/C][C](NA )[/C][C](NA )[/C][C](NA )[/C][C](NA )[/C][C](NA )[/C][C](NA )[/C][/ROW]
[ROW][C]Estimates ( 13 )[/C][C]NA[/C][C]NA[/C][C]NA[/C][C]NA[/C][C]NA[/C][C]NA[/C][C]NA[/C][/ROW]
[ROW][C](p-val)[/C][C](NA )[/C][C](NA )[/C][C](NA )[/C][C](NA )[/C][C](NA )[/C][C](NA )[/C][C](NA )[/C][/ROW]
[/TABLE]
Source: https://freestatistics.org/blog/index.php?pk=116397&T=1

Globally Unique Identifier (entire table): ba.freestatistics.org/blog/index.php?pk=116397&T=1

As an alternative you can also use a QR Code:  

The GUIDs for individual cells are displayed in the table below:

ARIMA Parameter Estimation and Backward Selection
Iterationar1ar2ar3ma1sar1sar2sma1
Estimates ( 1 )-0.9222-0.8893-0.87290.768-1.0026-0.94220.6316
(p-val)(0 )(0 )(0 )(0 )(0 )(0 )(0 )
Estimates ( 2 )0-0.8452-0.0119-0.0505-0.9903-0.91360.7703
(p-val)(NA )(0 )(0.8168 )(0.478 )(0 )(0 )(0 )
Estimates ( 3 )0-0.84530-0.0543-0.9902-0.91390.7696
(p-val)(NA )(0 )(NA )(0.4325 )(0 )(0 )(0 )
Estimates ( 4 )0-0.842300-0.9877-0.90820.7782
(p-val)(NA )(0 )(NA )(NA )(0 )(0 )(0 )
Estimates ( 5 )NANANANANANANA
(p-val)(NA )(NA )(NA )(NA )(NA )(NA )(NA )
Estimates ( 6 )NANANANANANANA
(p-val)(NA )(NA )(NA )(NA )(NA )(NA )(NA )
Estimates ( 7 )NANANANANANANA
(p-val)(NA )(NA )(NA )(NA )(NA )(NA )(NA )
Estimates ( 8 )NANANANANANANA
(p-val)(NA )(NA )(NA )(NA )(NA )(NA )(NA )
Estimates ( 9 )NANANANANANANA
(p-val)(NA )(NA )(NA )(NA )(NA )(NA )(NA )
Estimates ( 10 )NANANANANANANA
(p-val)(NA )(NA )(NA )(NA )(NA )(NA )(NA )
Estimates ( 11 )NANANANANANANA
(p-val)(NA )(NA )(NA )(NA )(NA )(NA )(NA )
Estimates ( 12 )NANANANANANANA
(p-val)(NA )(NA )(NA )(NA )(NA )(NA )(NA )
Estimates ( 13 )NANANANANANANA
(p-val)(NA )(NA )(NA )(NA )(NA )(NA )(NA )


Estimated ARIMA Residuals
Value
3994.33960645376
-156026.677739507
-203655.688937884
-164519.357806146
-227965.016394317
-60492.5306917827
1067176.84637888
1019206.55572076
11956.4361744015
-183986.489882733
-167806.528852016
123326.498714172
-911594.448197265
-122501.002126966
-425806.344506969
296281.162374462
-337858.441810153
153819.88979484
179703.510053426
516147.01466307
-732726.381720797
240778.917720083
-669636.130001004
320012.253343144
-356349.259344542
141486.695245220
-28556.9214395694
353148.223430309
-556551.513072333
103474.334457168
196791.292123624
294175.070486228
1190579.16331394
44139.6326755661
725704.629881903
369961.095605750
-518355.455539228
59384.5749953241
-20543.0070769703
39647.380181377
627424.127242953
141139.091539164
2533482.30328322
130638.256087288
1180567.56759998
-852165.585395445
159100.534844990
-399619.547048739
486053.790206742
-435968.068186157
1396507.53441604
-247752.050728865
546995.940300292
35459.3168150662
1925707.24246206
649010.94334377
1338740.61124873
-665964.716614855
684867.240123247
-715999.587769227
326017.645031143
36517.3568875824
953150.250945275
88073.271118795
443587.806657745
-726825.280230295
1123290.60276338
362728.271564528
815334.359389505
280090.274333219
758549.942162887
-226654.654125261
-99226.2068068231
-1135260.94400324
493982.141170909
-646664.530820415
522603.202304362
-132377.135655287
2098347.37884476
-143766.796214979
-563093.46303453
-589826.240264432
-918626.222093755
-84817.4805676693
-883894.22960092
294009.816216827
-69608.2055147296
770467.909299455
-966726.327559156
185165.555778518
-723383.695659279
-127787.616019429
-1214262.91273119
-627096.759767233
-196921.981562650
2582.6995479337
-82814.845130645
-295976.057479382
-226317.294923320
-764716.80792742
-1113475.67489537
-792245.01588731
46170.3998204871
-465993.232461732
-837638.127470281
-30702.955707484
-378441.930213011
432180.323581405
-878264.229097746
-286495.853485259
71282.6346752365
-589891.228022714
-544805.026943553
152239.924879994
-931866.605691542
593116.969065609
-1035738.06903276
104096.352652099
480757.986712893

\begin{tabular}{lllllllll}
\hline
Estimated ARIMA Residuals \tabularnewline
Value \tabularnewline
3994.33960645376 \tabularnewline
-156026.677739507 \tabularnewline
-203655.688937884 \tabularnewline
-164519.357806146 \tabularnewline
-227965.016394317 \tabularnewline
-60492.5306917827 \tabularnewline
1067176.84637888 \tabularnewline
1019206.55572076 \tabularnewline
11956.4361744015 \tabularnewline
-183986.489882733 \tabularnewline
-167806.528852016 \tabularnewline
123326.498714172 \tabularnewline
-911594.448197265 \tabularnewline
-122501.002126966 \tabularnewline
-425806.344506969 \tabularnewline
296281.162374462 \tabularnewline
-337858.441810153 \tabularnewline
153819.88979484 \tabularnewline
179703.510053426 \tabularnewline
516147.01466307 \tabularnewline
-732726.381720797 \tabularnewline
240778.917720083 \tabularnewline
-669636.130001004 \tabularnewline
320012.253343144 \tabularnewline
-356349.259344542 \tabularnewline
141486.695245220 \tabularnewline
-28556.9214395694 \tabularnewline
353148.223430309 \tabularnewline
-556551.513072333 \tabularnewline
103474.334457168 \tabularnewline
196791.292123624 \tabularnewline
294175.070486228 \tabularnewline
1190579.16331394 \tabularnewline
44139.6326755661 \tabularnewline
725704.629881903 \tabularnewline
369961.095605750 \tabularnewline
-518355.455539228 \tabularnewline
59384.5749953241 \tabularnewline
-20543.0070769703 \tabularnewline
39647.380181377 \tabularnewline
627424.127242953 \tabularnewline
141139.091539164 \tabularnewline
2533482.30328322 \tabularnewline
130638.256087288 \tabularnewline
1180567.56759998 \tabularnewline
-852165.585395445 \tabularnewline
159100.534844990 \tabularnewline
-399619.547048739 \tabularnewline
486053.790206742 \tabularnewline
-435968.068186157 \tabularnewline
1396507.53441604 \tabularnewline
-247752.050728865 \tabularnewline
546995.940300292 \tabularnewline
35459.3168150662 \tabularnewline
1925707.24246206 \tabularnewline
649010.94334377 \tabularnewline
1338740.61124873 \tabularnewline
-665964.716614855 \tabularnewline
684867.240123247 \tabularnewline
-715999.587769227 \tabularnewline
326017.645031143 \tabularnewline
36517.3568875824 \tabularnewline
953150.250945275 \tabularnewline
88073.271118795 \tabularnewline
443587.806657745 \tabularnewline
-726825.280230295 \tabularnewline
1123290.60276338 \tabularnewline
362728.271564528 \tabularnewline
815334.359389505 \tabularnewline
280090.274333219 \tabularnewline
758549.942162887 \tabularnewline
-226654.654125261 \tabularnewline
-99226.2068068231 \tabularnewline
-1135260.94400324 \tabularnewline
493982.141170909 \tabularnewline
-646664.530820415 \tabularnewline
522603.202304362 \tabularnewline
-132377.135655287 \tabularnewline
2098347.37884476 \tabularnewline
-143766.796214979 \tabularnewline
-563093.46303453 \tabularnewline
-589826.240264432 \tabularnewline
-918626.222093755 \tabularnewline
-84817.4805676693 \tabularnewline
-883894.22960092 \tabularnewline
294009.816216827 \tabularnewline
-69608.2055147296 \tabularnewline
770467.909299455 \tabularnewline
-966726.327559156 \tabularnewline
185165.555778518 \tabularnewline
-723383.695659279 \tabularnewline
-127787.616019429 \tabularnewline
-1214262.91273119 \tabularnewline
-627096.759767233 \tabularnewline
-196921.981562650 \tabularnewline
2582.6995479337 \tabularnewline
-82814.845130645 \tabularnewline
-295976.057479382 \tabularnewline
-226317.294923320 \tabularnewline
-764716.80792742 \tabularnewline
-1113475.67489537 \tabularnewline
-792245.01588731 \tabularnewline
46170.3998204871 \tabularnewline
-465993.232461732 \tabularnewline
-837638.127470281 \tabularnewline
-30702.955707484 \tabularnewline
-378441.930213011 \tabularnewline
432180.323581405 \tabularnewline
-878264.229097746 \tabularnewline
-286495.853485259 \tabularnewline
71282.6346752365 \tabularnewline
-589891.228022714 \tabularnewline
-544805.026943553 \tabularnewline
152239.924879994 \tabularnewline
-931866.605691542 \tabularnewline
593116.969065609 \tabularnewline
-1035738.06903276 \tabularnewline
104096.352652099 \tabularnewline
480757.986712893 \tabularnewline
\hline
\end{tabular}
%Source: https://freestatistics.org/blog/index.php?pk=116397&T=2

[TABLE]
[ROW][C]Estimated ARIMA Residuals[/C][/ROW]
[ROW][C]Value[/C][/ROW]
[ROW][C]3994.33960645376[/C][/ROW]
[ROW][C]-156026.677739507[/C][/ROW]
[ROW][C]-203655.688937884[/C][/ROW]
[ROW][C]-164519.357806146[/C][/ROW]
[ROW][C]-227965.016394317[/C][/ROW]
[ROW][C]-60492.5306917827[/C][/ROW]
[ROW][C]1067176.84637888[/C][/ROW]
[ROW][C]1019206.55572076[/C][/ROW]
[ROW][C]11956.4361744015[/C][/ROW]
[ROW][C]-183986.489882733[/C][/ROW]
[ROW][C]-167806.528852016[/C][/ROW]
[ROW][C]123326.498714172[/C][/ROW]
[ROW][C]-911594.448197265[/C][/ROW]
[ROW][C]-122501.002126966[/C][/ROW]
[ROW][C]-425806.344506969[/C][/ROW]
[ROW][C]296281.162374462[/C][/ROW]
[ROW][C]-337858.441810153[/C][/ROW]
[ROW][C]153819.88979484[/C][/ROW]
[ROW][C]179703.510053426[/C][/ROW]
[ROW][C]516147.01466307[/C][/ROW]
[ROW][C]-732726.381720797[/C][/ROW]
[ROW][C]240778.917720083[/C][/ROW]
[ROW][C]-669636.130001004[/C][/ROW]
[ROW][C]320012.253343144[/C][/ROW]
[ROW][C]-356349.259344542[/C][/ROW]
[ROW][C]141486.695245220[/C][/ROW]
[ROW][C]-28556.9214395694[/C][/ROW]
[ROW][C]353148.223430309[/C][/ROW]
[ROW][C]-556551.513072333[/C][/ROW]
[ROW][C]103474.334457168[/C][/ROW]
[ROW][C]196791.292123624[/C][/ROW]
[ROW][C]294175.070486228[/C][/ROW]
[ROW][C]1190579.16331394[/C][/ROW]
[ROW][C]44139.6326755661[/C][/ROW]
[ROW][C]725704.629881903[/C][/ROW]
[ROW][C]369961.095605750[/C][/ROW]
[ROW][C]-518355.455539228[/C][/ROW]
[ROW][C]59384.5749953241[/C][/ROW]
[ROW][C]-20543.0070769703[/C][/ROW]
[ROW][C]39647.380181377[/C][/ROW]
[ROW][C]627424.127242953[/C][/ROW]
[ROW][C]141139.091539164[/C][/ROW]
[ROW][C]2533482.30328322[/C][/ROW]
[ROW][C]130638.256087288[/C][/ROW]
[ROW][C]1180567.56759998[/C][/ROW]
[ROW][C]-852165.585395445[/C][/ROW]
[ROW][C]159100.534844990[/C][/ROW]
[ROW][C]-399619.547048739[/C][/ROW]
[ROW][C]486053.790206742[/C][/ROW]
[ROW][C]-435968.068186157[/C][/ROW]
[ROW][C]1396507.53441604[/C][/ROW]
[ROW][C]-247752.050728865[/C][/ROW]
[ROW][C]546995.940300292[/C][/ROW]
[ROW][C]35459.3168150662[/C][/ROW]
[ROW][C]1925707.24246206[/C][/ROW]
[ROW][C]649010.94334377[/C][/ROW]
[ROW][C]1338740.61124873[/C][/ROW]
[ROW][C]-665964.716614855[/C][/ROW]
[ROW][C]684867.240123247[/C][/ROW]
[ROW][C]-715999.587769227[/C][/ROW]
[ROW][C]326017.645031143[/C][/ROW]
[ROW][C]36517.3568875824[/C][/ROW]
[ROW][C]953150.250945275[/C][/ROW]
[ROW][C]88073.271118795[/C][/ROW]
[ROW][C]443587.806657745[/C][/ROW]
[ROW][C]-726825.280230295[/C][/ROW]
[ROW][C]1123290.60276338[/C][/ROW]
[ROW][C]362728.271564528[/C][/ROW]
[ROW][C]815334.359389505[/C][/ROW]
[ROW][C]280090.274333219[/C][/ROW]
[ROW][C]758549.942162887[/C][/ROW]
[ROW][C]-226654.654125261[/C][/ROW]
[ROW][C]-99226.2068068231[/C][/ROW]
[ROW][C]-1135260.94400324[/C][/ROW]
[ROW][C]493982.141170909[/C][/ROW]
[ROW][C]-646664.530820415[/C][/ROW]
[ROW][C]522603.202304362[/C][/ROW]
[ROW][C]-132377.135655287[/C][/ROW]
[ROW][C]2098347.37884476[/C][/ROW]
[ROW][C]-143766.796214979[/C][/ROW]
[ROW][C]-563093.46303453[/C][/ROW]
[ROW][C]-589826.240264432[/C][/ROW]
[ROW][C]-918626.222093755[/C][/ROW]
[ROW][C]-84817.4805676693[/C][/ROW]
[ROW][C]-883894.22960092[/C][/ROW]
[ROW][C]294009.816216827[/C][/ROW]
[ROW][C]-69608.2055147296[/C][/ROW]
[ROW][C]770467.909299455[/C][/ROW]
[ROW][C]-966726.327559156[/C][/ROW]
[ROW][C]185165.555778518[/C][/ROW]
[ROW][C]-723383.695659279[/C][/ROW]
[ROW][C]-127787.616019429[/C][/ROW]
[ROW][C]-1214262.91273119[/C][/ROW]
[ROW][C]-627096.759767233[/C][/ROW]
[ROW][C]-196921.981562650[/C][/ROW]
[ROW][C]2582.6995479337[/C][/ROW]
[ROW][C]-82814.845130645[/C][/ROW]
[ROW][C]-295976.057479382[/C][/ROW]
[ROW][C]-226317.294923320[/C][/ROW]
[ROW][C]-764716.80792742[/C][/ROW]
[ROW][C]-1113475.67489537[/C][/ROW]
[ROW][C]-792245.01588731[/C][/ROW]
[ROW][C]46170.3998204871[/C][/ROW]
[ROW][C]-465993.232461732[/C][/ROW]
[ROW][C]-837638.127470281[/C][/ROW]
[ROW][C]-30702.955707484[/C][/ROW]
[ROW][C]-378441.930213011[/C][/ROW]
[ROW][C]432180.323581405[/C][/ROW]
[ROW][C]-878264.229097746[/C][/ROW]
[ROW][C]-286495.853485259[/C][/ROW]
[ROW][C]71282.6346752365[/C][/ROW]
[ROW][C]-589891.228022714[/C][/ROW]
[ROW][C]-544805.026943553[/C][/ROW]
[ROW][C]152239.924879994[/C][/ROW]
[ROW][C]-931866.605691542[/C][/ROW]
[ROW][C]593116.969065609[/C][/ROW]
[ROW][C]-1035738.06903276[/C][/ROW]
[ROW][C]104096.352652099[/C][/ROW]
[ROW][C]480757.986712893[/C][/ROW]
[/TABLE]
Source: https://freestatistics.org/blog/index.php?pk=116397&T=2

Globally Unique Identifier (entire table): ba.freestatistics.org/blog/index.php?pk=116397&T=2

As an alternative you can also use a QR Code:  

The GUIDs for individual cells are displayed in the table below:

Estimated ARIMA Residuals
Value
3994.33960645376
-156026.677739507
-203655.688937884
-164519.357806146
-227965.016394317
-60492.5306917827
1067176.84637888
1019206.55572076
11956.4361744015
-183986.489882733
-167806.528852016
123326.498714172
-911594.448197265
-122501.002126966
-425806.344506969
296281.162374462
-337858.441810153
153819.88979484
179703.510053426
516147.01466307
-732726.381720797
240778.917720083
-669636.130001004
320012.253343144
-356349.259344542
141486.695245220
-28556.9214395694
353148.223430309
-556551.513072333
103474.334457168
196791.292123624
294175.070486228
1190579.16331394
44139.6326755661
725704.629881903
369961.095605750
-518355.455539228
59384.5749953241
-20543.0070769703
39647.380181377
627424.127242953
141139.091539164
2533482.30328322
130638.256087288
1180567.56759998
-852165.585395445
159100.534844990
-399619.547048739
486053.790206742
-435968.068186157
1396507.53441604
-247752.050728865
546995.940300292
35459.3168150662
1925707.24246206
649010.94334377
1338740.61124873
-665964.716614855
684867.240123247
-715999.587769227
326017.645031143
36517.3568875824
953150.250945275
88073.271118795
443587.806657745
-726825.280230295
1123290.60276338
362728.271564528
815334.359389505
280090.274333219
758549.942162887
-226654.654125261
-99226.2068068231
-1135260.94400324
493982.141170909
-646664.530820415
522603.202304362
-132377.135655287
2098347.37884476
-143766.796214979
-563093.46303453
-589826.240264432
-918626.222093755
-84817.4805676693
-883894.22960092
294009.816216827
-69608.2055147296
770467.909299455
-966726.327559156
185165.555778518
-723383.695659279
-127787.616019429
-1214262.91273119
-627096.759767233
-196921.981562650
2582.6995479337
-82814.845130645
-295976.057479382
-226317.294923320
-764716.80792742
-1113475.67489537
-792245.01588731
46170.3998204871
-465993.232461732
-837638.127470281
-30702.955707484
-378441.930213011
432180.323581405
-878264.229097746
-286495.853485259
71282.6346752365
-589891.228022714
-544805.026943553
152239.924879994
-931866.605691542
593116.969065609
-1035738.06903276
104096.352652099
480757.986712893


Parameters (Session):
par1 = FALSE ; par2 = 1.6 ; par3 = 1 ; par4 = 0 ; par5 = 4 ; par6 = 3 ; par7 = 1 ; par8 = 2 ; par9 = 1 ;
Parameters (R input):
par1 = FALSE ; par2 = 1.6 ; par3 = 1 ; par4 = 0 ; par5 = 4 ; par6 = 3 ; par7 = 1 ; par8 = 2 ; par9 = 1 ;
R code (references can be found in the software module):
library(lattice)
if (par1 == 'TRUE') par1 <- TRUE
if (par1 == 'FALSE') par1 <- FALSE
par2 <- as.numeric(par2) #Box-Cox lambda transformation parameter
par3 <- as.numeric(par3) #degree of non-seasonal differencing
par4 <- as.numeric(par4) #degree of seasonal differencing
par5 <- as.numeric(par5) #seasonal period
par6 <- as.numeric(par6) #degree (p) of the non-seasonal AR(p) polynomial
par7 <- as.numeric(par7) #degree (q) of the non-seasonal MA(q) polynomial
par8 <- as.numeric(par8) #degree (P) of the seasonal AR(P) polynomial
par9 <- as.numeric(par9) #degree (Q) of the seasonal MA(Q) polynomial
armaGR <- function(arima.out, names, n){
try1 <- arima.out$coef
try2 <- sqrt(diag(arima.out$var.coef))
try.data.frame <- data.frame(matrix(NA,ncol=4,nrow=length(names)))
dimnames(try.data.frame) <- list(names,c('coef','std','tstat','pv'))
try.data.frame[,1] <- try1
for(i in 1:length(try2)) try.data.frame[which(rownames(try.data.frame)==names(try2)[i]),2] <- try2[i]
try.data.frame[,3] <- try.data.frame[,1] / try.data.frame[,2]
try.data.frame[,4] <- round((1-pt(abs(try.data.frame[,3]),df=n-(length(try2)+1)))*2,5)
vector <- rep(NA,length(names))
vector[is.na(try.data.frame[,4])] <- 0
maxi <- which.max(try.data.frame[,4])
continue <- max(try.data.frame[,4],na.rm=TRUE) > .05
vector[maxi] <- 0
list(summary=try.data.frame,next.vector=vector,continue=continue)
}
arimaSelect <- function(series, order=c(13,0,0), seasonal=list(order=c(2,0,0),period=12), include.mean=F){
nrc <- order[1]+order[3]+seasonal$order[1]+seasonal$order[3]
coeff <- matrix(NA, nrow=nrc*2, ncol=nrc)
pval <- matrix(NA, nrow=nrc*2, ncol=nrc)
mylist <- rep(list(NULL), nrc)
names <- NULL
if(order[1] > 0) names <- paste('ar',1:order[1],sep='')
if(order[3] > 0) names <- c( names , paste('ma',1:order[3],sep='') )
if(seasonal$order[1] > 0) names <- c(names, paste('sar',1:seasonal$order[1],sep=''))
if(seasonal$order[3] > 0) names <- c(names, paste('sma',1:seasonal$order[3],sep=''))
arima.out <- arima(series, order=order, seasonal=seasonal, include.mean=include.mean, method='ML')
mylist[[1]] <- arima.out
last.arma <- armaGR(arima.out, names, length(series))
mystop <- FALSE
i <- 1
coeff[i,] <- last.arma[[1]][,1]
pval [i,] <- last.arma[[1]][,4]
i <- 2
aic <- arima.out$aic
while(!mystop){
mylist[[i]] <- arima.out
arima.out <- arima(series, order=order, seasonal=seasonal, include.mean=include.mean, method='ML', fixed=last.arma$next.vector)
aic <- c(aic, arima.out$aic)
last.arma <- armaGR(arima.out, names, length(series))
mystop <- !last.arma$continue
coeff[i,] <- last.arma[[1]][,1]
pval [i,] <- last.arma[[1]][,4]
i <- i+1
}
list(coeff, pval, mylist, aic=aic)
}
arimaSelectplot <- function(arimaSelect.out,noms,choix){
noms <- names(arimaSelect.out[[3]][[1]]$coef)
coeff <- arimaSelect.out[[1]]
k <- min(which(is.na(coeff[,1])))-1
coeff <- coeff[1:k,]
pval <- arimaSelect.out[[2]][1:k,]
aic <- arimaSelect.out$aic[1:k]
coeff[coeff==0] <- NA
n <- ncol(coeff)
if(missing(choix)) choix <- k
layout(matrix(c(1,1,1,2,
3,3,3,2,
3,3,3,4,
5,6,7,7),nr=4),
widths=c(10,35,45,15),
heights=c(30,30,15,15))
couleurs <- rainbow(75)[1:50]#(50)
ticks <- pretty(coeff)
par(mar=c(1,1,3,1))
plot(aic,k:1-.5,type='o',pch=21,bg='blue',cex=2,axes=F,lty=2,xpd=NA)
points(aic[choix],k-choix+.5,pch=21,cex=4,bg=2,xpd=NA)
title('aic',line=2)
par(mar=c(3,0,0,0))
plot(0,axes=F,xlab='',ylab='',xlim=range(ticks),ylim=c(.1,1))
rect(xleft = min(ticks) + (0:49)/50*(max(ticks)-min(ticks)),
xright = min(ticks) + (1:50)/50*(max(ticks)-min(ticks)),
ytop = rep(1,50),
ybottom= rep(0,50),col=couleurs,border=NA)
axis(1,ticks)
rect(xleft=min(ticks),xright=max(ticks),ytop=1,ybottom=0)
text(mean(coeff,na.rm=T),.5,'coefficients',cex=2,font=2)
par(mar=c(1,1,3,1))
image(1:n,1:k,t(coeff[k:1,]),axes=F,col=couleurs,zlim=range(ticks))
for(i in 1:n) for(j in 1:k) if(!is.na(coeff[j,i])) {
if(pval[j,i]<.01) symb = 'green'
else if( (pval[j,i]<.05) & (pval[j,i]>=.01)) symb = 'orange'
else if( (pval[j,i]<.1) & (pval[j,i]>=.05)) symb = 'red'
else symb = 'black'
polygon(c(i+.5 ,i+.2 ,i+.5 ,i+.5),
c(k-j+0.5,k-j+0.5,k-j+0.8,k-j+0.5),
col=symb)
if(j==choix) {
rect(xleft=i-.5,
xright=i+.5,
ybottom=k-j+1.5,
ytop=k-j+.5,
lwd=4)
text(i,
k-j+1,
round(coeff[j,i],2),
cex=1.2,
font=2)
}
else{
rect(xleft=i-.5,xright=i+.5,ybottom=k-j+1.5,ytop=k-j+.5)
text(i,k-j+1,round(coeff[j,i],2),cex=1.2,font=1)
}
}
axis(3,1:n,noms)
par(mar=c(0.5,0,0,0.5))
plot(0,axes=F,xlab='',ylab='',type='n',xlim=c(0,8),ylim=c(-.2,.8))
cols <- c('green','orange','red','black')
niv <- c('0','0.01','0.05','0.1')
for(i in 0:3){
polygon(c(1+2*i ,1+2*i ,1+2*i-.5 ,1+2*i),
c(.4 ,.7 , .4 , .4),
col=cols[i+1])
text(2*i,0.5,niv[i+1],cex=1.5)
}
text(8,.5,1,cex=1.5)
text(4,0,'p-value',cex=2)
box()
residus <- arimaSelect.out[[3]][[choix]]$res
par(mar=c(1,2,4,1))
acf(residus,main='')
title('acf',line=.5)
par(mar=c(1,2,4,1))
pacf(residus,main='')
title('pacf',line=.5)
par(mar=c(2,2,4,1))
qqnorm(residus,main='')
title('qq-norm',line=.5)
qqline(residus)
residus
}
if (par2 == 0) x <- log(x)
if (par2 != 0) x <- x^par2
(selection <- arimaSelect(x, order=c(par6,par3,par7), seasonal=list(order=c(par8,par4,par9), period=par5)))
bitmap(file='test1.png')
resid <- arimaSelectplot(selection)
dev.off()
resid
bitmap(file='test2.png')
acf(resid,length(resid)/2, main='Residual Autocorrelation Function')
dev.off()
bitmap(file='test3.png')
pacf(resid,length(resid)/2, main='Residual Partial Autocorrelation Function')
dev.off()
bitmap(file='test4.png')
cpgram(resid, main='Residual Cumulative Periodogram')
dev.off()
bitmap(file='test5.png')
hist(resid, main='Residual Histogram', xlab='values of Residuals')
dev.off()
bitmap(file='test6.png')
densityplot(~resid,col='black',main='Residual Density Plot', xlab='values of Residuals')
dev.off()
bitmap(file='test7.png')
qqnorm(resid, main='Residual Normal Q-Q Plot')
qqline(resid)
dev.off()
ncols <- length(selection[[1]][1,])
nrows <- length(selection[[2]][,1])-1
load(file='createtable')
a<-table.start()
a<-table.row.start(a)
a<-table.element(a,'ARIMA Parameter Estimation and Backward Selection', ncols+1,TRUE)
a<-table.row.end(a)
a<-table.row.start(a)
a<-table.element(a,'Iteration', header=TRUE)
for (i in 1:ncols) {
a<-table.element(a,names(selection[[3]][[1]]$coef)[i],header=TRUE)
}
a<-table.row.end(a)
for (j in 1:nrows) {
a<-table.row.start(a)
mydum <- 'Estimates ('
mydum <- paste(mydum,j)
mydum <- paste(mydum,')')
a<-table.element(a,mydum, header=TRUE)
for (i in 1:ncols) {
a<-table.element(a,round(selection[[1]][j,i],4))
}
a<-table.row.end(a)
a<-table.row.start(a)
a<-table.element(a,'(p-val)', header=TRUE)
for (i in 1:ncols) {
mydum <- '('
mydum <- paste(mydum,round(selection[[2]][j,i],4),sep='')
mydum <- paste(mydum,')')
a<-table.element(a,mydum)
}
a<-table.row.end(a)
}
a<-table.end(a)
table.save(a,file='mytable.tab')
a<-table.start()
a<-table.row.start(a)
a<-table.element(a,'Estimated ARIMA Residuals', 1,TRUE)
a<-table.row.end(a)
a<-table.row.start(a)
a<-table.element(a,'Value', 1,TRUE)
a<-table.row.end(a)
for (i in (par4*par5+par3):length(resid)) {
a<-table.row.start(a)
a<-table.element(a,resid[i])
a<-table.row.end(a)
}
a<-table.end(a)
table.save(a,file='mytable1.tab')