Free Statistics

of Irreproducible Research!

Author's title

Author*The author of this computation has been verified*
R Software Modulerwasp_arimabackwardselection.wasp
Title produced by softwareARIMA Backward Selection
Date of computationTue, 28 Dec 2010 14:05:39 +0000
Cite this page as followsStatistical Computations at FreeStatistics.org, Office for Research Development and Education, URL https://freestatistics.org/blog/index.php?v=date/2010/Dec/28/t12935450777ll76zhsclvc1c3.htm/, Retrieved Sun, 05 May 2024 07:20:55 +0000
Statistical Computations at FreeStatistics.org, Office for Research Development and Education, URL https://freestatistics.org/blog/index.php?pk=116369, Retrieved Sun, 05 May 2024 07:20:55 +0000
QR Codes:

Original text written by user:
IsPrivate?No (this computation is public)
User-defined keywords
Estimated Impact105
Family? (F = Feedback message, R = changed R code, M = changed R Module, P = changed Parameters, D = changed Data)
-     [Univariate Explorative Data Analysis] [Run Sequence gebo...] [2008-12-12 13:32:37] [76963dc1903f0f612b6153510a3818cf]
- R  D  [Univariate Explorative Data Analysis] [Run Sequence gebo...] [2008-12-17 12:14:40] [76963dc1903f0f612b6153510a3818cf]
-         [Univariate Explorative Data Analysis] [Run Sequence Plot...] [2008-12-22 18:19:51] [1ce0d16c8f4225c977b42c8fa93bc163]
- RMP       [Univariate Data Series] [Identifying Integ...] [2009-11-22 12:08:06] [b98453cac15ba1066b407e146608df68]
- RMP           [ARIMA Backward Selection] [] [2010-12-28 14:05:39] [a35e11780980ebd3eaccb10f050e1b17] [Current]
Feedback Forum

Post a new message
Dataseries X:
9700
9081
9084
9743
8587
9731
9563
9998
9437
10038
9918
9252
9737
9035
9133
9487
8700
9627
8947
9283
8829
9947
9628
9318
9605
8640
9214
9567
8547
9185
9470
9123
9278
10170
9434
9655
9429
8739
9552
9687
9019
9672
9206
9069
9788
10312
10105
9863
9656
9295
9946
9701
9049
10190
9706
9765
9893
9994
10433
10073
10112
9266
9820
10097
9115
10411
9678
10408
10153
10368
10581
10597
10680
9738
9556


Summary of computational transaction
Raw Inputview raw input (R code)
Raw Outputview raw output of R engine
Computing time29 seconds
R Server'George Udny Yule' @ 72.249.76.132

\begin{tabular}{lllllllll}
\hline
Summary of computational transaction \tabularnewline
Raw Input & view raw input (R code)  \tabularnewline
Raw Output & view raw output of R engine  \tabularnewline
Computing time & 29 seconds \tabularnewline
R Server & 'George Udny Yule' @ 72.249.76.132 \tabularnewline
\hline
\end{tabular}
%Source: https://freestatistics.org/blog/index.php?pk=116369&T=0

[TABLE]
[ROW][C]Summary of computational transaction[/C][/ROW]
[ROW][C]Raw Input[/C][C]view raw input (R code) [/C][/ROW]
[ROW][C]Raw Output[/C][C]view raw output of R engine [/C][/ROW]
[ROW][C]Computing time[/C][C]29 seconds[/C][/ROW]
[ROW][C]R Server[/C][C]'George Udny Yule' @ 72.249.76.132[/C][/ROW]
[/TABLE]
Source: https://freestatistics.org/blog/index.php?pk=116369&T=0

Globally Unique Identifier (entire table): ba.freestatistics.org/blog/index.php?pk=116369&T=0

As an alternative you can also use a QR Code:  

The GUIDs for individual cells are displayed in the table below:

Summary of computational transaction
Raw Inputview raw input (R code)
Raw Outputview raw output of R engine
Computing time29 seconds
R Server'George Udny Yule' @ 72.249.76.132


ARIMA Parameter Estimation and Backward Selection
Iterationar1ar2ar3ma1sar1sar2sma1
Estimates ( 1 )0.974-0.07590.1012-0.76630.4738-0.1616-0.9817
(p-val)(0 )(0.7039 )(0.5084 )(0 )(0.0155 )(0.3964 )(0 )
Estimates ( 2 )0.93200.0677-0.76250.4666-0.1372-1.0091
(p-val)(0 )(NA )(0.7246 )(0 )(0.0164 )(0.487 )(0 )
Estimates ( 3 )1.000800-1.25120.4784-0.1438-1
(p-val)(0 )(NA )(NA )(0 )(0.0098 )(0.391 )(0 )
Estimates ( 4 )0.994400-0.8060.50-1.0015
(p-val)(0 )(NA )(NA )(0 )(0.0067 )(NA )(0 )
Estimates ( 5 )NANANANANANANA
(p-val)(NA )(NA )(NA )(NA )(NA )(NA )(NA )
Estimates ( 6 )NANANANANANANA
(p-val)(NA )(NA )(NA )(NA )(NA )(NA )(NA )
Estimates ( 7 )NANANANANANANA
(p-val)(NA )(NA )(NA )(NA )(NA )(NA )(NA )
Estimates ( 8 )NANANANANANANA
(p-val)(NA )(NA )(NA )(NA )(NA )(NA )(NA )
Estimates ( 9 )NANANANANANANA
(p-val)(NA )(NA )(NA )(NA )(NA )(NA )(NA )
Estimates ( 10 )NANANANANANANA
(p-val)(NA )(NA )(NA )(NA )(NA )(NA )(NA )
Estimates ( 11 )NANANANANANANA
(p-val)(NA )(NA )(NA )(NA )(NA )(NA )(NA )
Estimates ( 12 )NANANANANANANA
(p-val)(NA )(NA )(NA )(NA )(NA )(NA )(NA )
Estimates ( 13 )NANANANANANANA
(p-val)(NA )(NA )(NA )(NA )(NA )(NA )(NA )

\begin{tabular}{lllllllll}
\hline
ARIMA Parameter Estimation and Backward Selection \tabularnewline
Iteration & ar1 & ar2 & ar3 & ma1 & sar1 & sar2 & sma1 \tabularnewline
Estimates ( 1 ) & 0.974 & -0.0759 & 0.1012 & -0.7663 & 0.4738 & -0.1616 & -0.9817 \tabularnewline
(p-val) & (0 ) & (0.7039 ) & (0.5084 ) & (0 ) & (0.0155 ) & (0.3964 ) & (0 ) \tabularnewline
Estimates ( 2 ) & 0.932 & 0 & 0.0677 & -0.7625 & 0.4666 & -0.1372 & -1.0091 \tabularnewline
(p-val) & (0 ) & (NA ) & (0.7246 ) & (0 ) & (0.0164 ) & (0.487 ) & (0 ) \tabularnewline
Estimates ( 3 ) & 1.0008 & 0 & 0 & -1.2512 & 0.4784 & -0.1438 & -1 \tabularnewline
(p-val) & (0 ) & (NA ) & (NA ) & (0 ) & (0.0098 ) & (0.391 ) & (0 ) \tabularnewline
Estimates ( 4 ) & 0.9944 & 0 & 0 & -0.806 & 0.5 & 0 & -1.0015 \tabularnewline
(p-val) & (0 ) & (NA ) & (NA ) & (0 ) & (0.0067 ) & (NA ) & (0 ) \tabularnewline
Estimates ( 5 ) & NA & NA & NA & NA & NA & NA & NA \tabularnewline
(p-val) & (NA ) & (NA ) & (NA ) & (NA ) & (NA ) & (NA ) & (NA ) \tabularnewline
Estimates ( 6 ) & NA & NA & NA & NA & NA & NA & NA \tabularnewline
(p-val) & (NA ) & (NA ) & (NA ) & (NA ) & (NA ) & (NA ) & (NA ) \tabularnewline
Estimates ( 7 ) & NA & NA & NA & NA & NA & NA & NA \tabularnewline
(p-val) & (NA ) & (NA ) & (NA ) & (NA ) & (NA ) & (NA ) & (NA ) \tabularnewline
Estimates ( 8 ) & NA & NA & NA & NA & NA & NA & NA \tabularnewline
(p-val) & (NA ) & (NA ) & (NA ) & (NA ) & (NA ) & (NA ) & (NA ) \tabularnewline
Estimates ( 9 ) & NA & NA & NA & NA & NA & NA & NA \tabularnewline
(p-val) & (NA ) & (NA ) & (NA ) & (NA ) & (NA ) & (NA ) & (NA ) \tabularnewline
Estimates ( 10 ) & NA & NA & NA & NA & NA & NA & NA \tabularnewline
(p-val) & (NA ) & (NA ) & (NA ) & (NA ) & (NA ) & (NA ) & (NA ) \tabularnewline
Estimates ( 11 ) & NA & NA & NA & NA & NA & NA & NA \tabularnewline
(p-val) & (NA ) & (NA ) & (NA ) & (NA ) & (NA ) & (NA ) & (NA ) \tabularnewline
Estimates ( 12 ) & NA & NA & NA & NA & NA & NA & NA \tabularnewline
(p-val) & (NA ) & (NA ) & (NA ) & (NA ) & (NA ) & (NA ) & (NA ) \tabularnewline
Estimates ( 13 ) & NA & NA & NA & NA & NA & NA & NA \tabularnewline
(p-val) & (NA ) & (NA ) & (NA ) & (NA ) & (NA ) & (NA ) & (NA ) \tabularnewline
\hline
\end{tabular}
%Source: https://freestatistics.org/blog/index.php?pk=116369&T=1

[TABLE]
[ROW][C]ARIMA Parameter Estimation and Backward Selection[/C][/ROW]
[ROW][C]Iteration[/C][C]ar1[/C][C]ar2[/C][C]ar3[/C][C]ma1[/C][C]sar1[/C][C]sar2[/C][C]sma1[/C][/ROW]
[ROW][C]Estimates ( 1 )[/C][C]0.974[/C][C]-0.0759[/C][C]0.1012[/C][C]-0.7663[/C][C]0.4738[/C][C]-0.1616[/C][C]-0.9817[/C][/ROW]
[ROW][C](p-val)[/C][C](0 )[/C][C](0.7039 )[/C][C](0.5084 )[/C][C](0 )[/C][C](0.0155 )[/C][C](0.3964 )[/C][C](0 )[/C][/ROW]
[ROW][C]Estimates ( 2 )[/C][C]0.932[/C][C]0[/C][C]0.0677[/C][C]-0.7625[/C][C]0.4666[/C][C]-0.1372[/C][C]-1.0091[/C][/ROW]
[ROW][C](p-val)[/C][C](0 )[/C][C](NA )[/C][C](0.7246 )[/C][C](0 )[/C][C](0.0164 )[/C][C](0.487 )[/C][C](0 )[/C][/ROW]
[ROW][C]Estimates ( 3 )[/C][C]1.0008[/C][C]0[/C][C]0[/C][C]-1.2512[/C][C]0.4784[/C][C]-0.1438[/C][C]-1[/C][/ROW]
[ROW][C](p-val)[/C][C](0 )[/C][C](NA )[/C][C](NA )[/C][C](0 )[/C][C](0.0098 )[/C][C](0.391 )[/C][C](0 )[/C][/ROW]
[ROW][C]Estimates ( 4 )[/C][C]0.9944[/C][C]0[/C][C]0[/C][C]-0.806[/C][C]0.5[/C][C]0[/C][C]-1.0015[/C][/ROW]
[ROW][C](p-val)[/C][C](0 )[/C][C](NA )[/C][C](NA )[/C][C](0 )[/C][C](0.0067 )[/C][C](NA )[/C][C](0 )[/C][/ROW]
[ROW][C]Estimates ( 5 )[/C][C]NA[/C][C]NA[/C][C]NA[/C][C]NA[/C][C]NA[/C][C]NA[/C][C]NA[/C][/ROW]
[ROW][C](p-val)[/C][C](NA )[/C][C](NA )[/C][C](NA )[/C][C](NA )[/C][C](NA )[/C][C](NA )[/C][C](NA )[/C][/ROW]
[ROW][C]Estimates ( 6 )[/C][C]NA[/C][C]NA[/C][C]NA[/C][C]NA[/C][C]NA[/C][C]NA[/C][C]NA[/C][/ROW]
[ROW][C](p-val)[/C][C](NA )[/C][C](NA )[/C][C](NA )[/C][C](NA )[/C][C](NA )[/C][C](NA )[/C][C](NA )[/C][/ROW]
[ROW][C]Estimates ( 7 )[/C][C]NA[/C][C]NA[/C][C]NA[/C][C]NA[/C][C]NA[/C][C]NA[/C][C]NA[/C][/ROW]
[ROW][C](p-val)[/C][C](NA )[/C][C](NA )[/C][C](NA )[/C][C](NA )[/C][C](NA )[/C][C](NA )[/C][C](NA )[/C][/ROW]
[ROW][C]Estimates ( 8 )[/C][C]NA[/C][C]NA[/C][C]NA[/C][C]NA[/C][C]NA[/C][C]NA[/C][C]NA[/C][/ROW]
[ROW][C](p-val)[/C][C](NA )[/C][C](NA )[/C][C](NA )[/C][C](NA )[/C][C](NA )[/C][C](NA )[/C][C](NA )[/C][/ROW]
[ROW][C]Estimates ( 9 )[/C][C]NA[/C][C]NA[/C][C]NA[/C][C]NA[/C][C]NA[/C][C]NA[/C][C]NA[/C][/ROW]
[ROW][C](p-val)[/C][C](NA )[/C][C](NA )[/C][C](NA )[/C][C](NA )[/C][C](NA )[/C][C](NA )[/C][C](NA )[/C][/ROW]
[ROW][C]Estimates ( 10 )[/C][C]NA[/C][C]NA[/C][C]NA[/C][C]NA[/C][C]NA[/C][C]NA[/C][C]NA[/C][/ROW]
[ROW][C](p-val)[/C][C](NA )[/C][C](NA )[/C][C](NA )[/C][C](NA )[/C][C](NA )[/C][C](NA )[/C][C](NA )[/C][/ROW]
[ROW][C]Estimates ( 11 )[/C][C]NA[/C][C]NA[/C][C]NA[/C][C]NA[/C][C]NA[/C][C]NA[/C][C]NA[/C][/ROW]
[ROW][C](p-val)[/C][C](NA )[/C][C](NA )[/C][C](NA )[/C][C](NA )[/C][C](NA )[/C][C](NA )[/C][C](NA )[/C][/ROW]
[ROW][C]Estimates ( 12 )[/C][C]NA[/C][C]NA[/C][C]NA[/C][C]NA[/C][C]NA[/C][C]NA[/C][C]NA[/C][/ROW]
[ROW][C](p-val)[/C][C](NA )[/C][C](NA )[/C][C](NA )[/C][C](NA )[/C][C](NA )[/C][C](NA )[/C][C](NA )[/C][/ROW]
[ROW][C]Estimates ( 13 )[/C][C]NA[/C][C]NA[/C][C]NA[/C][C]NA[/C][C]NA[/C][C]NA[/C][C]NA[/C][/ROW]
[ROW][C](p-val)[/C][C](NA )[/C][C](NA )[/C][C](NA )[/C][C](NA )[/C][C](NA )[/C][C](NA )[/C][C](NA )[/C][/ROW]
[/TABLE]
Source: https://freestatistics.org/blog/index.php?pk=116369&T=1

Globally Unique Identifier (entire table): ba.freestatistics.org/blog/index.php?pk=116369&T=1

As an alternative you can also use a QR Code:  

The GUIDs for individual cells are displayed in the table below:

ARIMA Parameter Estimation and Backward Selection
Iterationar1ar2ar3ma1sar1sar2sma1
Estimates ( 1 )0.974-0.07590.1012-0.76630.4738-0.1616-0.9817
(p-val)(0 )(0.7039 )(0.5084 )(0 )(0.0155 )(0.3964 )(0 )
Estimates ( 2 )0.93200.0677-0.76250.4666-0.1372-1.0091
(p-val)(0 )(NA )(0.7246 )(0 )(0.0164 )(0.487 )(0 )
Estimates ( 3 )1.000800-1.25120.4784-0.1438-1
(p-val)(0 )(NA )(NA )(0 )(0.0098 )(0.391 )(0 )
Estimates ( 4 )0.994400-0.8060.50-1.0015
(p-val)(0 )(NA )(NA )(0 )(0.0067 )(NA )(0 )
Estimates ( 5 )NANANANANANANA
(p-val)(NA )(NA )(NA )(NA )(NA )(NA )(NA )
Estimates ( 6 )NANANANANANANA
(p-val)(NA )(NA )(NA )(NA )(NA )(NA )(NA )
Estimates ( 7 )NANANANANANANA
(p-val)(NA )(NA )(NA )(NA )(NA )(NA )(NA )
Estimates ( 8 )NANANANANANANA
(p-val)(NA )(NA )(NA )(NA )(NA )(NA )(NA )
Estimates ( 9 )NANANANANANANA
(p-val)(NA )(NA )(NA )(NA )(NA )(NA )(NA )
Estimates ( 10 )NANANANANANANA
(p-val)(NA )(NA )(NA )(NA )(NA )(NA )(NA )
Estimates ( 11 )NANANANANANANA
(p-val)(NA )(NA )(NA )(NA )(NA )(NA )(NA )
Estimates ( 12 )NANANANANANANA
(p-val)(NA )(NA )(NA )(NA )(NA )(NA )(NA )
Estimates ( 13 )NANANANANANANA
(p-val)(NA )(NA )(NA )(NA )(NA )(NA )(NA )


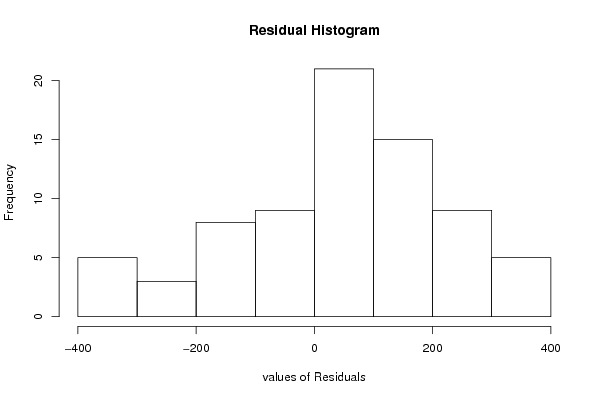
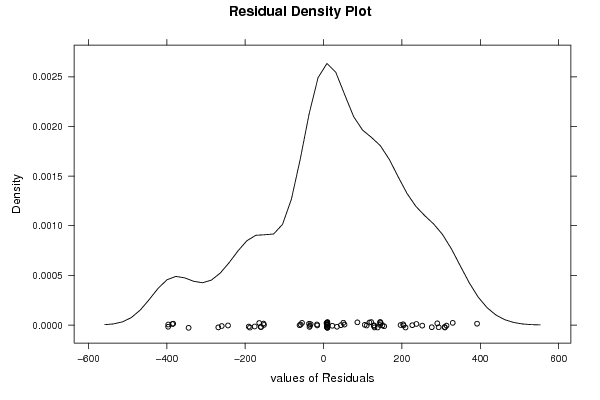
Estimated ARIMA Residuals
Value
9.25191648068957
22.2895174170754
-37.1550939723596
34.2218735428442
-175.779263999711
104.970706461554
-61.2394478852392
-396.700652055843
-396.410485499971
-259.981014374192
127.971363798437
-36.0197218470954
204.130524557671
44.2378119808798
-159.693673293796
203.124025936160
121.747788579892
-16.2022596563867
-243.88459995665
391.669318504803
-164.221968733511
293.799886631637
150.183011195860
-191.019252907871
251.822963054357
-153.377256797879
8.18066887035589
276.146245824639
7.50569879236325
290.255130118324
154.698662788002
-344.486096182892
-268.725206809287
308.780458133835
53.4137978273449
309.715127664998
86.2531881845231
-34.8621109245594
196.557575783292
226.42317965574
-187.994974449445
-58.5822258744507
209.148431956386
145.930346747766
129.447842477219
-33.0896435330983
-386.032890615622
144.238643395984
117.070321910776
129.920850080368
-152.207454260589
-55.0948144150741
144.019351551250
-16.8936924748689
144.627547725067
-160.150310858583
329.615512195132
138.229264079707
9.03690241551724
50.5240129139971
313.806615613953
236.894908385907
110.026062233874
-383.823828810955

\begin{tabular}{lllllllll}
\hline
Estimated ARIMA Residuals \tabularnewline
Value \tabularnewline
9.25191648068957 \tabularnewline
22.2895174170754 \tabularnewline
-37.1550939723596 \tabularnewline
34.2218735428442 \tabularnewline
-175.779263999711 \tabularnewline
104.970706461554 \tabularnewline
-61.2394478852392 \tabularnewline
-396.700652055843 \tabularnewline
-396.410485499971 \tabularnewline
-259.981014374192 \tabularnewline
127.971363798437 \tabularnewline
-36.0197218470954 \tabularnewline
204.130524557671 \tabularnewline
44.2378119808798 \tabularnewline
-159.693673293796 \tabularnewline
203.124025936160 \tabularnewline
121.747788579892 \tabularnewline
-16.2022596563867 \tabularnewline
-243.88459995665 \tabularnewline
391.669318504803 \tabularnewline
-164.221968733511 \tabularnewline
293.799886631637 \tabularnewline
150.183011195860 \tabularnewline
-191.019252907871 \tabularnewline
251.822963054357 \tabularnewline
-153.377256797879 \tabularnewline
8.18066887035589 \tabularnewline
276.146245824639 \tabularnewline
7.50569879236325 \tabularnewline
290.255130118324 \tabularnewline
154.698662788002 \tabularnewline
-344.486096182892 \tabularnewline
-268.725206809287 \tabularnewline
308.780458133835 \tabularnewline
53.4137978273449 \tabularnewline
309.715127664998 \tabularnewline
86.2531881845231 \tabularnewline
-34.8621109245594 \tabularnewline
196.557575783292 \tabularnewline
226.42317965574 \tabularnewline
-187.994974449445 \tabularnewline
-58.5822258744507 \tabularnewline
209.148431956386 \tabularnewline
145.930346747766 \tabularnewline
129.447842477219 \tabularnewline
-33.0896435330983 \tabularnewline
-386.032890615622 \tabularnewline
144.238643395984 \tabularnewline
117.070321910776 \tabularnewline
129.920850080368 \tabularnewline
-152.207454260589 \tabularnewline
-55.0948144150741 \tabularnewline
144.019351551250 \tabularnewline
-16.8936924748689 \tabularnewline
144.627547725067 \tabularnewline
-160.150310858583 \tabularnewline
329.615512195132 \tabularnewline
138.229264079707 \tabularnewline
9.03690241551724 \tabularnewline
50.5240129139971 \tabularnewline
313.806615613953 \tabularnewline
236.894908385907 \tabularnewline
110.026062233874 \tabularnewline
-383.823828810955 \tabularnewline
\hline
\end{tabular}
%Source: https://freestatistics.org/blog/index.php?pk=116369&T=2

[TABLE]
[ROW][C]Estimated ARIMA Residuals[/C][/ROW]
[ROW][C]Value[/C][/ROW]
[ROW][C]9.25191648068957[/C][/ROW]
[ROW][C]22.2895174170754[/C][/ROW]
[ROW][C]-37.1550939723596[/C][/ROW]
[ROW][C]34.2218735428442[/C][/ROW]
[ROW][C]-175.779263999711[/C][/ROW]
[ROW][C]104.970706461554[/C][/ROW]
[ROW][C]-61.2394478852392[/C][/ROW]
[ROW][C]-396.700652055843[/C][/ROW]
[ROW][C]-396.410485499971[/C][/ROW]
[ROW][C]-259.981014374192[/C][/ROW]
[ROW][C]127.971363798437[/C][/ROW]
[ROW][C]-36.0197218470954[/C][/ROW]
[ROW][C]204.130524557671[/C][/ROW]
[ROW][C]44.2378119808798[/C][/ROW]
[ROW][C]-159.693673293796[/C][/ROW]
[ROW][C]203.124025936160[/C][/ROW]
[ROW][C]121.747788579892[/C][/ROW]
[ROW][C]-16.2022596563867[/C][/ROW]
[ROW][C]-243.88459995665[/C][/ROW]
[ROW][C]391.669318504803[/C][/ROW]
[ROW][C]-164.221968733511[/C][/ROW]
[ROW][C]293.799886631637[/C][/ROW]
[ROW][C]150.183011195860[/C][/ROW]
[ROW][C]-191.019252907871[/C][/ROW]
[ROW][C]251.822963054357[/C][/ROW]
[ROW][C]-153.377256797879[/C][/ROW]
[ROW][C]8.18066887035589[/C][/ROW]
[ROW][C]276.146245824639[/C][/ROW]
[ROW][C]7.50569879236325[/C][/ROW]
[ROW][C]290.255130118324[/C][/ROW]
[ROW][C]154.698662788002[/C][/ROW]
[ROW][C]-344.486096182892[/C][/ROW]
[ROW][C]-268.725206809287[/C][/ROW]
[ROW][C]308.780458133835[/C][/ROW]
[ROW][C]53.4137978273449[/C][/ROW]
[ROW][C]309.715127664998[/C][/ROW]
[ROW][C]86.2531881845231[/C][/ROW]
[ROW][C]-34.8621109245594[/C][/ROW]
[ROW][C]196.557575783292[/C][/ROW]
[ROW][C]226.42317965574[/C][/ROW]
[ROW][C]-187.994974449445[/C][/ROW]
[ROW][C]-58.5822258744507[/C][/ROW]
[ROW][C]209.148431956386[/C][/ROW]
[ROW][C]145.930346747766[/C][/ROW]
[ROW][C]129.447842477219[/C][/ROW]
[ROW][C]-33.0896435330983[/C][/ROW]
[ROW][C]-386.032890615622[/C][/ROW]
[ROW][C]144.238643395984[/C][/ROW]
[ROW][C]117.070321910776[/C][/ROW]
[ROW][C]129.920850080368[/C][/ROW]
[ROW][C]-152.207454260589[/C][/ROW]
[ROW][C]-55.0948144150741[/C][/ROW]
[ROW][C]144.019351551250[/C][/ROW]
[ROW][C]-16.8936924748689[/C][/ROW]
[ROW][C]144.627547725067[/C][/ROW]
[ROW][C]-160.150310858583[/C][/ROW]
[ROW][C]329.615512195132[/C][/ROW]
[ROW][C]138.229264079707[/C][/ROW]
[ROW][C]9.03690241551724[/C][/ROW]
[ROW][C]50.5240129139971[/C][/ROW]
[ROW][C]313.806615613953[/C][/ROW]
[ROW][C]236.894908385907[/C][/ROW]
[ROW][C]110.026062233874[/C][/ROW]
[ROW][C]-383.823828810955[/C][/ROW]
[/TABLE]
Source: https://freestatistics.org/blog/index.php?pk=116369&T=2

Globally Unique Identifier (entire table): ba.freestatistics.org/blog/index.php?pk=116369&T=2

As an alternative you can also use a QR Code:  

The GUIDs for individual cells are displayed in the table below:

Estimated ARIMA Residuals
Value
9.25191648068957
22.2895174170754
-37.1550939723596
34.2218735428442
-175.779263999711
104.970706461554
-61.2394478852392
-396.700652055843
-396.410485499971
-259.981014374192
127.971363798437
-36.0197218470954
204.130524557671
44.2378119808798
-159.693673293796
203.124025936160
121.747788579892
-16.2022596563867
-243.88459995665
391.669318504803
-164.221968733511
293.799886631637
150.183011195860
-191.019252907871
251.822963054357
-153.377256797879
8.18066887035589
276.146245824639
7.50569879236325
290.255130118324
154.698662788002
-344.486096182892
-268.725206809287
308.780458133835
53.4137978273449
309.715127664998
86.2531881845231
-34.8621109245594
196.557575783292
226.42317965574
-187.994974449445
-58.5822258744507
209.148431956386
145.930346747766
129.447842477219
-33.0896435330983
-386.032890615622
144.238643395984
117.070321910776
129.920850080368
-152.207454260589
-55.0948144150741
144.019351551250
-16.8936924748689
144.627547725067
-160.150310858583
329.615512195132
138.229264079707
9.03690241551724
50.5240129139971
313.806615613953
236.894908385907
110.026062233874
-383.823828810955


Parameters (Session):
par1 = FALSE ; par2 = 1 ; par3 = 0 ; par4 = 1 ; par5 = 12 ; par6 = 3 ; par7 = 1 ; par8 = 2 ; par9 = 1 ;
Parameters (R input):
par1 = FALSE ; par2 = 1 ; par3 = 0 ; par4 = 1 ; par5 = 12 ; par6 = 3 ; par7 = 1 ; par8 = 2 ; par9 = 1 ;
R code (references can be found in the software module):
library(lattice)
if (par1 == 'TRUE') par1 <- TRUE
if (par1 == 'FALSE') par1 <- FALSE
par2 <- as.numeric(par2) #Box-Cox lambda transformation parameter
par3 <- as.numeric(par3) #degree of non-seasonal differencing
par4 <- as.numeric(par4) #degree of seasonal differencing
par5 <- as.numeric(par5) #seasonal period
par6 <- as.numeric(par6) #degree (p) of the non-seasonal AR(p) polynomial
par7 <- as.numeric(par7) #degree (q) of the non-seasonal MA(q) polynomial
par8 <- as.numeric(par8) #degree (P) of the seasonal AR(P) polynomial
par9 <- as.numeric(par9) #degree (Q) of the seasonal MA(Q) polynomial
armaGR <- function(arima.out, names, n){
try1 <- arima.out$coef
try2 <- sqrt(diag(arima.out$var.coef))
try.data.frame <- data.frame(matrix(NA,ncol=4,nrow=length(names)))
dimnames(try.data.frame) <- list(names,c('coef','std','tstat','pv'))
try.data.frame[,1] <- try1
for(i in 1:length(try2)) try.data.frame[which(rownames(try.data.frame)==names(try2)[i]),2] <- try2[i]
try.data.frame[,3] <- try.data.frame[,1] / try.data.frame[,2]
try.data.frame[,4] <- round((1-pt(abs(try.data.frame[,3]),df=n-(length(try2)+1)))*2,5)
vector <- rep(NA,length(names))
vector[is.na(try.data.frame[,4])] <- 0
maxi <- which.max(try.data.frame[,4])
continue <- max(try.data.frame[,4],na.rm=TRUE) > .05
vector[maxi] <- 0
list(summary=try.data.frame,next.vector=vector,continue=continue)
}
arimaSelect <- function(series, order=c(13,0,0), seasonal=list(order=c(2,0,0),period=12), include.mean=F){
nrc <- order[1]+order[3]+seasonal$order[1]+seasonal$order[3]
coeff <- matrix(NA, nrow=nrc*2, ncol=nrc)
pval <- matrix(NA, nrow=nrc*2, ncol=nrc)
mylist <- rep(list(NULL), nrc)
names <- NULL
if(order[1] > 0) names <- paste('ar',1:order[1],sep='')
if(order[3] > 0) names <- c( names , paste('ma',1:order[3],sep='') )
if(seasonal$order[1] > 0) names <- c(names, paste('sar',1:seasonal$order[1],sep=''))
if(seasonal$order[3] > 0) names <- c(names, paste('sma',1:seasonal$order[3],sep=''))
arima.out <- arima(series, order=order, seasonal=seasonal, include.mean=include.mean, method='ML')
mylist[[1]] <- arima.out
last.arma <- armaGR(arima.out, names, length(series))
mystop <- FALSE
i <- 1
coeff[i,] <- last.arma[[1]][,1]
pval [i,] <- last.arma[[1]][,4]
i <- 2
aic <- arima.out$aic
while(!mystop){
mylist[[i]] <- arima.out
arima.out <- arima(series, order=order, seasonal=seasonal, include.mean=include.mean, method='ML', fixed=last.arma$next.vector)
aic <- c(aic, arima.out$aic)
last.arma <- armaGR(arima.out, names, length(series))
mystop <- !last.arma$continue
coeff[i,] <- last.arma[[1]][,1]
pval [i,] <- last.arma[[1]][,4]
i <- i+1
}
list(coeff, pval, mylist, aic=aic)
}
arimaSelectplot <- function(arimaSelect.out,noms,choix){
noms <- names(arimaSelect.out[[3]][[1]]$coef)
coeff <- arimaSelect.out[[1]]
k <- min(which(is.na(coeff[,1])))-1
coeff <- coeff[1:k,]
pval <- arimaSelect.out[[2]][1:k,]
aic <- arimaSelect.out$aic[1:k]
coeff[coeff==0] <- NA
n <- ncol(coeff)
if(missing(choix)) choix <- k
layout(matrix(c(1,1,1,2,
3,3,3,2,
3,3,3,4,
5,6,7,7),nr=4),
widths=c(10,35,45,15),
heights=c(30,30,15,15))
couleurs <- rainbow(75)[1:50]#(50)
ticks <- pretty(coeff)
par(mar=c(1,1,3,1))
plot(aic,k:1-.5,type='o',pch=21,bg='blue',cex=2,axes=F,lty=2,xpd=NA)
points(aic[choix],k-choix+.5,pch=21,cex=4,bg=2,xpd=NA)
title('aic',line=2)
par(mar=c(3,0,0,0))
plot(0,axes=F,xlab='',ylab='',xlim=range(ticks),ylim=c(.1,1))
rect(xleft = min(ticks) + (0:49)/50*(max(ticks)-min(ticks)),
xright = min(ticks) + (1:50)/50*(max(ticks)-min(ticks)),
ytop = rep(1,50),
ybottom= rep(0,50),col=couleurs,border=NA)
axis(1,ticks)
rect(xleft=min(ticks),xright=max(ticks),ytop=1,ybottom=0)
text(mean(coeff,na.rm=T),.5,'coefficients',cex=2,font=2)
par(mar=c(1,1,3,1))
image(1:n,1:k,t(coeff[k:1,]),axes=F,col=couleurs,zlim=range(ticks))
for(i in 1:n) for(j in 1:k) if(!is.na(coeff[j,i])) {
if(pval[j,i]<.01) symb = 'green'
else if( (pval[j,i]<.05) & (pval[j,i]>=.01)) symb = 'orange'
else if( (pval[j,i]<.1) & (pval[j,i]>=.05)) symb = 'red'
else symb = 'black'
polygon(c(i+.5 ,i+.2 ,i+.5 ,i+.5),
c(k-j+0.5,k-j+0.5,k-j+0.8,k-j+0.5),
col=symb)
if(j==choix) {
rect(xleft=i-.5,
xright=i+.5,
ybottom=k-j+1.5,
ytop=k-j+.5,
lwd=4)
text(i,
k-j+1,
round(coeff[j,i],2),
cex=1.2,
font=2)
}
else{
rect(xleft=i-.5,xright=i+.5,ybottom=k-j+1.5,ytop=k-j+.5)
text(i,k-j+1,round(coeff[j,i],2),cex=1.2,font=1)
}
}
axis(3,1:n,noms)
par(mar=c(0.5,0,0,0.5))
plot(0,axes=F,xlab='',ylab='',type='n',xlim=c(0,8),ylim=c(-.2,.8))
cols <- c('green','orange','red','black')
niv <- c('0','0.01','0.05','0.1')
for(i in 0:3){
polygon(c(1+2*i ,1+2*i ,1+2*i-.5 ,1+2*i),
c(.4 ,.7 , .4 , .4),
col=cols[i+1])
text(2*i,0.5,niv[i+1],cex=1.5)
}
text(8,.5,1,cex=1.5)
text(4,0,'p-value',cex=2)
box()
residus <- arimaSelect.out[[3]][[choix]]$res
par(mar=c(1,2,4,1))
acf(residus,main='')
title('acf',line=.5)
par(mar=c(1,2,4,1))
pacf(residus,main='')
title('pacf',line=.5)
par(mar=c(2,2,4,1))
qqnorm(residus,main='')
title('qq-norm',line=.5)
qqline(residus)
residus
}
if (par2 == 0) x <- log(x)
if (par2 != 0) x <- x^par2
(selection <- arimaSelect(x, order=c(par6,par3,par7), seasonal=list(order=c(par8,par4,par9), period=par5)))
bitmap(file='test1.png')
resid <- arimaSelectplot(selection)
dev.off()
resid
bitmap(file='test2.png')
acf(resid,length(resid)/2, main='Residual Autocorrelation Function')
dev.off()
bitmap(file='test3.png')
pacf(resid,length(resid)/2, main='Residual Partial Autocorrelation Function')
dev.off()
bitmap(file='test4.png')
cpgram(resid, main='Residual Cumulative Periodogram')
dev.off()
bitmap(file='test5.png')
hist(resid, main='Residual Histogram', xlab='values of Residuals')
dev.off()
bitmap(file='test6.png')
densityplot(~resid,col='black',main='Residual Density Plot', xlab='values of Residuals')
dev.off()
bitmap(file='test7.png')
qqnorm(resid, main='Residual Normal Q-Q Plot')
qqline(resid)
dev.off()
ncols <- length(selection[[1]][1,])
nrows <- length(selection[[2]][,1])-1
load(file='createtable')
a<-table.start()
a<-table.row.start(a)
a<-table.element(a,'ARIMA Parameter Estimation and Backward Selection', ncols+1,TRUE)
a<-table.row.end(a)
a<-table.row.start(a)
a<-table.element(a,'Iteration', header=TRUE)
for (i in 1:ncols) {
a<-table.element(a,names(selection[[3]][[1]]$coef)[i],header=TRUE)
}
a<-table.row.end(a)
for (j in 1:nrows) {
a<-table.row.start(a)
mydum <- 'Estimates ('
mydum <- paste(mydum,j)
mydum <- paste(mydum,')')
a<-table.element(a,mydum, header=TRUE)
for (i in 1:ncols) {
a<-table.element(a,round(selection[[1]][j,i],4))
}
a<-table.row.end(a)
a<-table.row.start(a)
a<-table.element(a,'(p-val)', header=TRUE)
for (i in 1:ncols) {
mydum <- '('
mydum <- paste(mydum,round(selection[[2]][j,i],4),sep='')
mydum <- paste(mydum,')')
a<-table.element(a,mydum)
}
a<-table.row.end(a)
}
a<-table.end(a)
table.save(a,file='mytable.tab')
a<-table.start()
a<-table.row.start(a)
a<-table.element(a,'Estimated ARIMA Residuals', 1,TRUE)
a<-table.row.end(a)
a<-table.row.start(a)
a<-table.element(a,'Value', 1,TRUE)
a<-table.row.end(a)
for (i in (par4*par5+par3):length(resid)) {
a<-table.row.start(a)
a<-table.element(a,resid[i])
a<-table.row.end(a)
}
a<-table.end(a)
table.save(a,file='mytable1.tab')