| Multiple Linear Regression - Estimated Regression Equation |
| VlaamsGewest[t] = + 4.24548645333661 + 0.0793346820558553Zelfstandigen[t] + 1.1421704037988Arbeiders[t] -0.161796871191036Bedienden[t] + 0.0837696508067514Gepensioneerden[t] -0.0720956413728646A.N.A.[t] + e[t] |
| Multiple Linear Regression - Ordinary Least Squares | |||||
| Variable | Parameter | S.D. | T-STAT H0: parameter = 0 | 2-tail p-value | 1-tail p-value |
| (Intercept) | 4.24548645333661 | 13.497978 | 0.3145 | 0.755042 | 0.377521 |
| Zelfstandigen | 0.0793346820558553 | 0.093334 | 0.85 | 0.401267 | 0.200634 |
| Arbeiders | 1.1421704037988 | 0.077034 | 14.8269 | 0 | 0 |
| Bedienden | -0.161796871191036 | 0.099888 | -1.6198 | 0.11452 | 0.05726 |
| Gepensioneerden | 0.0837696508067514 | 0.053886 | 1.5546 | 0.12931 | 0.064655 |
| A.N.A. | -0.0720956413728646 | 0.054433 | -1.3245 | 0.194177 | 0.097088 |
| Multiple Linear Regression - Regression Statistics | |
| Multiple R | 0.980271404865744 |
| R-squared | 0.96093202719746 |
| Adjusted R-squared | 0.95518673707944 |
| F-TEST (value) | 167.255614156615 |
| F-TEST (DF numerator) | 5 |
| F-TEST (DF denominator) | 34 |
| p-value | 0 |
| Multiple Linear Regression - Residual Statistics | |
| Residual Standard Deviation | 54.9858190098112 |
| Sum Squared Residuals | 102796.969934110 |
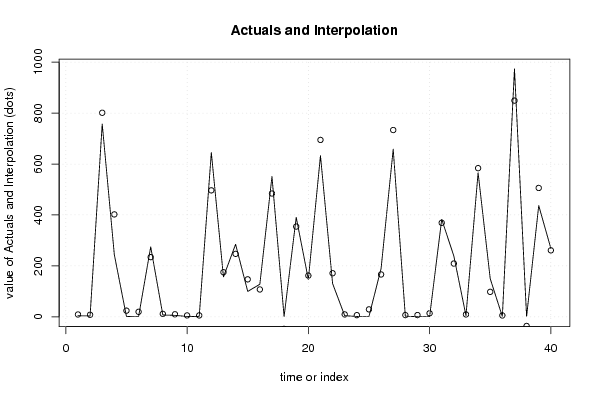
| Multiple Linear Regression - Actuals, Interpolation, and Residuals | |||
| Time or Index | Actuals | Interpolation Forecast | Residuals Prediction Error |
| 1 | 4.607 | 9.5601697505981 | -4.95316975059809 |
| 2 | 3.607 | 8.36412999715296 | -4.75712999715296 |
| 3 | 757 | 800.996957898815 | -43.9969578988150 |
| 4 | 244 | 402.300589357734 | -158.300589357734 |
| 5 | 1.485 | 24.5414429140296 | -23.0564429140296 |
| 6 | 1.21 | 19.9699285855832 | -18.7599285855832 |
| 7 | 275 | 234.63101455028 | 40.3689854497198 |
| 8 | 7.666 | 11.8815426485572 | -4.21554264855724 |
| 9 | 6.101 | 10.2746462238380 | -4.17364622383796 |
| 10 | 1.566 | 5.852538743348 | -4.286538743348 |
| 11 | 1.866 | 5.87856614485098 | -4.01256614485098 |
| 12 | 645 | 496.592213091124 | 148.407786908876 |
| 13 | 157 | 175.330749419607 | -18.3307494196067 |
| 14 | 285 | 247.396381641290 | 37.6036183587098 |
| 15 | 100 | 147.44394581982 | -47.44394581982 |
| 16 | 128 | 107.770452621675 | 20.2295473783248 |
| 17 | 551 | 484.259999194181 | 66.7400008058187 |
| 18 | 1.303 | -46.9672252864398 | 48.2702252864398 |
| 19 | 391 | 354.518561243847 | 36.4814387561525 |
| 20 | 147 | 162.08884509349 | -15.0888450934899 |
| 21 | 633 | 694.506696510315 | -61.5066965103154 |
| 22 | 131 | 171.346547031823 | -40.3465470318231 |
| 23 | 4.642 | 9.8084465914482 | -5.16644659144819 |
| 24 | 1.804 | 6.83592813966201 | -5.03192813966201 |
| 25 | 1.99 | 29.5385984873545 | -27.5485984873545 |
| 26 | 190 | 166.542161948142 | 23.4578380518581 |
| 27 | 658 | 733.330866178044 | -75.3308661780438 |
| 28 | 2.681 | 7.1177244177385 | -4.43672441773849 |
| 29 | 1.038 | 7.26629661368272 | -6.22829661368272 |
| 30 | 1.02 | 14.2469764838206 | -13.2269764838206 |
| 31 | 383 | 369.232823664249 | 13.7671763357510 |
| 32 | 239 | 209.47723969328 | 29.5227603067201 |
| 33 | 5.359 | 9.71403286126088 | -4.35503286126088 |
| 34 | 566 | 583.728422915375 | -17.7284229153750 |
| 35 | 150 | 98.3627712467854 | 51.6372287532146 |
| 36 | 1.625 | 5.7728264921531 | -4.1478264921531 |
| 37 | 973 | 848.68384571799 | 124.316154282010 |
| 38 | 1.339 | -35.5149966649510 | 36.8539966649510 |
| 39 | 437 | 506.011735303891 | -69.0117353038909 |
| 40 | 269 | 261.214606714555 | 7.78539328544528 |
| Goldfeld-Quandt test for Heteroskedasticity | |||
| p-values | Alternative Hypothesis | ||
| breakpoint index | greater | 2-sided | less |
| 9 | 1.06046549054568e-06 | 2.12093098109136e-06 | 0.99999893953451 |
| 10 | 1.28043196102449e-08 | 2.56086392204898e-08 | 0.99999998719568 |
| 11 | 7.1758188639975e-10 | 1.4351637727995e-09 | 0.999999999282418 |
| 12 | 1.01469595734947e-10 | 2.02939191469893e-10 | 0.99999999989853 |
| 13 | 0.000773820690571146 | 0.00154764138114229 | 0.999226179309429 |
| 14 | 0.000230845673725813 | 0.000461691347451626 | 0.999769154326274 |
| 15 | 0.000314073728796544 | 0.000628147457593088 | 0.999685926271203 |
| 16 | 0.000106123004225021 | 0.000212246008450042 | 0.999893876995775 |
| 17 | 0.000319366988677048 | 0.000638733977354095 | 0.999680633011323 |
| 18 | 0.000601219878058865 | 0.00120243975611773 | 0.999398780121941 |
| 19 | 0.0425329118402481 | 0.0850658236804961 | 0.957467088159752 |
| 20 | 0.0274660141020897 | 0.0549320282041793 | 0.97253398589791 |
| 21 | 0.0236296612271339 | 0.0472593224542678 | 0.976370338772866 |
| 22 | 0.0313992268697044 | 0.0627984537394089 | 0.968600773130296 |
| 23 | 0.0202421484909168 | 0.0404842969818336 | 0.979757851509083 |
| 24 | 0.0141791235077972 | 0.0283582470155943 | 0.985820876492203 |
| 25 | 0.00810916352449201 | 0.0162183270489840 | 0.991890836475508 |
| 26 | 0.00655670234774137 | 0.0131134046954827 | 0.993443297652259 |
| 27 | 0.0614089152825863 | 0.122817830565173 | 0.938591084717414 |
| 28 | 0.03911853356864 | 0.07823706713728 | 0.96088146643136 |
| 29 | 0.0187766427426646 | 0.0375532854853292 | 0.981223357257335 |
| 30 | 0.00796875268976377 | 0.0159375053795275 | 0.992031247310236 |
| 31 | 0.379720466308884 | 0.759440932617767 | 0.620279533691116 |
| Meta Analysis of Goldfeld-Quandt test for Heteroskedasticity | |||
| Description | # significant tests | % significant tests | OK/NOK |
| 1% type I error level | 10 | 0.434782608695652 | NOK |
| 5% type I error level | 17 | 0.739130434782609 | NOK |
| 10% type I error level | 21 | 0.91304347826087 | NOK |