Free Statistics

of Irreproducible Research!

Author's title

Author*The author of this computation has been verified*
R Software Modulerwasp_multipleregression.wasp
Title produced by softwareMultiple Regression
Date of computationTue, 28 Dec 2010 12:53:33 +0000
Cite this page as followsStatistical Computations at FreeStatistics.org, Office for Research Development and Education, URL https://freestatistics.org/blog/index.php?v=date/2010/Dec/28/t129354102749ik5lbmtg853vl.htm/, Retrieved Sun, 05 May 2024 01:46:55 +0000
Statistical Computations at FreeStatistics.org, Office for Research Development and Education, URL https://freestatistics.org/blog/index.php?pk=116333, Retrieved Sun, 05 May 2024 01:46:55 +0000
QR Codes:

Original text written by user:
IsPrivate?No (this computation is public)
User-defined keywords
Estimated Impact129
Family? (F = Feedback message, R = changed R code, M = changed R Module, P = changed Parameters, D = changed Data)
-     [Pearson Correlation] [] [2010-12-19 16:03:01] [abe7df3fc544bbb0ed435b4e9982bc91]
- RMPD    [Multiple Regression] [] [2010-12-28 12:53:33] [a0230832f45c35a2d59555dc09dfd471] [Current]
Feedback Forum

Post a new message
Dataseries X:
4.607	5.485	4.969	5.231	3.642	3.532
3.607	4.397	3.830	4.071	2.894	2.614
757	882	748	874	624	533
244	205	390	286	123	384
1.485	2.655	1.295	2.005	757	617
1.210	2.198	1.075	1.631	601	496
275	457	219	373	156	121
7.666	8.849	7.045	8.112	7.356	5.774
6.101	7.099	5.586	6.573	5.717	4.572
1.566	1.750	1.459	1.539	1.640	1.201
1.866	2.111	1.599	2.441	1.375	1.123
645	534	538	967	379	552
157	125	168	222	106	51
285	389	230	357	216	149
100	124	135	134	48	44
128	109	107	188	85	56
551	831	421	572	541	271
1.303	1.123	1.200	1.414	1.362	729
391	365	321	398	442	249
147	150	146	152	157	130
633	538	641	716	618	284
131	168	147	129	127	54
4.642	7.891	5.078	5.565	2.721	2.643
1.804	3.880	2.221	1.682	1.215	1.162
1.990	2.946	1.989	2.776	990	828
190	249	167	279	90	147
658	815	700	829	424	506
2.681	3.427	2.769	3.587	1.565	1.568
1.038	1.489	1.096	1.290	641	719
1.020	1.142	1.103	1.370	618	595
383	397	355	499	287	212
239	399	214	429	19	42
5.359	7.882	5.079	6.543	3.742	2.950
566	736	542	676	434	346
150	321	85	184	96	93
1.625	2.336	1.450	1.954	1.161	1.321
973	1.775	710	1.247	639	277
1.339	1.832	1.560	1.514	1.008	576
437	439	502	669	186	191
269	443	230	300	218	147


Summary of computational transaction
Raw Inputview raw input (R code)
Raw Outputview raw output of R engine
Computing time5 seconds
R Server'Sir Ronald Aylmer Fisher' @ 193.190.124.24

\begin{tabular}{lllllllll}
\hline
Summary of computational transaction \tabularnewline
Raw Input & view raw input (R code)  \tabularnewline
Raw Output & view raw output of R engine  \tabularnewline
Computing time & 5 seconds \tabularnewline
R Server & 'Sir Ronald Aylmer Fisher' @ 193.190.124.24 \tabularnewline
\hline
\end{tabular}
%Source: https://freestatistics.org/blog/index.php?pk=116333&T=0

[TABLE]
[ROW][C]Summary of computational transaction[/C][/ROW]
[ROW][C]Raw Input[/C][C]view raw input (R code) [/C][/ROW]
[ROW][C]Raw Output[/C][C]view raw output of R engine [/C][/ROW]
[ROW][C]Computing time[/C][C]5 seconds[/C][/ROW]
[ROW][C]R Server[/C][C]'Sir Ronald Aylmer Fisher' @ 193.190.124.24[/C][/ROW]
[/TABLE]
Source: https://freestatistics.org/blog/index.php?pk=116333&T=0

Globally Unique Identifier (entire table): ba.freestatistics.org/blog/index.php?pk=116333&T=0

As an alternative you can also use a QR Code:  

The GUIDs for individual cells are displayed in the table below:

Summary of computational transaction
Raw Inputview raw input (R code)
Raw Outputview raw output of R engine
Computing time5 seconds
R Server'Sir Ronald Aylmer Fisher' @ 193.190.124.24


Multiple Linear Regression - Estimated Regression Equation
VlaamsGewest[t] = + 4.24548645333661 + 0.0793346820558553Zelfstandigen[t] + 1.1421704037988Arbeiders[t] -0.161796871191036Bedienden[t] + 0.0837696508067514Gepensioneerden[t] -0.0720956413728646A.N.A.[t] + e[t]

\begin{tabular}{lllllllll}
\hline
Multiple Linear Regression - Estimated Regression Equation \tabularnewline
VlaamsGewest[t] =  +  4.24548645333661 +  0.0793346820558553Zelfstandigen[t] +  1.1421704037988Arbeiders[t] -0.161796871191036Bedienden[t] +  0.0837696508067514Gepensioneerden[t] -0.0720956413728646A.N.A.[t]  + e[t] \tabularnewline
\hline
\end{tabular}
%Source: https://freestatistics.org/blog/index.php?pk=116333&T=1

[TABLE]
[ROW][C]Multiple Linear Regression - Estimated Regression Equation[/C][/ROW]
[ROW][C]VlaamsGewest[t] =  +  4.24548645333661 +  0.0793346820558553Zelfstandigen[t] +  1.1421704037988Arbeiders[t] -0.161796871191036Bedienden[t] +  0.0837696508067514Gepensioneerden[t] -0.0720956413728646A.N.A.[t]  + e[t][/C][/ROW]
[/TABLE]
Source: https://freestatistics.org/blog/index.php?pk=116333&T=1

Globally Unique Identifier (entire table): ba.freestatistics.org/blog/index.php?pk=116333&T=1

As an alternative you can also use a QR Code:  

The GUIDs for individual cells are displayed in the table below:

Multiple Linear Regression - Estimated Regression Equation
VlaamsGewest[t] = + 4.24548645333661 + 0.0793346820558553Zelfstandigen[t] + 1.1421704037988Arbeiders[t] -0.161796871191036Bedienden[t] + 0.0837696508067514Gepensioneerden[t] -0.0720956413728646A.N.A.[t] + e[t]


Multiple Linear Regression - Ordinary Least Squares
VariableParameterS.D.T-STATH0: parameter = 02-tail p-value1-tail p-value
(Intercept)4.2454864533366113.4979780.31450.7550420.377521
Zelfstandigen0.07933468205585530.0933340.850.4012670.200634
Arbeiders1.14217040379880.07703414.826900
Bedienden-0.1617968711910360.099888-1.61980.114520.05726
Gepensioneerden0.08376965080675140.0538861.55460.129310.064655
A.N.A.-0.07209564137286460.054433-1.32450.1941770.097088

\begin{tabular}{lllllllll}
\hline
Multiple Linear Regression - Ordinary Least Squares \tabularnewline
Variable & Parameter & S.D. & T-STATH0: parameter = 0 & 2-tail p-value & 1-tail p-value \tabularnewline
(Intercept) & 4.24548645333661 & 13.497978 & 0.3145 & 0.755042 & 0.377521 \tabularnewline
Zelfstandigen & 0.0793346820558553 & 0.093334 & 0.85 & 0.401267 & 0.200634 \tabularnewline
Arbeiders & 1.1421704037988 & 0.077034 & 14.8269 & 0 & 0 \tabularnewline
Bedienden & -0.161796871191036 & 0.099888 & -1.6198 & 0.11452 & 0.05726 \tabularnewline
Gepensioneerden & 0.0837696508067514 & 0.053886 & 1.5546 & 0.12931 & 0.064655 \tabularnewline
A.N.A. & -0.0720956413728646 & 0.054433 & -1.3245 & 0.194177 & 0.097088 \tabularnewline
\hline
\end{tabular}
%Source: https://freestatistics.org/blog/index.php?pk=116333&T=2

[TABLE]
[ROW][C]Multiple Linear Regression - Ordinary Least Squares[/C][/ROW]
[ROW][C]Variable[/C][C]Parameter[/C][C]S.D.[/C][C]T-STATH0: parameter = 0[/C][C]2-tail p-value[/C][C]1-tail p-value[/C][/ROW]
[ROW][C](Intercept)[/C][C]4.24548645333661[/C][C]13.497978[/C][C]0.3145[/C][C]0.755042[/C][C]0.377521[/C][/ROW]
[ROW][C]Zelfstandigen[/C][C]0.0793346820558553[/C][C]0.093334[/C][C]0.85[/C][C]0.401267[/C][C]0.200634[/C][/ROW]
[ROW][C]Arbeiders[/C][C]1.1421704037988[/C][C]0.077034[/C][C]14.8269[/C][C]0[/C][C]0[/C][/ROW]
[ROW][C]Bedienden[/C][C]-0.161796871191036[/C][C]0.099888[/C][C]-1.6198[/C][C]0.11452[/C][C]0.05726[/C][/ROW]
[ROW][C]Gepensioneerden[/C][C]0.0837696508067514[/C][C]0.053886[/C][C]1.5546[/C][C]0.12931[/C][C]0.064655[/C][/ROW]
[ROW][C]A.N.A.[/C][C]-0.0720956413728646[/C][C]0.054433[/C][C]-1.3245[/C][C]0.194177[/C][C]0.097088[/C][/ROW]
[/TABLE]
Source: https://freestatistics.org/blog/index.php?pk=116333&T=2

Globally Unique Identifier (entire table): ba.freestatistics.org/blog/index.php?pk=116333&T=2

As an alternative you can also use a QR Code:  

The GUIDs for individual cells are displayed in the table below:

Multiple Linear Regression - Ordinary Least Squares
VariableParameterS.D.T-STATH0: parameter = 02-tail p-value1-tail p-value
(Intercept)4.2454864533366113.4979780.31450.7550420.377521
Zelfstandigen0.07933468205585530.0933340.850.4012670.200634
Arbeiders1.14217040379880.07703414.826900
Bedienden-0.1617968711910360.099888-1.61980.114520.05726
Gepensioneerden0.08376965080675140.0538861.55460.129310.064655
A.N.A.-0.07209564137286460.054433-1.32450.1941770.097088


Multiple Linear Regression - Regression Statistics
Multiple R0.980271404865744
R-squared0.96093202719746
Adjusted R-squared0.95518673707944
F-TEST (value)167.255614156615
F-TEST (DF numerator)5
F-TEST (DF denominator)34
p-value0
Multiple Linear Regression - Residual Statistics
Residual Standard Deviation54.9858190098112
Sum Squared Residuals102796.969934110

\begin{tabular}{lllllllll}
\hline
Multiple Linear Regression - Regression Statistics \tabularnewline
Multiple R & 0.980271404865744 \tabularnewline
R-squared & 0.96093202719746 \tabularnewline
Adjusted R-squared & 0.95518673707944 \tabularnewline
F-TEST (value) & 167.255614156615 \tabularnewline
F-TEST (DF numerator) & 5 \tabularnewline
F-TEST (DF denominator) & 34 \tabularnewline
p-value & 0 \tabularnewline
Multiple Linear Regression - Residual Statistics \tabularnewline
Residual Standard Deviation & 54.9858190098112 \tabularnewline
Sum Squared Residuals & 102796.969934110 \tabularnewline
\hline
\end{tabular}
%Source: https://freestatistics.org/blog/index.php?pk=116333&T=3

[TABLE]
[ROW][C]Multiple Linear Regression - Regression Statistics[/C][/ROW]
[ROW][C]Multiple R[/C][C]0.980271404865744[/C][/ROW]
[ROW][C]R-squared[/C][C]0.96093202719746[/C][/ROW]
[ROW][C]Adjusted R-squared[/C][C]0.95518673707944[/C][/ROW]
[ROW][C]F-TEST (value)[/C][C]167.255614156615[/C][/ROW]
[ROW][C]F-TEST (DF numerator)[/C][C]5[/C][/ROW]
[ROW][C]F-TEST (DF denominator)[/C][C]34[/C][/ROW]
[ROW][C]p-value[/C][C]0[/C][/ROW]
[ROW][C]Multiple Linear Regression - Residual Statistics[/C][/ROW]
[ROW][C]Residual Standard Deviation[/C][C]54.9858190098112[/C][/ROW]
[ROW][C]Sum Squared Residuals[/C][C]102796.969934110[/C][/ROW]
[/TABLE]
Source: https://freestatistics.org/blog/index.php?pk=116333&T=3

Globally Unique Identifier (entire table): ba.freestatistics.org/blog/index.php?pk=116333&T=3

As an alternative you can also use a QR Code:  

The GUIDs for individual cells are displayed in the table below:

Multiple Linear Regression - Regression Statistics
Multiple R0.980271404865744
R-squared0.96093202719746
Adjusted R-squared0.95518673707944
F-TEST (value)167.255614156615
F-TEST (DF numerator)5
F-TEST (DF denominator)34
p-value0
Multiple Linear Regression - Residual Statistics
Residual Standard Deviation54.9858190098112
Sum Squared Residuals102796.969934110


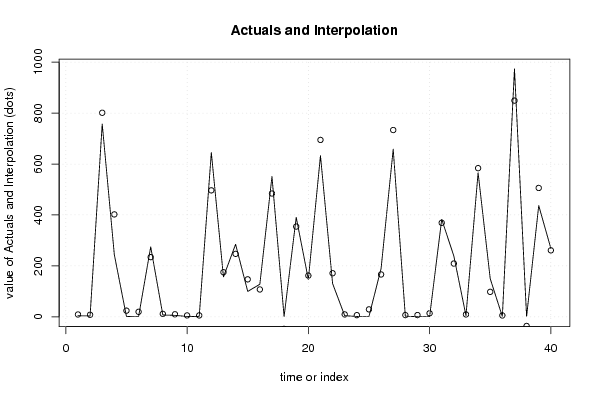
Multiple Linear Regression - Actuals, Interpolation, and Residuals
Time or IndexActualsInterpolationForecastResidualsPrediction Error
14.6079.5601697505981-4.95316975059809
23.6078.36412999715296-4.75712999715296
3757800.996957898815-43.9969578988150
4244402.300589357734-158.300589357734
51.48524.5414429140296-23.0564429140296
61.2119.9699285855832-18.7599285855832
7275234.6310145502840.3689854497198
87.66611.8815426485572-4.21554264855724
96.10110.2746462238380-4.17364622383796
101.5665.852538743348-4.286538743348
111.8665.87856614485098-4.01256614485098
12645496.592213091124148.407786908876
13157175.330749419607-18.3307494196067
14285247.39638164129037.6036183587098
15100147.44394581982-47.44394581982
16128107.77045262167520.2295473783248
17551484.25999919418166.7400008058187
181.303-46.967225286439848.2702252864398
19391354.51856124384736.4814387561525
20147162.08884509349-15.0888450934899
21633694.506696510315-61.5066965103154
22131171.346547031823-40.3465470318231
234.6429.8084465914482-5.16644659144819
241.8046.83592813966201-5.03192813966201
251.9929.5385984873545-27.5485984873545
26190166.54216194814223.4578380518581
27658733.330866178044-75.3308661780438
282.6817.1177244177385-4.43672441773849
291.0387.26629661368272-6.22829661368272
301.0214.2469764838206-13.2269764838206
31383369.23282366424913.7671763357510
32239209.4772396932829.5227603067201
335.3599.71403286126088-4.35503286126088
34566583.728422915375-17.7284229153750
3515098.362771246785451.6372287532146
361.6255.7728264921531-4.1478264921531
37973848.68384571799124.316154282010
381.339-35.514996664951036.8539966649510
39437506.011735303891-69.0117353038909
40269261.2146067145557.78539328544528

\begin{tabular}{lllllllll}
\hline
Multiple Linear Regression - Actuals, Interpolation, and Residuals \tabularnewline
Time or Index & Actuals & InterpolationForecast & ResidualsPrediction Error \tabularnewline
1 & 4.607 & 9.5601697505981 & -4.95316975059809 \tabularnewline
2 & 3.607 & 8.36412999715296 & -4.75712999715296 \tabularnewline
3 & 757 & 800.996957898815 & -43.9969578988150 \tabularnewline
4 & 244 & 402.300589357734 & -158.300589357734 \tabularnewline
5 & 1.485 & 24.5414429140296 & -23.0564429140296 \tabularnewline
6 & 1.21 & 19.9699285855832 & -18.7599285855832 \tabularnewline
7 & 275 & 234.63101455028 & 40.3689854497198 \tabularnewline
8 & 7.666 & 11.8815426485572 & -4.21554264855724 \tabularnewline
9 & 6.101 & 10.2746462238380 & -4.17364622383796 \tabularnewline
10 & 1.566 & 5.852538743348 & -4.286538743348 \tabularnewline
11 & 1.866 & 5.87856614485098 & -4.01256614485098 \tabularnewline
12 & 645 & 496.592213091124 & 148.407786908876 \tabularnewline
13 & 157 & 175.330749419607 & -18.3307494196067 \tabularnewline
14 & 285 & 247.396381641290 & 37.6036183587098 \tabularnewline
15 & 100 & 147.44394581982 & -47.44394581982 \tabularnewline
16 & 128 & 107.770452621675 & 20.2295473783248 \tabularnewline
17 & 551 & 484.259999194181 & 66.7400008058187 \tabularnewline
18 & 1.303 & -46.9672252864398 & 48.2702252864398 \tabularnewline
19 & 391 & 354.518561243847 & 36.4814387561525 \tabularnewline
20 & 147 & 162.08884509349 & -15.0888450934899 \tabularnewline
21 & 633 & 694.506696510315 & -61.5066965103154 \tabularnewline
22 & 131 & 171.346547031823 & -40.3465470318231 \tabularnewline
23 & 4.642 & 9.8084465914482 & -5.16644659144819 \tabularnewline
24 & 1.804 & 6.83592813966201 & -5.03192813966201 \tabularnewline
25 & 1.99 & 29.5385984873545 & -27.5485984873545 \tabularnewline
26 & 190 & 166.542161948142 & 23.4578380518581 \tabularnewline
27 & 658 & 733.330866178044 & -75.3308661780438 \tabularnewline
28 & 2.681 & 7.1177244177385 & -4.43672441773849 \tabularnewline
29 & 1.038 & 7.26629661368272 & -6.22829661368272 \tabularnewline
30 & 1.02 & 14.2469764838206 & -13.2269764838206 \tabularnewline
31 & 383 & 369.232823664249 & 13.7671763357510 \tabularnewline
32 & 239 & 209.47723969328 & 29.5227603067201 \tabularnewline
33 & 5.359 & 9.71403286126088 & -4.35503286126088 \tabularnewline
34 & 566 & 583.728422915375 & -17.7284229153750 \tabularnewline
35 & 150 & 98.3627712467854 & 51.6372287532146 \tabularnewline
36 & 1.625 & 5.7728264921531 & -4.1478264921531 \tabularnewline
37 & 973 & 848.68384571799 & 124.316154282010 \tabularnewline
38 & 1.339 & -35.5149966649510 & 36.8539966649510 \tabularnewline
39 & 437 & 506.011735303891 & -69.0117353038909 \tabularnewline
40 & 269 & 261.214606714555 & 7.78539328544528 \tabularnewline
\hline
\end{tabular}
%Source: https://freestatistics.org/blog/index.php?pk=116333&T=4

[TABLE]
[ROW][C]Multiple Linear Regression - Actuals, Interpolation, and Residuals[/C][/ROW]
[ROW][C]Time or Index[/C][C]Actuals[/C][C]InterpolationForecast[/C][C]ResidualsPrediction Error[/C][/ROW]
[ROW][C]1[/C][C]4.607[/C][C]9.5601697505981[/C][C]-4.95316975059809[/C][/ROW]
[ROW][C]2[/C][C]3.607[/C][C]8.36412999715296[/C][C]-4.75712999715296[/C][/ROW]
[ROW][C]3[/C][C]757[/C][C]800.996957898815[/C][C]-43.9969578988150[/C][/ROW]
[ROW][C]4[/C][C]244[/C][C]402.300589357734[/C][C]-158.300589357734[/C][/ROW]
[ROW][C]5[/C][C]1.485[/C][C]24.5414429140296[/C][C]-23.0564429140296[/C][/ROW]
[ROW][C]6[/C][C]1.21[/C][C]19.9699285855832[/C][C]-18.7599285855832[/C][/ROW]
[ROW][C]7[/C][C]275[/C][C]234.63101455028[/C][C]40.3689854497198[/C][/ROW]
[ROW][C]8[/C][C]7.666[/C][C]11.8815426485572[/C][C]-4.21554264855724[/C][/ROW]
[ROW][C]9[/C][C]6.101[/C][C]10.2746462238380[/C][C]-4.17364622383796[/C][/ROW]
[ROW][C]10[/C][C]1.566[/C][C]5.852538743348[/C][C]-4.286538743348[/C][/ROW]
[ROW][C]11[/C][C]1.866[/C][C]5.87856614485098[/C][C]-4.01256614485098[/C][/ROW]
[ROW][C]12[/C][C]645[/C][C]496.592213091124[/C][C]148.407786908876[/C][/ROW]
[ROW][C]13[/C][C]157[/C][C]175.330749419607[/C][C]-18.3307494196067[/C][/ROW]
[ROW][C]14[/C][C]285[/C][C]247.396381641290[/C][C]37.6036183587098[/C][/ROW]
[ROW][C]15[/C][C]100[/C][C]147.44394581982[/C][C]-47.44394581982[/C][/ROW]
[ROW][C]16[/C][C]128[/C][C]107.770452621675[/C][C]20.2295473783248[/C][/ROW]
[ROW][C]17[/C][C]551[/C][C]484.259999194181[/C][C]66.7400008058187[/C][/ROW]
[ROW][C]18[/C][C]1.303[/C][C]-46.9672252864398[/C][C]48.2702252864398[/C][/ROW]
[ROW][C]19[/C][C]391[/C][C]354.518561243847[/C][C]36.4814387561525[/C][/ROW]
[ROW][C]20[/C][C]147[/C][C]162.08884509349[/C][C]-15.0888450934899[/C][/ROW]
[ROW][C]21[/C][C]633[/C][C]694.506696510315[/C][C]-61.5066965103154[/C][/ROW]
[ROW][C]22[/C][C]131[/C][C]171.346547031823[/C][C]-40.3465470318231[/C][/ROW]
[ROW][C]23[/C][C]4.642[/C][C]9.8084465914482[/C][C]-5.16644659144819[/C][/ROW]
[ROW][C]24[/C][C]1.804[/C][C]6.83592813966201[/C][C]-5.03192813966201[/C][/ROW]
[ROW][C]25[/C][C]1.99[/C][C]29.5385984873545[/C][C]-27.5485984873545[/C][/ROW]
[ROW][C]26[/C][C]190[/C][C]166.542161948142[/C][C]23.4578380518581[/C][/ROW]
[ROW][C]27[/C][C]658[/C][C]733.330866178044[/C][C]-75.3308661780438[/C][/ROW]
[ROW][C]28[/C][C]2.681[/C][C]7.1177244177385[/C][C]-4.43672441773849[/C][/ROW]
[ROW][C]29[/C][C]1.038[/C][C]7.26629661368272[/C][C]-6.22829661368272[/C][/ROW]
[ROW][C]30[/C][C]1.02[/C][C]14.2469764838206[/C][C]-13.2269764838206[/C][/ROW]
[ROW][C]31[/C][C]383[/C][C]369.232823664249[/C][C]13.7671763357510[/C][/ROW]
[ROW][C]32[/C][C]239[/C][C]209.47723969328[/C][C]29.5227603067201[/C][/ROW]
[ROW][C]33[/C][C]5.359[/C][C]9.71403286126088[/C][C]-4.35503286126088[/C][/ROW]
[ROW][C]34[/C][C]566[/C][C]583.728422915375[/C][C]-17.7284229153750[/C][/ROW]
[ROW][C]35[/C][C]150[/C][C]98.3627712467854[/C][C]51.6372287532146[/C][/ROW]
[ROW][C]36[/C][C]1.625[/C][C]5.7728264921531[/C][C]-4.1478264921531[/C][/ROW]
[ROW][C]37[/C][C]973[/C][C]848.68384571799[/C][C]124.316154282010[/C][/ROW]
[ROW][C]38[/C][C]1.339[/C][C]-35.5149966649510[/C][C]36.8539966649510[/C][/ROW]
[ROW][C]39[/C][C]437[/C][C]506.011735303891[/C][C]-69.0117353038909[/C][/ROW]
[ROW][C]40[/C][C]269[/C][C]261.214606714555[/C][C]7.78539328544528[/C][/ROW]
[/TABLE]
Source: https://freestatistics.org/blog/index.php?pk=116333&T=4

Globally Unique Identifier (entire table): ba.freestatistics.org/blog/index.php?pk=116333&T=4

As an alternative you can also use a QR Code:  

The GUIDs for individual cells are displayed in the table below:

Multiple Linear Regression - Actuals, Interpolation, and Residuals
Time or IndexActualsInterpolationForecastResidualsPrediction Error
14.6079.5601697505981-4.95316975059809
23.6078.36412999715296-4.75712999715296
3757800.996957898815-43.9969578988150
4244402.300589357734-158.300589357734
51.48524.5414429140296-23.0564429140296
61.2119.9699285855832-18.7599285855832
7275234.6310145502840.3689854497198
87.66611.8815426485572-4.21554264855724
96.10110.2746462238380-4.17364622383796
101.5665.852538743348-4.286538743348
111.8665.87856614485098-4.01256614485098
12645496.592213091124148.407786908876
13157175.330749419607-18.3307494196067
14285247.39638164129037.6036183587098
15100147.44394581982-47.44394581982
16128107.77045262167520.2295473783248
17551484.25999919418166.7400008058187
181.303-46.967225286439848.2702252864398
19391354.51856124384736.4814387561525
20147162.08884509349-15.0888450934899
21633694.506696510315-61.5066965103154
22131171.346547031823-40.3465470318231
234.6429.8084465914482-5.16644659144819
241.8046.83592813966201-5.03192813966201
251.9929.5385984873545-27.5485984873545
26190166.54216194814223.4578380518581
27658733.330866178044-75.3308661780438
282.6817.1177244177385-4.43672441773849
291.0387.26629661368272-6.22829661368272
301.0214.2469764838206-13.2269764838206
31383369.23282366424913.7671763357510
32239209.4772396932829.5227603067201
335.3599.71403286126088-4.35503286126088
34566583.728422915375-17.7284229153750
3515098.362771246785451.6372287532146
361.6255.7728264921531-4.1478264921531
37973848.68384571799124.316154282010
381.339-35.514996664951036.8539966649510
39437506.011735303891-69.0117353038909
40269261.2146067145557.78539328544528


Goldfeld-Quandt test for Heteroskedasticity
p-valuesAlternative Hypothesis
breakpoint indexgreater2-sidedless
91.06046549054568e-062.12093098109136e-060.99999893953451
101.28043196102449e-082.56086392204898e-080.99999998719568
117.1758188639975e-101.4351637727995e-090.999999999282418
121.01469595734947e-102.02939191469893e-100.99999999989853
130.0007738206905711460.001547641381142290.999226179309429
140.0002308456737258130.0004616913474516260.999769154326274
150.0003140737287965440.0006281474575930880.999685926271203
160.0001061230042250210.0002122460084500420.999893876995775
170.0003193669886770480.0006387339773540950.999680633011323
180.0006012198780588650.001202439756117730.999398780121941
190.04253291184024810.08506582368049610.957467088159752
200.02746601410208970.05493202820417930.97253398589791
210.02362966122713390.04725932245426780.976370338772866
220.03139922686970440.06279845373940890.968600773130296
230.02024214849091680.04048429698183360.979757851509083
240.01417912350779720.02835824701559430.985820876492203
250.008109163524492010.01621832704898400.991890836475508
260.006556702347741370.01311340469548270.993443297652259
270.06140891528258630.1228178305651730.938591084717414
280.039118533568640.078237067137280.96088146643136
290.01877664274266460.03755328548532920.981223357257335
300.007968752689763770.01593750537952750.992031247310236
310.3797204663088840.7594409326177670.620279533691116

\begin{tabular}{lllllllll}
\hline
Goldfeld-Quandt test for Heteroskedasticity \tabularnewline
p-values & Alternative Hypothesis \tabularnewline
breakpoint index & greater & 2-sided & less \tabularnewline
9 & 1.06046549054568e-06 & 2.12093098109136e-06 & 0.99999893953451 \tabularnewline
10 & 1.28043196102449e-08 & 2.56086392204898e-08 & 0.99999998719568 \tabularnewline
11 & 7.1758188639975e-10 & 1.4351637727995e-09 & 0.999999999282418 \tabularnewline
12 & 1.01469595734947e-10 & 2.02939191469893e-10 & 0.99999999989853 \tabularnewline
13 & 0.000773820690571146 & 0.00154764138114229 & 0.999226179309429 \tabularnewline
14 & 0.000230845673725813 & 0.000461691347451626 & 0.999769154326274 \tabularnewline
15 & 0.000314073728796544 & 0.000628147457593088 & 0.999685926271203 \tabularnewline
16 & 0.000106123004225021 & 0.000212246008450042 & 0.999893876995775 \tabularnewline
17 & 0.000319366988677048 & 0.000638733977354095 & 0.999680633011323 \tabularnewline
18 & 0.000601219878058865 & 0.00120243975611773 & 0.999398780121941 \tabularnewline
19 & 0.0425329118402481 & 0.0850658236804961 & 0.957467088159752 \tabularnewline
20 & 0.0274660141020897 & 0.0549320282041793 & 0.97253398589791 \tabularnewline
21 & 0.0236296612271339 & 0.0472593224542678 & 0.976370338772866 \tabularnewline
22 & 0.0313992268697044 & 0.0627984537394089 & 0.968600773130296 \tabularnewline
23 & 0.0202421484909168 & 0.0404842969818336 & 0.979757851509083 \tabularnewline
24 & 0.0141791235077972 & 0.0283582470155943 & 0.985820876492203 \tabularnewline
25 & 0.00810916352449201 & 0.0162183270489840 & 0.991890836475508 \tabularnewline
26 & 0.00655670234774137 & 0.0131134046954827 & 0.993443297652259 \tabularnewline
27 & 0.0614089152825863 & 0.122817830565173 & 0.938591084717414 \tabularnewline
28 & 0.03911853356864 & 0.07823706713728 & 0.96088146643136 \tabularnewline
29 & 0.0187766427426646 & 0.0375532854853292 & 0.981223357257335 \tabularnewline
30 & 0.00796875268976377 & 0.0159375053795275 & 0.992031247310236 \tabularnewline
31 & 0.379720466308884 & 0.759440932617767 & 0.620279533691116 \tabularnewline
\hline
\end{tabular}
%Source: https://freestatistics.org/blog/index.php?pk=116333&T=5

[TABLE]
[ROW][C]Goldfeld-Quandt test for Heteroskedasticity[/C][/ROW]
[ROW][C]p-values[/C][C]Alternative Hypothesis[/C][/ROW]
[ROW][C]breakpoint index[/C][C]greater[/C][C]2-sided[/C][C]less[/C][/ROW]
[ROW][C]9[/C][C]1.06046549054568e-06[/C][C]2.12093098109136e-06[/C][C]0.99999893953451[/C][/ROW]
[ROW][C]10[/C][C]1.28043196102449e-08[/C][C]2.56086392204898e-08[/C][C]0.99999998719568[/C][/ROW]
[ROW][C]11[/C][C]7.1758188639975e-10[/C][C]1.4351637727995e-09[/C][C]0.999999999282418[/C][/ROW]
[ROW][C]12[/C][C]1.01469595734947e-10[/C][C]2.02939191469893e-10[/C][C]0.99999999989853[/C][/ROW]
[ROW][C]13[/C][C]0.000773820690571146[/C][C]0.00154764138114229[/C][C]0.999226179309429[/C][/ROW]
[ROW][C]14[/C][C]0.000230845673725813[/C][C]0.000461691347451626[/C][C]0.999769154326274[/C][/ROW]
[ROW][C]15[/C][C]0.000314073728796544[/C][C]0.000628147457593088[/C][C]0.999685926271203[/C][/ROW]
[ROW][C]16[/C][C]0.000106123004225021[/C][C]0.000212246008450042[/C][C]0.999893876995775[/C][/ROW]
[ROW][C]17[/C][C]0.000319366988677048[/C][C]0.000638733977354095[/C][C]0.999680633011323[/C][/ROW]
[ROW][C]18[/C][C]0.000601219878058865[/C][C]0.00120243975611773[/C][C]0.999398780121941[/C][/ROW]
[ROW][C]19[/C][C]0.0425329118402481[/C][C]0.0850658236804961[/C][C]0.957467088159752[/C][/ROW]
[ROW][C]20[/C][C]0.0274660141020897[/C][C]0.0549320282041793[/C][C]0.97253398589791[/C][/ROW]
[ROW][C]21[/C][C]0.0236296612271339[/C][C]0.0472593224542678[/C][C]0.976370338772866[/C][/ROW]
[ROW][C]22[/C][C]0.0313992268697044[/C][C]0.0627984537394089[/C][C]0.968600773130296[/C][/ROW]
[ROW][C]23[/C][C]0.0202421484909168[/C][C]0.0404842969818336[/C][C]0.979757851509083[/C][/ROW]
[ROW][C]24[/C][C]0.0141791235077972[/C][C]0.0283582470155943[/C][C]0.985820876492203[/C][/ROW]
[ROW][C]25[/C][C]0.00810916352449201[/C][C]0.0162183270489840[/C][C]0.991890836475508[/C][/ROW]
[ROW][C]26[/C][C]0.00655670234774137[/C][C]0.0131134046954827[/C][C]0.993443297652259[/C][/ROW]
[ROW][C]27[/C][C]0.0614089152825863[/C][C]0.122817830565173[/C][C]0.938591084717414[/C][/ROW]
[ROW][C]28[/C][C]0.03911853356864[/C][C]0.07823706713728[/C][C]0.96088146643136[/C][/ROW]
[ROW][C]29[/C][C]0.0187766427426646[/C][C]0.0375532854853292[/C][C]0.981223357257335[/C][/ROW]
[ROW][C]30[/C][C]0.00796875268976377[/C][C]0.0159375053795275[/C][C]0.992031247310236[/C][/ROW]
[ROW][C]31[/C][C]0.379720466308884[/C][C]0.759440932617767[/C][C]0.620279533691116[/C][/ROW]
[/TABLE]
Source: https://freestatistics.org/blog/index.php?pk=116333&T=5

Globally Unique Identifier (entire table): ba.freestatistics.org/blog/index.php?pk=116333&T=5

As an alternative you can also use a QR Code:  

The GUIDs for individual cells are displayed in the table below:

Goldfeld-Quandt test for Heteroskedasticity
p-valuesAlternative Hypothesis
breakpoint indexgreater2-sidedless
91.06046549054568e-062.12093098109136e-060.99999893953451
101.28043196102449e-082.56086392204898e-080.99999998719568
117.1758188639975e-101.4351637727995e-090.999999999282418
121.01469595734947e-102.02939191469893e-100.99999999989853
130.0007738206905711460.001547641381142290.999226179309429
140.0002308456737258130.0004616913474516260.999769154326274
150.0003140737287965440.0006281474575930880.999685926271203
160.0001061230042250210.0002122460084500420.999893876995775
170.0003193669886770480.0006387339773540950.999680633011323
180.0006012198780588650.001202439756117730.999398780121941
190.04253291184024810.08506582368049610.957467088159752
200.02746601410208970.05493202820417930.97253398589791
210.02362966122713390.04725932245426780.976370338772866
220.03139922686970440.06279845373940890.968600773130296
230.02024214849091680.04048429698183360.979757851509083
240.01417912350779720.02835824701559430.985820876492203
250.008109163524492010.01621832704898400.991890836475508
260.006556702347741370.01311340469548270.993443297652259
270.06140891528258630.1228178305651730.938591084717414
280.039118533568640.078237067137280.96088146643136
290.01877664274266460.03755328548532920.981223357257335
300.007968752689763770.01593750537952750.992031247310236
310.3797204663088840.7594409326177670.620279533691116


Meta Analysis of Goldfeld-Quandt test for Heteroskedasticity
Description# significant tests% significant testsOK/NOK
1% type I error level100.434782608695652NOK
5% type I error level170.739130434782609NOK
10% type I error level210.91304347826087NOK

\begin{tabular}{lllllllll}
\hline
Meta Analysis of Goldfeld-Quandt test for Heteroskedasticity \tabularnewline
Description & # significant tests & % significant tests & OK/NOK \tabularnewline
1% type I error level & 10 & 0.434782608695652 & NOK \tabularnewline
5% type I error level & 17 & 0.739130434782609 & NOK \tabularnewline
10% type I error level & 21 & 0.91304347826087 & NOK \tabularnewline
\hline
\end{tabular}
%Source: https://freestatistics.org/blog/index.php?pk=116333&T=6

[TABLE]
[ROW][C]Meta Analysis of Goldfeld-Quandt test for Heteroskedasticity[/C][/ROW]
[ROW][C]Description[/C][C]# significant tests[/C][C]% significant tests[/C][C]OK/NOK[/C][/ROW]
[ROW][C]1% type I error level[/C][C]10[/C][C]0.434782608695652[/C][C]NOK[/C][/ROW]
[ROW][C]5% type I error level[/C][C]17[/C][C]0.739130434782609[/C][C]NOK[/C][/ROW]
[ROW][C]10% type I error level[/C][C]21[/C][C]0.91304347826087[/C][C]NOK[/C][/ROW]
[/TABLE]
Source: https://freestatistics.org/blog/index.php?pk=116333&T=6

Globally Unique Identifier (entire table): ba.freestatistics.org/blog/index.php?pk=116333&T=6

As an alternative you can also use a QR Code:  

The GUIDs for individual cells are displayed in the table below:

Meta Analysis of Goldfeld-Quandt test for Heteroskedasticity
Description# significant tests% significant testsOK/NOK
1% type I error level100.434782608695652NOK
5% type I error level170.739130434782609NOK
10% type I error level210.91304347826087NOK


Parameters (Session):
par1 = 1 ; par2 = Do not include Seasonal Dummies ; par3 = No Linear Trend ;
Parameters (R input):
par1 = 1 ; par2 = Do not include Seasonal Dummies ; par3 = No Linear Trend ;
R code (references can be found in the software module):
library(lattice)
library(lmtest)
n25 <- 25 #minimum number of obs. for Goldfeld-Quandt test
par1 <- as.numeric(par1)
x <- t(y)
k <- length(x[1,])
n <- length(x[,1])
x1 <- cbind(x[,par1], x[,1:k!=par1])
mycolnames <- c(colnames(x)[par1], colnames(x)[1:k!=par1])
colnames(x1) <- mycolnames #colnames(x)[par1]
x <- x1
if (par3 == 'First Differences'){
x2 <- array(0, dim=c(n-1,k), dimnames=list(1:(n-1), paste('(1-B)',colnames(x),sep='')))
for (i in 1:n-1) {
for (j in 1:k) {
x2[i,j] <- x[i+1,j] - x[i,j]
}
}
x <- x2
}
if (par2 == 'Include Monthly Dummies'){
x2 <- array(0, dim=c(n,11), dimnames=list(1:n, paste('M', seq(1:11), sep ='')))
for (i in 1:11){
x2[seq(i,n,12),i] <- 1
}
x <- cbind(x, x2)
}
if (par2 == 'Include Quarterly Dummies'){
x2 <- array(0, dim=c(n,3), dimnames=list(1:n, paste('Q', seq(1:3), sep ='')))
for (i in 1:3){
x2[seq(i,n,4),i] <- 1
}
x <- cbind(x, x2)
}
k <- length(x[1,])
if (par3 == 'Linear Trend'){
x <- cbind(x, c(1:n))
colnames(x)[k+1] <- 't'
}
x
k <- length(x[1,])
df <- as.data.frame(x)
(mylm <- lm(df))
(mysum <- summary(mylm))
if (n > n25) {
kp3 <- k + 3
nmkm3 <- n - k - 3
gqarr <- array(NA, dim=c(nmkm3-kp3+1,3))
numgqtests <- 0
numsignificant1 <- 0
numsignificant5 <- 0
numsignificant10 <- 0
for (mypoint in kp3:nmkm3) {
j <- 0
numgqtests <- numgqtests + 1
for (myalt in c('greater', 'two.sided', 'less')) {
j <- j + 1
gqarr[mypoint-kp3+1,j] <- gqtest(mylm, point=mypoint, alternative=myalt)$p.value
}
if (gqarr[mypoint-kp3+1,2] < 0.01) numsignificant1 <- numsignificant1 + 1
if (gqarr[mypoint-kp3+1,2] < 0.05) numsignificant5 <- numsignificant5 + 1
if (gqarr[mypoint-kp3+1,2] < 0.10) numsignificant10 <- numsignificant10 + 1
}
gqarr
}
bitmap(file='test0.png')
plot(x[,1], type='l', main='Actuals and Interpolation', ylab='value of Actuals and Interpolation (dots)', xlab='time or index')
points(x[,1]-mysum$resid)
grid()
dev.off()
bitmap(file='test1.png')
plot(mysum$resid, type='b', pch=19, main='Residuals', ylab='value of Residuals', xlab='time or index')
grid()
dev.off()
bitmap(file='test2.png')
hist(mysum$resid, main='Residual Histogram', xlab='values of Residuals')
grid()
dev.off()
bitmap(file='test3.png')
densityplot(~mysum$resid,col='black',main='Residual Density Plot', xlab='values of Residuals')
dev.off()
bitmap(file='test4.png')
qqnorm(mysum$resid, main='Residual Normal Q-Q Plot')
qqline(mysum$resid)
grid()
dev.off()
(myerror <- as.ts(mysum$resid))
bitmap(file='test5.png')
dum <- cbind(lag(myerror,k=1),myerror)
dum
dum1 <- dum[2:length(myerror),]
dum1
z <- as.data.frame(dum1)
z
plot(z,main=paste('Residual Lag plot, lowess, and regression line'), ylab='values of Residuals', xlab='lagged values of Residuals')
lines(lowess(z))
abline(lm(z))
grid()
dev.off()
bitmap(file='test6.png')
acf(mysum$resid, lag.max=length(mysum$resid)/2, main='Residual Autocorrelation Function')
grid()
dev.off()
bitmap(file='test7.png')
pacf(mysum$resid, lag.max=length(mysum$resid)/2, main='Residual Partial Autocorrelation Function')
grid()
dev.off()
bitmap(file='test8.png')
opar <- par(mfrow = c(2,2), oma = c(0, 0, 1.1, 0))
plot(mylm, las = 1, sub='Residual Diagnostics')
par(opar)
dev.off()
if (n > n25) {
bitmap(file='test9.png')
plot(kp3:nmkm3,gqarr[,2], main='Goldfeld-Quandt test',ylab='2-sided p-value',xlab='breakpoint')
grid()
dev.off()
}
load(file='createtable')
a<-table.start()
a<-table.row.start(a)
a<-table.element(a, 'Multiple Linear Regression - Estimated Regression Equation', 1, TRUE)
a<-table.row.end(a)
myeq <- colnames(x)[1]
myeq <- paste(myeq, '[t] = ', sep='')
for (i in 1:k){
if (mysum$coefficients[i,1] > 0) myeq <- paste(myeq, '+', '')
myeq <- paste(myeq, mysum$coefficients[i,1], sep=' ')
if (rownames(mysum$coefficients)[i] != '(Intercept)') {
myeq <- paste(myeq, rownames(mysum$coefficients)[i], sep='')
if (rownames(mysum$coefficients)[i] != 't') myeq <- paste(myeq, '[t]', sep='')
}
}
myeq <- paste(myeq, ' + e[t]')
a<-table.row.start(a)
a<-table.element(a, myeq)
a<-table.row.end(a)
a<-table.end(a)
table.save(a,file='mytable1.tab')
a<-table.start()
a<-table.row.start(a)
a<-table.element(a,hyperlink('ols1.htm','Multiple Linear Regression - Ordinary Least Squares',''), 6, TRUE)
a<-table.row.end(a)
a<-table.row.start(a)
a<-table.element(a,'Variable',header=TRUE)
a<-table.element(a,'Parameter',header=TRUE)
a<-table.element(a,'S.D.',header=TRUE)
a<-table.element(a,'T-STAT
H0: parameter = 0',header=TRUE)
a<-table.element(a,'2-tail p-value',header=TRUE)
a<-table.element(a,'1-tail p-value',header=TRUE)
a<-table.row.end(a)
for (i in 1:k){
a<-table.row.start(a)
a<-table.element(a,rownames(mysum$coefficients)[i],header=TRUE)
a<-table.element(a,mysum$coefficients[i,1])
a<-table.element(a, round(mysum$coefficients[i,2],6))
a<-table.element(a, round(mysum$coefficients[i,3],4))
a<-table.element(a, round(mysum$coefficients[i,4],6))
a<-table.element(a, round(mysum$coefficients[i,4]/2,6))
a<-table.row.end(a)
}
a<-table.end(a)
table.save(a,file='mytable2.tab')
a<-table.start()
a<-table.row.start(a)
a<-table.element(a, 'Multiple Linear Regression - Regression Statistics', 2, TRUE)
a<-table.row.end(a)
a<-table.row.start(a)
a<-table.element(a, 'Multiple R',1,TRUE)
a<-table.element(a, sqrt(mysum$r.squared))
a<-table.row.end(a)
a<-table.row.start(a)
a<-table.element(a, 'R-squared',1,TRUE)
a<-table.element(a, mysum$r.squared)
a<-table.row.end(a)
a<-table.row.start(a)
a<-table.element(a, 'Adjusted R-squared',1,TRUE)
a<-table.element(a, mysum$adj.r.squared)
a<-table.row.end(a)
a<-table.row.start(a)
a<-table.element(a, 'F-TEST (value)',1,TRUE)
a<-table.element(a, mysum$fstatistic[1])
a<-table.row.end(a)
a<-table.row.start(a)
a<-table.element(a, 'F-TEST (DF numerator)',1,TRUE)
a<-table.element(a, mysum$fstatistic[2])
a<-table.row.end(a)
a<-table.row.start(a)
a<-table.element(a, 'F-TEST (DF denominator)',1,TRUE)
a<-table.element(a, mysum$fstatistic[3])
a<-table.row.end(a)
a<-table.row.start(a)
a<-table.element(a, 'p-value',1,TRUE)
a<-table.element(a, 1-pf(mysum$fstatistic[1],mysum$fstatistic[2],mysum$fstatistic[3]))
a<-table.row.end(a)
a<-table.row.start(a)
a<-table.element(a, 'Multiple Linear Regression - Residual Statistics', 2, TRUE)
a<-table.row.end(a)
a<-table.row.start(a)
a<-table.element(a, 'Residual Standard Deviation',1,TRUE)
a<-table.element(a, mysum$sigma)
a<-table.row.end(a)
a<-table.row.start(a)
a<-table.element(a, 'Sum Squared Residuals',1,TRUE)
a<-table.element(a, sum(myerror*myerror))
a<-table.row.end(a)
a<-table.end(a)
table.save(a,file='mytable3.tab')
a<-table.start()
a<-table.row.start(a)
a<-table.element(a, 'Multiple Linear Regression - Actuals, Interpolation, and Residuals', 4, TRUE)
a<-table.row.end(a)
a<-table.row.start(a)
a<-table.element(a, 'Time or Index', 1, TRUE)
a<-table.element(a, 'Actuals', 1, TRUE)
a<-table.element(a, 'Interpolation
Forecast', 1, TRUE)
a<-table.element(a, 'Residuals
Prediction Error', 1, TRUE)
a<-table.row.end(a)
for (i in 1:n) {
a<-table.row.start(a)
a<-table.element(a,i, 1, TRUE)
a<-table.element(a,x[i])
a<-table.element(a,x[i]-mysum$resid[i])
a<-table.element(a,mysum$resid[i])
a<-table.row.end(a)
}
a<-table.end(a)
table.save(a,file='mytable4.tab')
if (n > n25) {
a<-table.start()
a<-table.row.start(a)
a<-table.element(a,'Goldfeld-Quandt test for Heteroskedasticity',4,TRUE)
a<-table.row.end(a)
a<-table.row.start(a)
a<-table.element(a,'p-values',header=TRUE)
a<-table.element(a,'Alternative Hypothesis',3,header=TRUE)
a<-table.row.end(a)
a<-table.row.start(a)
a<-table.element(a,'breakpoint index',header=TRUE)
a<-table.element(a,'greater',header=TRUE)
a<-table.element(a,'2-sided',header=TRUE)
a<-table.element(a,'less',header=TRUE)
a<-table.row.end(a)
for (mypoint in kp3:nmkm3) {
a<-table.row.start(a)
a<-table.element(a,mypoint,header=TRUE)
a<-table.element(a,gqarr[mypoint-kp3+1,1])
a<-table.element(a,gqarr[mypoint-kp3+1,2])
a<-table.element(a,gqarr[mypoint-kp3+1,3])
a<-table.row.end(a)
}
a<-table.end(a)
table.save(a,file='mytable5.tab')
a<-table.start()
a<-table.row.start(a)
a<-table.element(a,'Meta Analysis of Goldfeld-Quandt test for Heteroskedasticity',4,TRUE)
a<-table.row.end(a)
a<-table.row.start(a)
a<-table.element(a,'Description',header=TRUE)
a<-table.element(a,'# significant tests',header=TRUE)
a<-table.element(a,'% significant tests',header=TRUE)
a<-table.element(a,'OK/NOK',header=TRUE)
a<-table.row.end(a)
a<-table.row.start(a)
a<-table.element(a,'1% type I error level',header=TRUE)
a<-table.element(a,numsignificant1)
a<-table.element(a,numsignificant1/numgqtests)
if (numsignificant1/numgqtests < 0.01) dum <- 'OK' else dum <- 'NOK'
a<-table.element(a,dum)
a<-table.row.end(a)
a<-table.row.start(a)
a<-table.element(a,'5% type I error level',header=TRUE)
a<-table.element(a,numsignificant5)
a<-table.element(a,numsignificant5/numgqtests)
if (numsignificant5/numgqtests < 0.05) dum <- 'OK' else dum <- 'NOK'
a<-table.element(a,dum)
a<-table.row.end(a)
a<-table.row.start(a)
a<-table.element(a,'10% type I error level',header=TRUE)
a<-table.element(a,numsignificant10)
a<-table.element(a,numsignificant10/numgqtests)
if (numsignificant10/numgqtests < 0.1) dum <- 'OK' else dum <- 'NOK'
a<-table.element(a,dum)
a<-table.row.end(a)
a<-table.end(a)
table.save(a,file='mytable6.tab')
}