| Multiple Linear Regression - Estimated Regression Equation |
| IndVertr[t] = -2.70086291822297 -0.224608973717344WerklHd[t] + e[t] |
| Multiple Linear Regression - Ordinary Least Squares | |||||
| Variable | Parameter | S.D. | T-STAT H0: parameter = 0 | 2-tail p-value | 1-tail p-value |
| (Intercept) | -2.70086291822297 | 1.375959 | -1.9629 | 0.057882 | 0.028941 |
| WerklHd | -0.224608973717344 | 0.028755 | -7.8111 | 0 | 0 |
| Multiple Linear Regression - Regression Statistics | |
| Multiple R | 0.80134653483524 |
| R-squared | 0.642156268892446 |
| Adjusted R-squared | 0.631631453271636 |
| F-TEST (value) | 61.0135409519888 |
| F-TEST (DF numerator) | 1 |
| F-TEST (DF denominator) | 34 |
| p-value | 4.31997659866568e-09 |
| Multiple Linear Regression - Residual Statistics | |
| Residual Standard Deviation | 4.17604204093941 |
| Sum Squared Residuals | 592.937122341575 |
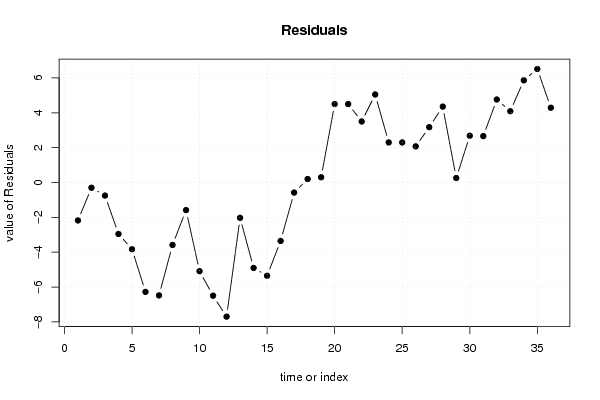
| Multiple Linear Regression - Actuals, Interpolation, and Residuals | |||
| Time or Index | Actuals | Interpolation Forecast | Residuals Prediction Error |
| 1 | -6 | -3.82390778680966 | -2.17609221319034 |
| 2 | -3 | -2.70086291822294 | -0.299137081777056 |
| 3 | -3 | -2.25164497078827 | -0.748355029211727 |
| 4 | -7 | -4.04851676052703 | -2.95148323947297 |
| 5 | -9 | -5.17156162911375 | -3.82843837088625 |
| 6 | -11 | -4.72234368167906 | -6.27765631832094 |
| 7 | -13 | -6.51921547141781 | -6.48078452858219 |
| 8 | -11 | -7.41765136628719 | -3.58234863371281 |
| 9 | -9 | -7.41765136628719 | -1.58234863371281 |
| 10 | -17 | -11.9098308406341 | -5.09016915936593 |
| 11 | -22 | -15.5035744201116 | -6.49642557988842 |
| 12 | -25 | -17.3004462098503 | -7.69955379014967 |
| 13 | -20 | -17.9742731310024 | -2.02572686899763 |
| 14 | -24 | -19.0973179995891 | -4.90268200041091 |
| 15 | -24 | -18.6481000521544 | -5.3518999478456 |
| 16 | -22 | -18.6481000521544 | -3.3518999478456 |
| 17 | -19 | -18.4234910784371 | -0.576508921562947 |
| 18 | -18 | -18.1988821047197 | 0.198882104719709 |
| 19 | -17 | -17.3004462098503 | 0.300446209850332 |
| 20 | -11 | -15.5035744201116 | 4.50357442011158 |
| 21 | -11 | -15.5035744201116 | 4.50357442011158 |
| 22 | -12 | -15.5035744201116 | 3.50357442011158 |
| 23 | -10 | -15.0543564726769 | 5.05435647267689 |
| 24 | -15 | -17.3004462098503 | 2.30044620985033 |
| 25 | -15 | -17.3004462098503 | 2.30044620985033 |
| 26 | -15 | -17.075837236133 | 2.07583723613299 |
| 27 | -13 | -16.1774013412636 | 3.17740134126361 |
| 28 | -8 | -12.3590487880688 | 4.35904878806876 |
| 29 | -13 | -13.2574846829381 | 0.257484682938137 |
| 30 | -9 | -11.6852218669167 | 2.68522186691673 |
| 31 | -7 | -9.66374110346063 | 2.66374110346063 |
| 32 | -4 | -8.76530520859125 | 4.76530520859125 |
| 33 | -4 | -8.09147828743922 | 4.09147828743922 |
| 34 | -2 | -7.86686931372188 | 5.86686931372188 |
| 35 | 0 | -6.51921547141781 | 6.51921547141781 |
| 36 | -2 | -6.29460649770047 | 4.29460649770047 |
| Goldfeld-Quandt test for Heteroskedasticity | |||
| p-values | Alternative Hypothesis | ||
| breakpoint index | greater | 2-sided | less |
| 5 | 0.00191941240473423 | 0.00383882480946847 | 0.998080587595266 |
| 6 | 0.0171614849957542 | 0.0343229699915083 | 0.982838515004246 |
| 7 | 0.00767269867552172 | 0.0153453973510434 | 0.992327301324478 |
| 8 | 0.0353673339348169 | 0.0707346678696337 | 0.964632666065183 |
| 9 | 0.0835845454471541 | 0.167169090894308 | 0.916415454552846 |
| 10 | 0.0870682517838263 | 0.174136503567653 | 0.912931748216174 |
| 11 | 0.0969473272417554 | 0.193894654483511 | 0.903052672758245 |
| 12 | 0.167471299632501 | 0.334942599265002 | 0.8325287003675 |
| 13 | 0.400405003549126 | 0.800810007098252 | 0.599594996450874 |
| 14 | 0.455505493092256 | 0.911010986184511 | 0.544494506907744 |
| 15 | 0.684170997461282 | 0.631658005077436 | 0.315829002538718 |
| 16 | 0.873828221885988 | 0.252343556228024 | 0.126171778114012 |
| 17 | 0.952179141131793 | 0.0956417177364135 | 0.0478208588682068 |
| 18 | 0.978151413696931 | 0.0436971726061383 | 0.0218485863030691 |
| 19 | 0.990135183475238 | 0.0197296330495241 | 0.00986481652476204 |
| 20 | 0.998118419037303 | 0.00376316192539409 | 0.00188158096269704 |
| 21 | 0.99926332762967 | 0.00147334474066164 | 0.000736672370330822 |
| 22 | 0.999097836517883 | 0.00180432696423461 | 0.000902163482117303 |
| 23 | 0.999687560478913 | 0.000624879042173455 | 0.000312439521086727 |
| 24 | 0.999227100655416 | 0.00154579868916825 | 0.000772899344584125 |
| 25 | 0.998137804202174 | 0.00372439159565151 | 0.00186219579782576 |
| 26 | 0.995387020138638 | 0.00922595972272382 | 0.00461297986136191 |
| 27 | 0.9956162343936 | 0.00876753121279846 | 0.00438376560639923 |
| 28 | 0.998172740961498 | 0.00365451807700337 | 0.00182725903850168 |
| 29 | 0.994733847216718 | 0.0105323055665645 | 0.00526615278328223 |
| 30 | 0.981964977069507 | 0.0360700458609865 | 0.0180350229304932 |
| 31 | 0.96256596536652 | 0.0748680692669582 | 0.0374340346334791 |
| Meta Analysis of Goldfeld-Quandt test for Heteroskedasticity | |||
| Description | # significant tests | % significant tests | OK/NOK |
| 1% type I error level | 10 | 0.370370370370370 | NOK |
| 5% type I error level | 16 | 0.592592592592593 | NOK |
| 10% type I error level | 19 | 0.703703703703704 | NOK |