Free Statistics

of Irreproducible Research!

Author's title

Author*The author of this computation has been verified*
R Software Modulerwasp_autocorrelation.wasp
Title produced by software(Partial) Autocorrelation Function
Date of computationTue, 28 Dec 2010 08:52:21 +0000
Cite this page as followsStatistical Computations at FreeStatistics.org, Office for Research Development and Education, URL https://freestatistics.org/blog/index.php?v=date/2010/Dec/28/t12935262135swnhp3m9srw86e.htm/, Retrieved Sun, 05 May 2024 06:06:41 +0000
Statistical Computations at FreeStatistics.org, Office for Research Development and Education, URL https://freestatistics.org/blog/index.php?pk=116227, Retrieved Sun, 05 May 2024 06:06:41 +0000
QR Codes:

Original text written by user:
IsPrivate?No (this computation is public)
User-defined keywords
Estimated Impact133
Family? (F = Feedback message, R = changed R code, M = changed R Module, P = changed Parameters, D = changed Data)
-       [(Partial) Autocorrelation Function] [] [2010-12-28 08:52:21] [1bb61589b71a2dccde96f07234cd79aa] [Current]
Feedback Forum

Post a new message
Dataseries X:
46.194
36.943
45.062
35.062
47.177
38.064
47.663
35.483
46.228
36.255
45.134
33.472
44.720
35.487
41.753
33.142
41.744
33.462
42.743
31.518
39.946
31.647
39.603
31.372
42.638
29.654
38.626
29.534
36.721
30.310
37.285
28.979
35.801
28.451
36.125
28.141
34.333
27.082
34.356
27.975
33.537
26.218
33.191
25.219
32.272
24.838
31.723
24.753
30.393
24.346
30.192
23.387
28.385
23.000
28.581
22.512


Summary of computational transaction
Raw Inputview raw input (R code)
Raw Outputview raw output of R engine
Computing time3 seconds
R Server'George Udny Yule' @ 72.249.76.132

\begin{tabular}{lllllllll}
\hline
Summary of computational transaction \tabularnewline
Raw Input & view raw input (R code)  \tabularnewline
Raw Output & view raw output of R engine  \tabularnewline
Computing time & 3 seconds \tabularnewline
R Server & 'George Udny Yule' @ 72.249.76.132 \tabularnewline
\hline
\end{tabular}
%Source: https://freestatistics.org/blog/index.php?pk=116227&T=0

[TABLE]
[ROW][C]Summary of computational transaction[/C][/ROW]
[ROW][C]Raw Input[/C][C]view raw input (R code) [/C][/ROW]
[ROW][C]Raw Output[/C][C]view raw output of R engine [/C][/ROW]
[ROW][C]Computing time[/C][C]3 seconds[/C][/ROW]
[ROW][C]R Server[/C][C]'George Udny Yule' @ 72.249.76.132[/C][/ROW]
[/TABLE]
Source: https://freestatistics.org/blog/index.php?pk=116227&T=0

Globally Unique Identifier (entire table): ba.freestatistics.org/blog/index.php?pk=116227&T=0

As an alternative you can also use a QR Code:  

The GUIDs for individual cells are displayed in the table below:

Summary of computational transaction
Raw Inputview raw input (R code)
Raw Outputview raw output of R engine
Computing time3 seconds
R Server'George Udny Yule' @ 72.249.76.132


Autocorrelation Function
Time lag kACF(k)T-STATP-value
10.0996920.71890.237714
20.0543480.39190.348364
30.0088720.0640.474617
4-0.409445-2.95260.00236
50.0707860.51040.305951
60.1849671.33380.094038
7-0.112717-0.81280.210014
8-0.027142-0.19570.422794
9-0.058572-0.42240.337249
10-0.225243-1.62430.055185
110.1082880.78090.219208
120.0365530.26360.396569
13-0.104261-0.75180.22777
140.0081410.05870.476705
15-0.067909-0.48970.313203
160.0175110.12630.450002
170.0879050.63390.264464
180.1907611.37560.087422
19-0.023117-0.16670.434127
200.0420360.30310.381503
21-0.110119-0.79410.215378
22-0.150125-1.08260.141998
23-0.024853-0.17920.429231
24-0.013321-0.09610.461922
250.0150290.10840.457057
260.0569380.41060.341533
27-0.007758-0.05590.4778
28-0.052525-0.37880.353204
290.028470.20530.41907
30-0.048251-0.34790.364643
310.012580.09070.464033
320.02470.17810.429662
330.0153270.11050.456209
340.0591450.42650.335752
350.0279940.20190.420404
360.0064750.04670.481469
37-0.049862-0.35960.360317
38-0.021419-0.15450.438925
39-0.056847-0.40990.341771
400.0080570.05810.476946
410.0096830.06980.472301
420.0096840.06980.472298
430.0286570.20660.418545
44-0.013718-0.09890.460791
45-0.01603-0.11560.454211
46-0.049534-0.35720.361195
47-0.036461-0.26290.396825
48-0.034055-0.24560.403488

\begin{tabular}{lllllllll}
\hline
Autocorrelation Function \tabularnewline
Time lag k & ACF(k) & T-STAT & P-value \tabularnewline
1 & 0.099692 & 0.7189 & 0.237714 \tabularnewline
2 & 0.054348 & 0.3919 & 0.348364 \tabularnewline
3 & 0.008872 & 0.064 & 0.474617 \tabularnewline
4 & -0.409445 & -2.9526 & 0.00236 \tabularnewline
5 & 0.070786 & 0.5104 & 0.305951 \tabularnewline
6 & 0.184967 & 1.3338 & 0.094038 \tabularnewline
7 & -0.112717 & -0.8128 & 0.210014 \tabularnewline
8 & -0.027142 & -0.1957 & 0.422794 \tabularnewline
9 & -0.058572 & -0.4224 & 0.337249 \tabularnewline
10 & -0.225243 & -1.6243 & 0.055185 \tabularnewline
11 & 0.108288 & 0.7809 & 0.219208 \tabularnewline
12 & 0.036553 & 0.2636 & 0.396569 \tabularnewline
13 & -0.104261 & -0.7518 & 0.22777 \tabularnewline
14 & 0.008141 & 0.0587 & 0.476705 \tabularnewline
15 & -0.067909 & -0.4897 & 0.313203 \tabularnewline
16 & 0.017511 & 0.1263 & 0.450002 \tabularnewline
17 & 0.087905 & 0.6339 & 0.264464 \tabularnewline
18 & 0.190761 & 1.3756 & 0.087422 \tabularnewline
19 & -0.023117 & -0.1667 & 0.434127 \tabularnewline
20 & 0.042036 & 0.3031 & 0.381503 \tabularnewline
21 & -0.110119 & -0.7941 & 0.215378 \tabularnewline
22 & -0.150125 & -1.0826 & 0.141998 \tabularnewline
23 & -0.024853 & -0.1792 & 0.429231 \tabularnewline
24 & -0.013321 & -0.0961 & 0.461922 \tabularnewline
25 & 0.015029 & 0.1084 & 0.457057 \tabularnewline
26 & 0.056938 & 0.4106 & 0.341533 \tabularnewline
27 & -0.007758 & -0.0559 & 0.4778 \tabularnewline
28 & -0.052525 & -0.3788 & 0.353204 \tabularnewline
29 & 0.02847 & 0.2053 & 0.41907 \tabularnewline
30 & -0.048251 & -0.3479 & 0.364643 \tabularnewline
31 & 0.01258 & 0.0907 & 0.464033 \tabularnewline
32 & 0.0247 & 0.1781 & 0.429662 \tabularnewline
33 & 0.015327 & 0.1105 & 0.456209 \tabularnewline
34 & 0.059145 & 0.4265 & 0.335752 \tabularnewline
35 & 0.027994 & 0.2019 & 0.420404 \tabularnewline
36 & 0.006475 & 0.0467 & 0.481469 \tabularnewline
37 & -0.049862 & -0.3596 & 0.360317 \tabularnewline
38 & -0.021419 & -0.1545 & 0.438925 \tabularnewline
39 & -0.056847 & -0.4099 & 0.341771 \tabularnewline
40 & 0.008057 & 0.0581 & 0.476946 \tabularnewline
41 & 0.009683 & 0.0698 & 0.472301 \tabularnewline
42 & 0.009684 & 0.0698 & 0.472298 \tabularnewline
43 & 0.028657 & 0.2066 & 0.418545 \tabularnewline
44 & -0.013718 & -0.0989 & 0.460791 \tabularnewline
45 & -0.01603 & -0.1156 & 0.454211 \tabularnewline
46 & -0.049534 & -0.3572 & 0.361195 \tabularnewline
47 & -0.036461 & -0.2629 & 0.396825 \tabularnewline
48 & -0.034055 & -0.2456 & 0.403488 \tabularnewline
\hline
\end{tabular}
%Source: https://freestatistics.org/blog/index.php?pk=116227&T=1

[TABLE]
[ROW][C]Autocorrelation Function[/C][/ROW]
[ROW][C]Time lag k[/C][C]ACF(k)[/C][C]T-STAT[/C][C]P-value[/C][/ROW]
[ROW][C]1[/C][C]0.099692[/C][C]0.7189[/C][C]0.237714[/C][/ROW]
[ROW][C]2[/C][C]0.054348[/C][C]0.3919[/C][C]0.348364[/C][/ROW]
[ROW][C]3[/C][C]0.008872[/C][C]0.064[/C][C]0.474617[/C][/ROW]
[ROW][C]4[/C][C]-0.409445[/C][C]-2.9526[/C][C]0.00236[/C][/ROW]
[ROW][C]5[/C][C]0.070786[/C][C]0.5104[/C][C]0.305951[/C][/ROW]
[ROW][C]6[/C][C]0.184967[/C][C]1.3338[/C][C]0.094038[/C][/ROW]
[ROW][C]7[/C][C]-0.112717[/C][C]-0.8128[/C][C]0.210014[/C][/ROW]
[ROW][C]8[/C][C]-0.027142[/C][C]-0.1957[/C][C]0.422794[/C][/ROW]
[ROW][C]9[/C][C]-0.058572[/C][C]-0.4224[/C][C]0.337249[/C][/ROW]
[ROW][C]10[/C][C]-0.225243[/C][C]-1.6243[/C][C]0.055185[/C][/ROW]
[ROW][C]11[/C][C]0.108288[/C][C]0.7809[/C][C]0.219208[/C][/ROW]
[ROW][C]12[/C][C]0.036553[/C][C]0.2636[/C][C]0.396569[/C][/ROW]
[ROW][C]13[/C][C]-0.104261[/C][C]-0.7518[/C][C]0.22777[/C][/ROW]
[ROW][C]14[/C][C]0.008141[/C][C]0.0587[/C][C]0.476705[/C][/ROW]
[ROW][C]15[/C][C]-0.067909[/C][C]-0.4897[/C][C]0.313203[/C][/ROW]
[ROW][C]16[/C][C]0.017511[/C][C]0.1263[/C][C]0.450002[/C][/ROW]
[ROW][C]17[/C][C]0.087905[/C][C]0.6339[/C][C]0.264464[/C][/ROW]
[ROW][C]18[/C][C]0.190761[/C][C]1.3756[/C][C]0.087422[/C][/ROW]
[ROW][C]19[/C][C]-0.023117[/C][C]-0.1667[/C][C]0.434127[/C][/ROW]
[ROW][C]20[/C][C]0.042036[/C][C]0.3031[/C][C]0.381503[/C][/ROW]
[ROW][C]21[/C][C]-0.110119[/C][C]-0.7941[/C][C]0.215378[/C][/ROW]
[ROW][C]22[/C][C]-0.150125[/C][C]-1.0826[/C][C]0.141998[/C][/ROW]
[ROW][C]23[/C][C]-0.024853[/C][C]-0.1792[/C][C]0.429231[/C][/ROW]
[ROW][C]24[/C][C]-0.013321[/C][C]-0.0961[/C][C]0.461922[/C][/ROW]
[ROW][C]25[/C][C]0.015029[/C][C]0.1084[/C][C]0.457057[/C][/ROW]
[ROW][C]26[/C][C]0.056938[/C][C]0.4106[/C][C]0.341533[/C][/ROW]
[ROW][C]27[/C][C]-0.007758[/C][C]-0.0559[/C][C]0.4778[/C][/ROW]
[ROW][C]28[/C][C]-0.052525[/C][C]-0.3788[/C][C]0.353204[/C][/ROW]
[ROW][C]29[/C][C]0.02847[/C][C]0.2053[/C][C]0.41907[/C][/ROW]
[ROW][C]30[/C][C]-0.048251[/C][C]-0.3479[/C][C]0.364643[/C][/ROW]
[ROW][C]31[/C][C]0.01258[/C][C]0.0907[/C][C]0.464033[/C][/ROW]
[ROW][C]32[/C][C]0.0247[/C][C]0.1781[/C][C]0.429662[/C][/ROW]
[ROW][C]33[/C][C]0.015327[/C][C]0.1105[/C][C]0.456209[/C][/ROW]
[ROW][C]34[/C][C]0.059145[/C][C]0.4265[/C][C]0.335752[/C][/ROW]
[ROW][C]35[/C][C]0.027994[/C][C]0.2019[/C][C]0.420404[/C][/ROW]
[ROW][C]36[/C][C]0.006475[/C][C]0.0467[/C][C]0.481469[/C][/ROW]
[ROW][C]37[/C][C]-0.049862[/C][C]-0.3596[/C][C]0.360317[/C][/ROW]
[ROW][C]38[/C][C]-0.021419[/C][C]-0.1545[/C][C]0.438925[/C][/ROW]
[ROW][C]39[/C][C]-0.056847[/C][C]-0.4099[/C][C]0.341771[/C][/ROW]
[ROW][C]40[/C][C]0.008057[/C][C]0.0581[/C][C]0.476946[/C][/ROW]
[ROW][C]41[/C][C]0.009683[/C][C]0.0698[/C][C]0.472301[/C][/ROW]
[ROW][C]42[/C][C]0.009684[/C][C]0.0698[/C][C]0.472298[/C][/ROW]
[ROW][C]43[/C][C]0.028657[/C][C]0.2066[/C][C]0.418545[/C][/ROW]
[ROW][C]44[/C][C]-0.013718[/C][C]-0.0989[/C][C]0.460791[/C][/ROW]
[ROW][C]45[/C][C]-0.01603[/C][C]-0.1156[/C][C]0.454211[/C][/ROW]
[ROW][C]46[/C][C]-0.049534[/C][C]-0.3572[/C][C]0.361195[/C][/ROW]
[ROW][C]47[/C][C]-0.036461[/C][C]-0.2629[/C][C]0.396825[/C][/ROW]
[ROW][C]48[/C][C]-0.034055[/C][C]-0.2456[/C][C]0.403488[/C][/ROW]
[/TABLE]
Source: https://freestatistics.org/blog/index.php?pk=116227&T=1

Globally Unique Identifier (entire table): ba.freestatistics.org/blog/index.php?pk=116227&T=1

As an alternative you can also use a QR Code:  

The GUIDs for individual cells are displayed in the table below:

Autocorrelation Function
Time lag kACF(k)T-STATP-value
10.0996920.71890.237714
20.0543480.39190.348364
30.0088720.0640.474617
4-0.409445-2.95260.00236
50.0707860.51040.305951
60.1849671.33380.094038
7-0.112717-0.81280.210014
8-0.027142-0.19570.422794
9-0.058572-0.42240.337249
10-0.225243-1.62430.055185
110.1082880.78090.219208
120.0365530.26360.396569
13-0.104261-0.75180.22777
140.0081410.05870.476705
15-0.067909-0.48970.313203
160.0175110.12630.450002
170.0879050.63390.264464
180.1907611.37560.087422
19-0.023117-0.16670.434127
200.0420360.30310.381503
21-0.110119-0.79410.215378
22-0.150125-1.08260.141998
23-0.024853-0.17920.429231
24-0.013321-0.09610.461922
250.0150290.10840.457057
260.0569380.41060.341533
27-0.007758-0.05590.4778
28-0.052525-0.37880.353204
290.028470.20530.41907
30-0.048251-0.34790.364643
310.012580.09070.464033
320.02470.17810.429662
330.0153270.11050.456209
340.0591450.42650.335752
350.0279940.20190.420404
360.0064750.04670.481469
37-0.049862-0.35960.360317
38-0.021419-0.15450.438925
39-0.056847-0.40990.341771
400.0080570.05810.476946
410.0096830.06980.472301
420.0096840.06980.472298
430.0286570.20660.418545
44-0.013718-0.09890.460791
45-0.01603-0.11560.454211
46-0.049534-0.35720.361195
47-0.036461-0.26290.396825
48-0.034055-0.24560.403488


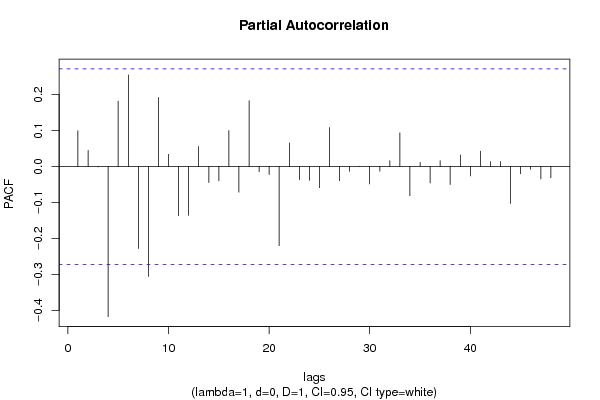
Partial Autocorrelation Function
Time lag kPACF(k)T-STATP-value
10.0996920.71890.237714
20.0448550.32350.373824
3-0.000784-0.00570.497755
4-0.417637-3.01160.002003
50.1821731.31370.097362
60.2552011.84030.035719
7-0.228187-1.64550.052951
8-0.306042-2.20690.01588
90.1924871.3880.085521
100.0343750.24790.402602
11-0.136598-0.9850.164587
12-0.135523-0.97730.16648
130.0560380.40410.343899
14-0.044542-0.32120.374675
15-0.039501-0.28480.388448
160.1004020.7240.236152
17-0.071169-0.51320.30499
180.1834841.32310.095792
19-0.014446-0.10420.458717
20-0.02213-0.15960.436916
21-0.220159-1.58760.059221
220.0657160.47390.318783
23-0.03676-0.26510.395997
24-0.038314-0.27630.391713
25-0.058572-0.42240.337248
260.1088450.78490.218038
27-0.039064-0.28170.389647
28-0.013134-0.09470.462455
290.0003910.00280.49888
30-0.048098-0.34680.365055
31-0.012909-0.09310.463095
320.0165620.11940.452699
330.0939630.67760.250521
34-0.080982-0.5840.280883
350.0114730.08270.467191
36-0.045489-0.3280.372104
370.0164440.11860.453033
38-0.049989-0.36050.359975
390.0322030.23220.408638
40-0.025843-0.18640.426444
410.0429230.30950.37908
420.0137780.09940.460619
430.0143390.10340.459022
44-0.102692-0.74050.231157
45-0.020031-0.14440.442854
46-0.007563-0.05450.478357
47-0.034369-0.24780.402617
48-0.031273-0.22550.411232

\begin{tabular}{lllllllll}
\hline
Partial Autocorrelation Function \tabularnewline
Time lag k & PACF(k) & T-STAT & P-value \tabularnewline
1 & 0.099692 & 0.7189 & 0.237714 \tabularnewline
2 & 0.044855 & 0.3235 & 0.373824 \tabularnewline
3 & -0.000784 & -0.0057 & 0.497755 \tabularnewline
4 & -0.417637 & -3.0116 & 0.002003 \tabularnewline
5 & 0.182173 & 1.3137 & 0.097362 \tabularnewline
6 & 0.255201 & 1.8403 & 0.035719 \tabularnewline
7 & -0.228187 & -1.6455 & 0.052951 \tabularnewline
8 & -0.306042 & -2.2069 & 0.01588 \tabularnewline
9 & 0.192487 & 1.388 & 0.085521 \tabularnewline
10 & 0.034375 & 0.2479 & 0.402602 \tabularnewline
11 & -0.136598 & -0.985 & 0.164587 \tabularnewline
12 & -0.135523 & -0.9773 & 0.16648 \tabularnewline
13 & 0.056038 & 0.4041 & 0.343899 \tabularnewline
14 & -0.044542 & -0.3212 & 0.374675 \tabularnewline
15 & -0.039501 & -0.2848 & 0.388448 \tabularnewline
16 & 0.100402 & 0.724 & 0.236152 \tabularnewline
17 & -0.071169 & -0.5132 & 0.30499 \tabularnewline
18 & 0.183484 & 1.3231 & 0.095792 \tabularnewline
19 & -0.014446 & -0.1042 & 0.458717 \tabularnewline
20 & -0.02213 & -0.1596 & 0.436916 \tabularnewline
21 & -0.220159 & -1.5876 & 0.059221 \tabularnewline
22 & 0.065716 & 0.4739 & 0.318783 \tabularnewline
23 & -0.03676 & -0.2651 & 0.395997 \tabularnewline
24 & -0.038314 & -0.2763 & 0.391713 \tabularnewline
25 & -0.058572 & -0.4224 & 0.337248 \tabularnewline
26 & 0.108845 & 0.7849 & 0.218038 \tabularnewline
27 & -0.039064 & -0.2817 & 0.389647 \tabularnewline
28 & -0.013134 & -0.0947 & 0.462455 \tabularnewline
29 & 0.000391 & 0.0028 & 0.49888 \tabularnewline
30 & -0.048098 & -0.3468 & 0.365055 \tabularnewline
31 & -0.012909 & -0.0931 & 0.463095 \tabularnewline
32 & 0.016562 & 0.1194 & 0.452699 \tabularnewline
33 & 0.093963 & 0.6776 & 0.250521 \tabularnewline
34 & -0.080982 & -0.584 & 0.280883 \tabularnewline
35 & 0.011473 & 0.0827 & 0.467191 \tabularnewline
36 & -0.045489 & -0.328 & 0.372104 \tabularnewline
37 & 0.016444 & 0.1186 & 0.453033 \tabularnewline
38 & -0.049989 & -0.3605 & 0.359975 \tabularnewline
39 & 0.032203 & 0.2322 & 0.408638 \tabularnewline
40 & -0.025843 & -0.1864 & 0.426444 \tabularnewline
41 & 0.042923 & 0.3095 & 0.37908 \tabularnewline
42 & 0.013778 & 0.0994 & 0.460619 \tabularnewline
43 & 0.014339 & 0.1034 & 0.459022 \tabularnewline
44 & -0.102692 & -0.7405 & 0.231157 \tabularnewline
45 & -0.020031 & -0.1444 & 0.442854 \tabularnewline
46 & -0.007563 & -0.0545 & 0.478357 \tabularnewline
47 & -0.034369 & -0.2478 & 0.402617 \tabularnewline
48 & -0.031273 & -0.2255 & 0.411232 \tabularnewline
\hline
\end{tabular}
%Source: https://freestatistics.org/blog/index.php?pk=116227&T=2

[TABLE]
[ROW][C]Partial Autocorrelation Function[/C][/ROW]
[ROW][C]Time lag k[/C][C]PACF(k)[/C][C]T-STAT[/C][C]P-value[/C][/ROW]
[ROW][C]1[/C][C]0.099692[/C][C]0.7189[/C][C]0.237714[/C][/ROW]
[ROW][C]2[/C][C]0.044855[/C][C]0.3235[/C][C]0.373824[/C][/ROW]
[ROW][C]3[/C][C]-0.000784[/C][C]-0.0057[/C][C]0.497755[/C][/ROW]
[ROW][C]4[/C][C]-0.417637[/C][C]-3.0116[/C][C]0.002003[/C][/ROW]
[ROW][C]5[/C][C]0.182173[/C][C]1.3137[/C][C]0.097362[/C][/ROW]
[ROW][C]6[/C][C]0.255201[/C][C]1.8403[/C][C]0.035719[/C][/ROW]
[ROW][C]7[/C][C]-0.228187[/C][C]-1.6455[/C][C]0.052951[/C][/ROW]
[ROW][C]8[/C][C]-0.306042[/C][C]-2.2069[/C][C]0.01588[/C][/ROW]
[ROW][C]9[/C][C]0.192487[/C][C]1.388[/C][C]0.085521[/C][/ROW]
[ROW][C]10[/C][C]0.034375[/C][C]0.2479[/C][C]0.402602[/C][/ROW]
[ROW][C]11[/C][C]-0.136598[/C][C]-0.985[/C][C]0.164587[/C][/ROW]
[ROW][C]12[/C][C]-0.135523[/C][C]-0.9773[/C][C]0.16648[/C][/ROW]
[ROW][C]13[/C][C]0.056038[/C][C]0.4041[/C][C]0.343899[/C][/ROW]
[ROW][C]14[/C][C]-0.044542[/C][C]-0.3212[/C][C]0.374675[/C][/ROW]
[ROW][C]15[/C][C]-0.039501[/C][C]-0.2848[/C][C]0.388448[/C][/ROW]
[ROW][C]16[/C][C]0.100402[/C][C]0.724[/C][C]0.236152[/C][/ROW]
[ROW][C]17[/C][C]-0.071169[/C][C]-0.5132[/C][C]0.30499[/C][/ROW]
[ROW][C]18[/C][C]0.183484[/C][C]1.3231[/C][C]0.095792[/C][/ROW]
[ROW][C]19[/C][C]-0.014446[/C][C]-0.1042[/C][C]0.458717[/C][/ROW]
[ROW][C]20[/C][C]-0.02213[/C][C]-0.1596[/C][C]0.436916[/C][/ROW]
[ROW][C]21[/C][C]-0.220159[/C][C]-1.5876[/C][C]0.059221[/C][/ROW]
[ROW][C]22[/C][C]0.065716[/C][C]0.4739[/C][C]0.318783[/C][/ROW]
[ROW][C]23[/C][C]-0.03676[/C][C]-0.2651[/C][C]0.395997[/C][/ROW]
[ROW][C]24[/C][C]-0.038314[/C][C]-0.2763[/C][C]0.391713[/C][/ROW]
[ROW][C]25[/C][C]-0.058572[/C][C]-0.4224[/C][C]0.337248[/C][/ROW]
[ROW][C]26[/C][C]0.108845[/C][C]0.7849[/C][C]0.218038[/C][/ROW]
[ROW][C]27[/C][C]-0.039064[/C][C]-0.2817[/C][C]0.389647[/C][/ROW]
[ROW][C]28[/C][C]-0.013134[/C][C]-0.0947[/C][C]0.462455[/C][/ROW]
[ROW][C]29[/C][C]0.000391[/C][C]0.0028[/C][C]0.49888[/C][/ROW]
[ROW][C]30[/C][C]-0.048098[/C][C]-0.3468[/C][C]0.365055[/C][/ROW]
[ROW][C]31[/C][C]-0.012909[/C][C]-0.0931[/C][C]0.463095[/C][/ROW]
[ROW][C]32[/C][C]0.016562[/C][C]0.1194[/C][C]0.452699[/C][/ROW]
[ROW][C]33[/C][C]0.093963[/C][C]0.6776[/C][C]0.250521[/C][/ROW]
[ROW][C]34[/C][C]-0.080982[/C][C]-0.584[/C][C]0.280883[/C][/ROW]
[ROW][C]35[/C][C]0.011473[/C][C]0.0827[/C][C]0.467191[/C][/ROW]
[ROW][C]36[/C][C]-0.045489[/C][C]-0.328[/C][C]0.372104[/C][/ROW]
[ROW][C]37[/C][C]0.016444[/C][C]0.1186[/C][C]0.453033[/C][/ROW]
[ROW][C]38[/C][C]-0.049989[/C][C]-0.3605[/C][C]0.359975[/C][/ROW]
[ROW][C]39[/C][C]0.032203[/C][C]0.2322[/C][C]0.408638[/C][/ROW]
[ROW][C]40[/C][C]-0.025843[/C][C]-0.1864[/C][C]0.426444[/C][/ROW]
[ROW][C]41[/C][C]0.042923[/C][C]0.3095[/C][C]0.37908[/C][/ROW]
[ROW][C]42[/C][C]0.013778[/C][C]0.0994[/C][C]0.460619[/C][/ROW]
[ROW][C]43[/C][C]0.014339[/C][C]0.1034[/C][C]0.459022[/C][/ROW]
[ROW][C]44[/C][C]-0.102692[/C][C]-0.7405[/C][C]0.231157[/C][/ROW]
[ROW][C]45[/C][C]-0.020031[/C][C]-0.1444[/C][C]0.442854[/C][/ROW]
[ROW][C]46[/C][C]-0.007563[/C][C]-0.0545[/C][C]0.478357[/C][/ROW]
[ROW][C]47[/C][C]-0.034369[/C][C]-0.2478[/C][C]0.402617[/C][/ROW]
[ROW][C]48[/C][C]-0.031273[/C][C]-0.2255[/C][C]0.411232[/C][/ROW]
[/TABLE]
Source: https://freestatistics.org/blog/index.php?pk=116227&T=2

Globally Unique Identifier (entire table): ba.freestatistics.org/blog/index.php?pk=116227&T=2

As an alternative you can also use a QR Code:  

The GUIDs for individual cells are displayed in the table below:

Partial Autocorrelation Function
Time lag kPACF(k)T-STATP-value
10.0996920.71890.237714
20.0448550.32350.373824
3-0.000784-0.00570.497755
4-0.417637-3.01160.002003
50.1821731.31370.097362
60.2552011.84030.035719
7-0.228187-1.64550.052951
8-0.306042-2.20690.01588
90.1924871.3880.085521
100.0343750.24790.402602
11-0.136598-0.9850.164587
12-0.135523-0.97730.16648
130.0560380.40410.343899
14-0.044542-0.32120.374675
15-0.039501-0.28480.388448
160.1004020.7240.236152
17-0.071169-0.51320.30499
180.1834841.32310.095792
19-0.014446-0.10420.458717
20-0.02213-0.15960.436916
21-0.220159-1.58760.059221
220.0657160.47390.318783
23-0.03676-0.26510.395997
24-0.038314-0.27630.391713
25-0.058572-0.42240.337248
260.1088450.78490.218038
27-0.039064-0.28170.389647
28-0.013134-0.09470.462455
290.0003910.00280.49888
30-0.048098-0.34680.365055
31-0.012909-0.09310.463095
320.0165620.11940.452699
330.0939630.67760.250521
34-0.080982-0.5840.280883
350.0114730.08270.467191
36-0.045489-0.3280.372104
370.0164440.11860.453033
38-0.049989-0.36050.359975
390.0322030.23220.408638
40-0.025843-0.18640.426444
410.0429230.30950.37908
420.0137780.09940.460619
430.0143390.10340.459022
44-0.102692-0.74050.231157
45-0.020031-0.14440.442854
46-0.007563-0.05450.478357
47-0.034369-0.24780.402617
48-0.031273-0.22550.411232


Parameters (Session):
par1 = 48 ; par2 = 1 ; par3 = 0 ; par4 = 1 ; par5 = 4 ; par6 = White Noise ; par7 = 0.95 ;
Parameters (R input):
par1 = 48 ; par2 = 1 ; par3 = 0 ; par4 = 1 ; par5 = 4 ; par6 = White Noise ; par7 = 0.95 ; par8 = ;
R code (references can be found in the software module):
if (par1 == 'Default') {
par1 = 10*log10(length(x))
} else {
par1 <- as.numeric(par1)
}
par2 <- as.numeric(par2)
par3 <- as.numeric(par3)
par4 <- as.numeric(par4)
par5 <- as.numeric(par5)
if (par6 == 'White Noise') par6 <- 'white' else par6 <- 'ma'
par7 <- as.numeric(par7)
if (par8 != '') par8 <- as.numeric(par8)
ox <- x
if (par8 == '') {
if (par2 == 0) {
x <- log(x)
} else {
x <- (x ^ par2 - 1) / par2
}
} else {
x <- log(x,base=par8)
}
if (par3 > 0) x <- diff(x,lag=1,difference=par3)
if (par4 > 0) x <- diff(x,lag=par5,difference=par4)
bitmap(file='picts.png')
op <- par(mfrow=c(2,1))
plot(ox,type='l',main='Original Time Series',xlab='time',ylab='value')
if (par8=='') {
mytitle <- paste('Working Time Series (lambda=',par2,', d=',par3,', D=',par4,')',sep='')
mysub <- paste('(lambda=',par2,', d=',par3,', D=',par4,', CI=', par7, ', CI type=',par6,')',sep='')
} else {
mytitle <- paste('Working Time Series (base=',par8,', d=',par3,', D=',par4,')',sep='')
mysub <- paste('(base=',par8,', d=',par3,', D=',par4,', CI=', par7, ', CI type=',par6,')',sep='')
}
plot(x,type='l', main=mytitle,xlab='time',ylab='value')
par(op)
dev.off()
bitmap(file='pic1.png')
racf <- acf(x, par1, main='Autocorrelation', xlab='time lag', ylab='ACF', ci.type=par6, ci=par7, sub=mysub)
dev.off()
bitmap(file='pic2.png')
rpacf <- pacf(x,par1,main='Partial Autocorrelation',xlab='lags',ylab='PACF',sub=mysub)
dev.off()
(myacf <- c(racf$acf))
(mypacf <- c(rpacf$acf))
lengthx <- length(x)
sqrtn <- sqrt(lengthx)
load(file='createtable')
a<-table.start()
a<-table.row.start(a)
a<-table.element(a,'Autocorrelation Function',4,TRUE)
a<-table.row.end(a)
a<-table.row.start(a)
a<-table.element(a,'Time lag k',header=TRUE)
a<-table.element(a,hyperlink('basics.htm','ACF(k)','click here for more information about the Autocorrelation Function'),header=TRUE)
a<-table.element(a,'T-STAT',header=TRUE)
a<-table.element(a,'P-value',header=TRUE)
a<-table.row.end(a)
for (i in 2:(par1+1)) {
a<-table.row.start(a)
a<-table.element(a,i-1,header=TRUE)
a<-table.element(a,round(myacf[i],6))
mytstat <- myacf[i]*sqrtn
a<-table.element(a,round(mytstat,4))
a<-table.element(a,round(1-pt(abs(mytstat),lengthx),6))
a<-table.row.end(a)
}
a<-table.end(a)
table.save(a,file='mytable.tab')
a<-table.start()
a<-table.row.start(a)
a<-table.element(a,'Partial Autocorrelation Function',4,TRUE)
a<-table.row.end(a)
a<-table.row.start(a)
a<-table.element(a,'Time lag k',header=TRUE)
a<-table.element(a,hyperlink('basics.htm','PACF(k)','click here for more information about the Partial Autocorrelation Function'),header=TRUE)
a<-table.element(a,'T-STAT',header=TRUE)
a<-table.element(a,'P-value',header=TRUE)
a<-table.row.end(a)
for (i in 1:par1) {
a<-table.row.start(a)
a<-table.element(a,i,header=TRUE)
a<-table.element(a,round(mypacf[i],6))
mytstat <- mypacf[i]*sqrtn
a<-table.element(a,round(mytstat,4))
a<-table.element(a,round(1-pt(abs(mytstat),lengthx),6))
a<-table.row.end(a)
}
a<-table.end(a)
table.save(a,file='mytable1.tab')