Free Statistics

of Irreproducible Research!

Author's title

Author*The author of this computation has been verified*
R Software Modulerwasp_autocorrelation.wasp
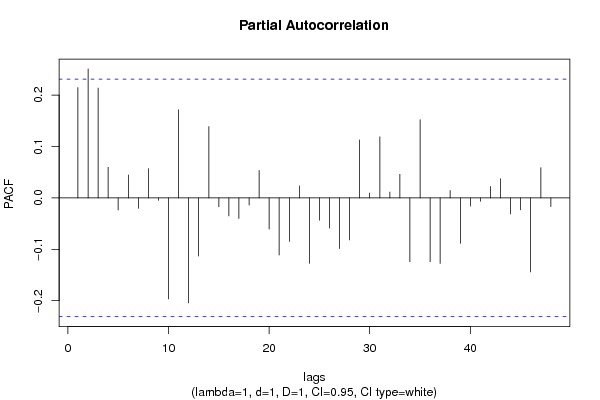
Title produced by software(Partial) Autocorrelation Function
Date of computationTue, 28 Dec 2010 08:43:45 +0000
Cite this page as followsStatistical Computations at FreeStatistics.org, Office for Research Development and Education, URL https://freestatistics.org/blog/index.php?v=date/2010/Dec/28/t1293525688k3p5ocpb1r6bz05.htm/, Retrieved Sun, 05 May 2024 07:45:09 +0000
Statistical Computations at FreeStatistics.org, Office for Research Development and Education, URL https://freestatistics.org/blog/index.php?pk=116225, Retrieved Sun, 05 May 2024 07:45:09 +0000
QR Codes:

Original text written by user:
IsPrivate?No (this computation is public)
User-defined keywords
Estimated Impact148
Family? (F = Feedback message, R = changed R code, M = changed R Module, P = changed Parameters, D = changed Data)
-     [Variance Reduction Matrix] [] [2010-12-24 15:11:40] [afd301b68d203992295e6972aed62880]
- RMPD    [(Partial) Autocorrelation Function] [] [2010-12-28 08:43:45] [5a59313293e5c9f616ad36f6edd018c5] [Current]
Feedback Forum

Post a new message
Dataseries X:
547.344		
554.788	
562.325	
560.854	
555.332	
543.599	
536.662	
542.722	
593.530	
610.763	
612.613	
611.324	
594.167	
595.454	
590.865	
589.379	
584.428	
573.100	
567.456	
569.028	
620.735	
628.884	
628.232	
612.117	
595.404	
597.141	
593.408	
590.072	
579.799	
574.205	
572.775	
572.942	
619.567	
625.809	
619.916	
587.625	
565.742	
557.274	
560.576	
548.854	
531.673	
525.919	
511.038	
498.662	
555.362	
564.591	
541.657	
527.070	
509.846	
514.258	
516.922	
507.561	
492.622	
490.243	
469.357	
477.580	
528.379	
533.590	
517.945	
506.174	
501.866	
516.141	
528.222	
532.638	
536.322		
536.535		
523.597		
536.214		
586.570		
596.594		
580.523		
564.478		
557.560		
575.093		
580.112		
574.761		
563.250		
551.531		
537.034		
544.686		
600.991		
604.378		
586.111		
563.668		
548.604		


Summary of computational transaction
Raw Inputview raw input (R code)
Raw Outputview raw output of R engine
Computing time11 seconds
R Server'George Udny Yule' @ 72.249.76.132

\begin{tabular}{lllllllll}
\hline
Summary of computational transaction \tabularnewline
Raw Input & view raw input (R code)  \tabularnewline
Raw Output & view raw output of R engine  \tabularnewline
Computing time & 11 seconds \tabularnewline
R Server & 'George Udny Yule' @ 72.249.76.132 \tabularnewline
\hline
\end{tabular}
%Source: https://freestatistics.org/blog/index.php?pk=116225&T=0

[TABLE]
[ROW][C]Summary of computational transaction[/C][/ROW]
[ROW][C]Raw Input[/C][C]view raw input (R code) [/C][/ROW]
[ROW][C]Raw Output[/C][C]view raw output of R engine [/C][/ROW]
[ROW][C]Computing time[/C][C]11 seconds[/C][/ROW]
[ROW][C]R Server[/C][C]'George Udny Yule' @ 72.249.76.132[/C][/ROW]
[/TABLE]
Source: https://freestatistics.org/blog/index.php?pk=116225&T=0

Globally Unique Identifier (entire table): ba.freestatistics.org/blog/index.php?pk=116225&T=0

As an alternative you can also use a QR Code:  

The GUIDs for individual cells are displayed in the table below:

Summary of computational transaction
Raw Inputview raw input (R code)
Raw Outputview raw output of R engine
Computing time11 seconds
R Server'George Udny Yule' @ 72.249.76.132


Autocorrelation Function
Time lag kACF(k)T-STATP-value
10.2145481.82050.036419
20.2852782.42070.009008
30.2905692.46560.008032
40.1895131.60810.056098
50.1290051.09460.138661
60.1639721.39130.084202
70.0804760.68290.248442
80.1290221.09480.13863
90.0739720.62770.266102
10-0.096887-0.82210.206864
110.1685651.43030.078475
12-0.151243-1.28330.101744
13-0.120669-1.02390.154652
140.0546730.46390.322055
15-0.069197-0.58720.279468
16-0.09923-0.8420.201289
17-0.040712-0.34540.365382
18-0.092236-0.78270.218199
19-0.029699-0.2520.400877
20-0.07502-0.63660.263213
21-0.202263-1.71630.045208
22-0.064647-0.54860.292505
23-0.113136-0.960.170136
24-0.247171-2.09730.019739
25-0.072659-0.61650.269743
26-0.188656-1.60080.0569
27-0.235501-1.99830.024731
28-0.180769-1.53390.064721
29-0.093536-0.79370.214996
30-0.129269-1.09690.138174
31-0.005635-0.04780.480998
32-0.096252-0.81670.20839
330.0441330.37450.354573
34-0.051135-0.43390.33283
350.0198410.16840.433389
36-0.01889-0.16030.436553
37-0.024712-0.20970.417252
38-0.013548-0.1150.4544
39-0.017597-0.14930.44086
400.0328520.27880.390614
41-0.045998-0.39030.348731
420.0517450.43910.330962
43-0.016522-0.14020.444448
440.0228510.19390.423402
45-0.051371-0.43590.332107
46-0.05256-0.4460.328473
47-0.026513-0.2250.411321
48-0.006989-0.05930.476438

\begin{tabular}{lllllllll}
\hline
Autocorrelation Function \tabularnewline
Time lag k & ACF(k) & T-STAT & P-value \tabularnewline
1 & 0.214548 & 1.8205 & 0.036419 \tabularnewline
2 & 0.285278 & 2.4207 & 0.009008 \tabularnewline
3 & 0.290569 & 2.4656 & 0.008032 \tabularnewline
4 & 0.189513 & 1.6081 & 0.056098 \tabularnewline
5 & 0.129005 & 1.0946 & 0.138661 \tabularnewline
6 & 0.163972 & 1.3913 & 0.084202 \tabularnewline
7 & 0.080476 & 0.6829 & 0.248442 \tabularnewline
8 & 0.129022 & 1.0948 & 0.13863 \tabularnewline
9 & 0.073972 & 0.6277 & 0.266102 \tabularnewline
10 & -0.096887 & -0.8221 & 0.206864 \tabularnewline
11 & 0.168565 & 1.4303 & 0.078475 \tabularnewline
12 & -0.151243 & -1.2833 & 0.101744 \tabularnewline
13 & -0.120669 & -1.0239 & 0.154652 \tabularnewline
14 & 0.054673 & 0.4639 & 0.322055 \tabularnewline
15 & -0.069197 & -0.5872 & 0.279468 \tabularnewline
16 & -0.09923 & -0.842 & 0.201289 \tabularnewline
17 & -0.040712 & -0.3454 & 0.365382 \tabularnewline
18 & -0.092236 & -0.7827 & 0.218199 \tabularnewline
19 & -0.029699 & -0.252 & 0.400877 \tabularnewline
20 & -0.07502 & -0.6366 & 0.263213 \tabularnewline
21 & -0.202263 & -1.7163 & 0.045208 \tabularnewline
22 & -0.064647 & -0.5486 & 0.292505 \tabularnewline
23 & -0.113136 & -0.96 & 0.170136 \tabularnewline
24 & -0.247171 & -2.0973 & 0.019739 \tabularnewline
25 & -0.072659 & -0.6165 & 0.269743 \tabularnewline
26 & -0.188656 & -1.6008 & 0.0569 \tabularnewline
27 & -0.235501 & -1.9983 & 0.024731 \tabularnewline
28 & -0.180769 & -1.5339 & 0.064721 \tabularnewline
29 & -0.093536 & -0.7937 & 0.214996 \tabularnewline
30 & -0.129269 & -1.0969 & 0.138174 \tabularnewline
31 & -0.005635 & -0.0478 & 0.480998 \tabularnewline
32 & -0.096252 & -0.8167 & 0.20839 \tabularnewline
33 & 0.044133 & 0.3745 & 0.354573 \tabularnewline
34 & -0.051135 & -0.4339 & 0.33283 \tabularnewline
35 & 0.019841 & 0.1684 & 0.433389 \tabularnewline
36 & -0.01889 & -0.1603 & 0.436553 \tabularnewline
37 & -0.024712 & -0.2097 & 0.417252 \tabularnewline
38 & -0.013548 & -0.115 & 0.4544 \tabularnewline
39 & -0.017597 & -0.1493 & 0.44086 \tabularnewline
40 & 0.032852 & 0.2788 & 0.390614 \tabularnewline
41 & -0.045998 & -0.3903 & 0.348731 \tabularnewline
42 & 0.051745 & 0.4391 & 0.330962 \tabularnewline
43 & -0.016522 & -0.1402 & 0.444448 \tabularnewline
44 & 0.022851 & 0.1939 & 0.423402 \tabularnewline
45 & -0.051371 & -0.4359 & 0.332107 \tabularnewline
46 & -0.05256 & -0.446 & 0.328473 \tabularnewline
47 & -0.026513 & -0.225 & 0.411321 \tabularnewline
48 & -0.006989 & -0.0593 & 0.476438 \tabularnewline
\hline
\end{tabular}
%Source: https://freestatistics.org/blog/index.php?pk=116225&T=1

[TABLE]
[ROW][C]Autocorrelation Function[/C][/ROW]
[ROW][C]Time lag k[/C][C]ACF(k)[/C][C]T-STAT[/C][C]P-value[/C][/ROW]
[ROW][C]1[/C][C]0.214548[/C][C]1.8205[/C][C]0.036419[/C][/ROW]
[ROW][C]2[/C][C]0.285278[/C][C]2.4207[/C][C]0.009008[/C][/ROW]
[ROW][C]3[/C][C]0.290569[/C][C]2.4656[/C][C]0.008032[/C][/ROW]
[ROW][C]4[/C][C]0.189513[/C][C]1.6081[/C][C]0.056098[/C][/ROW]
[ROW][C]5[/C][C]0.129005[/C][C]1.0946[/C][C]0.138661[/C][/ROW]
[ROW][C]6[/C][C]0.163972[/C][C]1.3913[/C][C]0.084202[/C][/ROW]
[ROW][C]7[/C][C]0.080476[/C][C]0.6829[/C][C]0.248442[/C][/ROW]
[ROW][C]8[/C][C]0.129022[/C][C]1.0948[/C][C]0.13863[/C][/ROW]
[ROW][C]9[/C][C]0.073972[/C][C]0.6277[/C][C]0.266102[/C][/ROW]
[ROW][C]10[/C][C]-0.096887[/C][C]-0.8221[/C][C]0.206864[/C][/ROW]
[ROW][C]11[/C][C]0.168565[/C][C]1.4303[/C][C]0.078475[/C][/ROW]
[ROW][C]12[/C][C]-0.151243[/C][C]-1.2833[/C][C]0.101744[/C][/ROW]
[ROW][C]13[/C][C]-0.120669[/C][C]-1.0239[/C][C]0.154652[/C][/ROW]
[ROW][C]14[/C][C]0.054673[/C][C]0.4639[/C][C]0.322055[/C][/ROW]
[ROW][C]15[/C][C]-0.069197[/C][C]-0.5872[/C][C]0.279468[/C][/ROW]
[ROW][C]16[/C][C]-0.09923[/C][C]-0.842[/C][C]0.201289[/C][/ROW]
[ROW][C]17[/C][C]-0.040712[/C][C]-0.3454[/C][C]0.365382[/C][/ROW]
[ROW][C]18[/C][C]-0.092236[/C][C]-0.7827[/C][C]0.218199[/C][/ROW]
[ROW][C]19[/C][C]-0.029699[/C][C]-0.252[/C][C]0.400877[/C][/ROW]
[ROW][C]20[/C][C]-0.07502[/C][C]-0.6366[/C][C]0.263213[/C][/ROW]
[ROW][C]21[/C][C]-0.202263[/C][C]-1.7163[/C][C]0.045208[/C][/ROW]
[ROW][C]22[/C][C]-0.064647[/C][C]-0.5486[/C][C]0.292505[/C][/ROW]
[ROW][C]23[/C][C]-0.113136[/C][C]-0.96[/C][C]0.170136[/C][/ROW]
[ROW][C]24[/C][C]-0.247171[/C][C]-2.0973[/C][C]0.019739[/C][/ROW]
[ROW][C]25[/C][C]-0.072659[/C][C]-0.6165[/C][C]0.269743[/C][/ROW]
[ROW][C]26[/C][C]-0.188656[/C][C]-1.6008[/C][C]0.0569[/C][/ROW]
[ROW][C]27[/C][C]-0.235501[/C][C]-1.9983[/C][C]0.024731[/C][/ROW]
[ROW][C]28[/C][C]-0.180769[/C][C]-1.5339[/C][C]0.064721[/C][/ROW]
[ROW][C]29[/C][C]-0.093536[/C][C]-0.7937[/C][C]0.214996[/C][/ROW]
[ROW][C]30[/C][C]-0.129269[/C][C]-1.0969[/C][C]0.138174[/C][/ROW]
[ROW][C]31[/C][C]-0.005635[/C][C]-0.0478[/C][C]0.480998[/C][/ROW]
[ROW][C]32[/C][C]-0.096252[/C][C]-0.8167[/C][C]0.20839[/C][/ROW]
[ROW][C]33[/C][C]0.044133[/C][C]0.3745[/C][C]0.354573[/C][/ROW]
[ROW][C]34[/C][C]-0.051135[/C][C]-0.4339[/C][C]0.33283[/C][/ROW]
[ROW][C]35[/C][C]0.019841[/C][C]0.1684[/C][C]0.433389[/C][/ROW]
[ROW][C]36[/C][C]-0.01889[/C][C]-0.1603[/C][C]0.436553[/C][/ROW]
[ROW][C]37[/C][C]-0.024712[/C][C]-0.2097[/C][C]0.417252[/C][/ROW]
[ROW][C]38[/C][C]-0.013548[/C][C]-0.115[/C][C]0.4544[/C][/ROW]
[ROW][C]39[/C][C]-0.017597[/C][C]-0.1493[/C][C]0.44086[/C][/ROW]
[ROW][C]40[/C][C]0.032852[/C][C]0.2788[/C][C]0.390614[/C][/ROW]
[ROW][C]41[/C][C]-0.045998[/C][C]-0.3903[/C][C]0.348731[/C][/ROW]
[ROW][C]42[/C][C]0.051745[/C][C]0.4391[/C][C]0.330962[/C][/ROW]
[ROW][C]43[/C][C]-0.016522[/C][C]-0.1402[/C][C]0.444448[/C][/ROW]
[ROW][C]44[/C][C]0.022851[/C][C]0.1939[/C][C]0.423402[/C][/ROW]
[ROW][C]45[/C][C]-0.051371[/C][C]-0.4359[/C][C]0.332107[/C][/ROW]
[ROW][C]46[/C][C]-0.05256[/C][C]-0.446[/C][C]0.328473[/C][/ROW]
[ROW][C]47[/C][C]-0.026513[/C][C]-0.225[/C][C]0.411321[/C][/ROW]
[ROW][C]48[/C][C]-0.006989[/C][C]-0.0593[/C][C]0.476438[/C][/ROW]
[/TABLE]
Source: https://freestatistics.org/blog/index.php?pk=116225&T=1

Globally Unique Identifier (entire table): ba.freestatistics.org/blog/index.php?pk=116225&T=1

As an alternative you can also use a QR Code:  

The GUIDs for individual cells are displayed in the table below:

Autocorrelation Function
Time lag kACF(k)T-STATP-value
10.2145481.82050.036419
20.2852782.42070.009008
30.2905692.46560.008032
40.1895131.60810.056098
50.1290051.09460.138661
60.1639721.39130.084202
70.0804760.68290.248442
80.1290221.09480.13863
90.0739720.62770.266102
10-0.096887-0.82210.206864
110.1685651.43030.078475
12-0.151243-1.28330.101744
13-0.120669-1.02390.154652
140.0546730.46390.322055
15-0.069197-0.58720.279468
16-0.09923-0.8420.201289
17-0.040712-0.34540.365382
18-0.092236-0.78270.218199
19-0.029699-0.2520.400877
20-0.07502-0.63660.263213
21-0.202263-1.71630.045208
22-0.064647-0.54860.292505
23-0.113136-0.960.170136
24-0.247171-2.09730.019739
25-0.072659-0.61650.269743
26-0.188656-1.60080.0569
27-0.235501-1.99830.024731
28-0.180769-1.53390.064721
29-0.093536-0.79370.214996
30-0.129269-1.09690.138174
31-0.005635-0.04780.480998
32-0.096252-0.81670.20839
330.0441330.37450.354573
34-0.051135-0.43390.33283
350.0198410.16840.433389
36-0.01889-0.16030.436553
37-0.024712-0.20970.417252
38-0.013548-0.1150.4544
39-0.017597-0.14930.44086
400.0328520.27880.390614
41-0.045998-0.39030.348731
420.0517450.43910.330962
43-0.016522-0.14020.444448
440.0228510.19390.423402
45-0.051371-0.43590.332107
46-0.05256-0.4460.328473
47-0.026513-0.2250.411321
48-0.006989-0.05930.476438


Partial Autocorrelation Function
Time lag kPACF(k)T-STATP-value
10.2145481.82050.036419
20.2507912.1280.018379
30.213551.8120.037076
40.059540.50520.307477
5-0.023438-0.19890.42146
60.0446410.37880.352977
7-0.020319-0.17240.431799
80.0571470.48490.314608
9-0.004626-0.03930.484398
10-0.196506-1.66740.049889
110.1714031.45440.07509
12-0.204202-1.73270.043714
13-0.113175-0.96030.170054
140.1386621.17660.121618
15-0.017392-0.14760.441546
16-0.035034-0.29730.383556
17-0.040023-0.33960.367572
18-0.013859-0.11760.453357
190.0533320.45250.326122
20-0.060747-0.51550.303908
21-0.111302-0.94440.174055
22-0.084807-0.71960.237046
230.0231740.19660.422331
24-0.12737-1.08080.141703
25-0.04333-0.36770.357098
26-0.058579-0.49710.310332
27-0.098641-0.8370.202681
28-0.081886-0.69480.244701
290.1128330.95740.170779
300.0094120.07990.468283
310.1188731.00870.158256
320.0114680.09730.461375
330.0458170.38880.349296
34-0.123969-1.05190.148179
350.1520511.29020.100556
36-0.124017-1.05230.148087
37-0.127576-1.08250.141318
380.0141970.12050.452225
39-0.088389-0.750.227848
40-0.01583-0.13430.44676
41-0.006756-0.05730.477223
420.0223230.18940.425149
430.0373390.31680.376144
44-0.031314-0.26570.395613
45-0.023194-0.19680.422266
46-0.14399-1.22180.112885
470.058780.49880.309732
48-0.016921-0.14360.443117

\begin{tabular}{lllllllll}
\hline
Partial Autocorrelation Function \tabularnewline
Time lag k & PACF(k) & T-STAT & P-value \tabularnewline
1 & 0.214548 & 1.8205 & 0.036419 \tabularnewline
2 & 0.250791 & 2.128 & 0.018379 \tabularnewline
3 & 0.21355 & 1.812 & 0.037076 \tabularnewline
4 & 0.05954 & 0.5052 & 0.307477 \tabularnewline
5 & -0.023438 & -0.1989 & 0.42146 \tabularnewline
6 & 0.044641 & 0.3788 & 0.352977 \tabularnewline
7 & -0.020319 & -0.1724 & 0.431799 \tabularnewline
8 & 0.057147 & 0.4849 & 0.314608 \tabularnewline
9 & -0.004626 & -0.0393 & 0.484398 \tabularnewline
10 & -0.196506 & -1.6674 & 0.049889 \tabularnewline
11 & 0.171403 & 1.4544 & 0.07509 \tabularnewline
12 & -0.204202 & -1.7327 & 0.043714 \tabularnewline
13 & -0.113175 & -0.9603 & 0.170054 \tabularnewline
14 & 0.138662 & 1.1766 & 0.121618 \tabularnewline
15 & -0.017392 & -0.1476 & 0.441546 \tabularnewline
16 & -0.035034 & -0.2973 & 0.383556 \tabularnewline
17 & -0.040023 & -0.3396 & 0.367572 \tabularnewline
18 & -0.013859 & -0.1176 & 0.453357 \tabularnewline
19 & 0.053332 & 0.4525 & 0.326122 \tabularnewline
20 & -0.060747 & -0.5155 & 0.303908 \tabularnewline
21 & -0.111302 & -0.9444 & 0.174055 \tabularnewline
22 & -0.084807 & -0.7196 & 0.237046 \tabularnewline
23 & 0.023174 & 0.1966 & 0.422331 \tabularnewline
24 & -0.12737 & -1.0808 & 0.141703 \tabularnewline
25 & -0.04333 & -0.3677 & 0.357098 \tabularnewline
26 & -0.058579 & -0.4971 & 0.310332 \tabularnewline
27 & -0.098641 & -0.837 & 0.202681 \tabularnewline
28 & -0.081886 & -0.6948 & 0.244701 \tabularnewline
29 & 0.112833 & 0.9574 & 0.170779 \tabularnewline
30 & 0.009412 & 0.0799 & 0.468283 \tabularnewline
31 & 0.118873 & 1.0087 & 0.158256 \tabularnewline
32 & 0.011468 & 0.0973 & 0.461375 \tabularnewline
33 & 0.045817 & 0.3888 & 0.349296 \tabularnewline
34 & -0.123969 & -1.0519 & 0.148179 \tabularnewline
35 & 0.152051 & 1.2902 & 0.100556 \tabularnewline
36 & -0.124017 & -1.0523 & 0.148087 \tabularnewline
37 & -0.127576 & -1.0825 & 0.141318 \tabularnewline
38 & 0.014197 & 0.1205 & 0.452225 \tabularnewline
39 & -0.088389 & -0.75 & 0.227848 \tabularnewline
40 & -0.01583 & -0.1343 & 0.44676 \tabularnewline
41 & -0.006756 & -0.0573 & 0.477223 \tabularnewline
42 & 0.022323 & 0.1894 & 0.425149 \tabularnewline
43 & 0.037339 & 0.3168 & 0.376144 \tabularnewline
44 & -0.031314 & -0.2657 & 0.395613 \tabularnewline
45 & -0.023194 & -0.1968 & 0.422266 \tabularnewline
46 & -0.14399 & -1.2218 & 0.112885 \tabularnewline
47 & 0.05878 & 0.4988 & 0.309732 \tabularnewline
48 & -0.016921 & -0.1436 & 0.443117 \tabularnewline
\hline
\end{tabular}
%Source: https://freestatistics.org/blog/index.php?pk=116225&T=2

[TABLE]
[ROW][C]Partial Autocorrelation Function[/C][/ROW]
[ROW][C]Time lag k[/C][C]PACF(k)[/C][C]T-STAT[/C][C]P-value[/C][/ROW]
[ROW][C]1[/C][C]0.214548[/C][C]1.8205[/C][C]0.036419[/C][/ROW]
[ROW][C]2[/C][C]0.250791[/C][C]2.128[/C][C]0.018379[/C][/ROW]
[ROW][C]3[/C][C]0.21355[/C][C]1.812[/C][C]0.037076[/C][/ROW]
[ROW][C]4[/C][C]0.05954[/C][C]0.5052[/C][C]0.307477[/C][/ROW]
[ROW][C]5[/C][C]-0.023438[/C][C]-0.1989[/C][C]0.42146[/C][/ROW]
[ROW][C]6[/C][C]0.044641[/C][C]0.3788[/C][C]0.352977[/C][/ROW]
[ROW][C]7[/C][C]-0.020319[/C][C]-0.1724[/C][C]0.431799[/C][/ROW]
[ROW][C]8[/C][C]0.057147[/C][C]0.4849[/C][C]0.314608[/C][/ROW]
[ROW][C]9[/C][C]-0.004626[/C][C]-0.0393[/C][C]0.484398[/C][/ROW]
[ROW][C]10[/C][C]-0.196506[/C][C]-1.6674[/C][C]0.049889[/C][/ROW]
[ROW][C]11[/C][C]0.171403[/C][C]1.4544[/C][C]0.07509[/C][/ROW]
[ROW][C]12[/C][C]-0.204202[/C][C]-1.7327[/C][C]0.043714[/C][/ROW]
[ROW][C]13[/C][C]-0.113175[/C][C]-0.9603[/C][C]0.170054[/C][/ROW]
[ROW][C]14[/C][C]0.138662[/C][C]1.1766[/C][C]0.121618[/C][/ROW]
[ROW][C]15[/C][C]-0.017392[/C][C]-0.1476[/C][C]0.441546[/C][/ROW]
[ROW][C]16[/C][C]-0.035034[/C][C]-0.2973[/C][C]0.383556[/C][/ROW]
[ROW][C]17[/C][C]-0.040023[/C][C]-0.3396[/C][C]0.367572[/C][/ROW]
[ROW][C]18[/C][C]-0.013859[/C][C]-0.1176[/C][C]0.453357[/C][/ROW]
[ROW][C]19[/C][C]0.053332[/C][C]0.4525[/C][C]0.326122[/C][/ROW]
[ROW][C]20[/C][C]-0.060747[/C][C]-0.5155[/C][C]0.303908[/C][/ROW]
[ROW][C]21[/C][C]-0.111302[/C][C]-0.9444[/C][C]0.174055[/C][/ROW]
[ROW][C]22[/C][C]-0.084807[/C][C]-0.7196[/C][C]0.237046[/C][/ROW]
[ROW][C]23[/C][C]0.023174[/C][C]0.1966[/C][C]0.422331[/C][/ROW]
[ROW][C]24[/C][C]-0.12737[/C][C]-1.0808[/C][C]0.141703[/C][/ROW]
[ROW][C]25[/C][C]-0.04333[/C][C]-0.3677[/C][C]0.357098[/C][/ROW]
[ROW][C]26[/C][C]-0.058579[/C][C]-0.4971[/C][C]0.310332[/C][/ROW]
[ROW][C]27[/C][C]-0.098641[/C][C]-0.837[/C][C]0.202681[/C][/ROW]
[ROW][C]28[/C][C]-0.081886[/C][C]-0.6948[/C][C]0.244701[/C][/ROW]
[ROW][C]29[/C][C]0.112833[/C][C]0.9574[/C][C]0.170779[/C][/ROW]
[ROW][C]30[/C][C]0.009412[/C][C]0.0799[/C][C]0.468283[/C][/ROW]
[ROW][C]31[/C][C]0.118873[/C][C]1.0087[/C][C]0.158256[/C][/ROW]
[ROW][C]32[/C][C]0.011468[/C][C]0.0973[/C][C]0.461375[/C][/ROW]
[ROW][C]33[/C][C]0.045817[/C][C]0.3888[/C][C]0.349296[/C][/ROW]
[ROW][C]34[/C][C]-0.123969[/C][C]-1.0519[/C][C]0.148179[/C][/ROW]
[ROW][C]35[/C][C]0.152051[/C][C]1.2902[/C][C]0.100556[/C][/ROW]
[ROW][C]36[/C][C]-0.124017[/C][C]-1.0523[/C][C]0.148087[/C][/ROW]
[ROW][C]37[/C][C]-0.127576[/C][C]-1.0825[/C][C]0.141318[/C][/ROW]
[ROW][C]38[/C][C]0.014197[/C][C]0.1205[/C][C]0.452225[/C][/ROW]
[ROW][C]39[/C][C]-0.088389[/C][C]-0.75[/C][C]0.227848[/C][/ROW]
[ROW][C]40[/C][C]-0.01583[/C][C]-0.1343[/C][C]0.44676[/C][/ROW]
[ROW][C]41[/C][C]-0.006756[/C][C]-0.0573[/C][C]0.477223[/C][/ROW]
[ROW][C]42[/C][C]0.022323[/C][C]0.1894[/C][C]0.425149[/C][/ROW]
[ROW][C]43[/C][C]0.037339[/C][C]0.3168[/C][C]0.376144[/C][/ROW]
[ROW][C]44[/C][C]-0.031314[/C][C]-0.2657[/C][C]0.395613[/C][/ROW]
[ROW][C]45[/C][C]-0.023194[/C][C]-0.1968[/C][C]0.422266[/C][/ROW]
[ROW][C]46[/C][C]-0.14399[/C][C]-1.2218[/C][C]0.112885[/C][/ROW]
[ROW][C]47[/C][C]0.05878[/C][C]0.4988[/C][C]0.309732[/C][/ROW]
[ROW][C]48[/C][C]-0.016921[/C][C]-0.1436[/C][C]0.443117[/C][/ROW]
[/TABLE]
Source: https://freestatistics.org/blog/index.php?pk=116225&T=2

Globally Unique Identifier (entire table): ba.freestatistics.org/blog/index.php?pk=116225&T=2

As an alternative you can also use a QR Code:  

The GUIDs for individual cells are displayed in the table below:

Partial Autocorrelation Function
Time lag kPACF(k)T-STATP-value
10.2145481.82050.036419
20.2507912.1280.018379
30.213551.8120.037076
40.059540.50520.307477
5-0.023438-0.19890.42146
60.0446410.37880.352977
7-0.020319-0.17240.431799
80.0571470.48490.314608
9-0.004626-0.03930.484398
10-0.196506-1.66740.049889
110.1714031.45440.07509
12-0.204202-1.73270.043714
13-0.113175-0.96030.170054
140.1386621.17660.121618
15-0.017392-0.14760.441546
16-0.035034-0.29730.383556
17-0.040023-0.33960.367572
18-0.013859-0.11760.453357
190.0533320.45250.326122
20-0.060747-0.51550.303908
21-0.111302-0.94440.174055
22-0.084807-0.71960.237046
230.0231740.19660.422331
24-0.12737-1.08080.141703
25-0.04333-0.36770.357098
26-0.058579-0.49710.310332
27-0.098641-0.8370.202681
28-0.081886-0.69480.244701
290.1128330.95740.170779
300.0094120.07990.468283
310.1188731.00870.158256
320.0114680.09730.461375
330.0458170.38880.349296
34-0.123969-1.05190.148179
350.1520511.29020.100556
36-0.124017-1.05230.148087
37-0.127576-1.08250.141318
380.0141970.12050.452225
39-0.088389-0.750.227848
40-0.01583-0.13430.44676
41-0.006756-0.05730.477223
420.0223230.18940.425149
430.0373390.31680.376144
44-0.031314-0.26570.395613
45-0.023194-0.19680.422266
46-0.14399-1.22180.112885
470.058780.49880.309732
48-0.016921-0.14360.443117


Parameters (Session):
par1 = 48 ; par2 = 1 ; par3 = 1 ; par4 = 1 ; par5 = 12 ; par6 = White Noise ; par7 = 0.95 ;
Parameters (R input):
par1 = 48 ; par2 = 1 ; par3 = 1 ; par4 = 1 ; par5 = 12 ; par6 = White Noise ; par7 = 0.95 ; par8 = ;
R code (references can be found in the software module):
if (par1 == 'Default') {
par1 = 10*log10(length(x))
} else {
par1 <- as.numeric(par1)
}
par2 <- as.numeric(par2)
par3 <- as.numeric(par3)
par4 <- as.numeric(par4)
par5 <- as.numeric(par5)
if (par6 == 'White Noise') par6 <- 'white' else par6 <- 'ma'
par7 <- as.numeric(par7)
if (par8 != '') par8 <- as.numeric(par8)
ox <- x
if (par8 == '') {
if (par2 == 0) {
x <- log(x)
} else {
x <- (x ^ par2 - 1) / par2
}
} else {
x <- log(x,base=par8)
}
if (par3 > 0) x <- diff(x,lag=1,difference=par3)
if (par4 > 0) x <- diff(x,lag=par5,difference=par4)
bitmap(file='picts.png')
op <- par(mfrow=c(2,1))
plot(ox,type='l',main='Original Time Series',xlab='time',ylab='value')
if (par8=='') {
mytitle <- paste('Working Time Series (lambda=',par2,', d=',par3,', D=',par4,')',sep='')
mysub <- paste('(lambda=',par2,', d=',par3,', D=',par4,', CI=', par7, ', CI type=',par6,')',sep='')
} else {
mytitle <- paste('Working Time Series (base=',par8,', d=',par3,', D=',par4,')',sep='')
mysub <- paste('(base=',par8,', d=',par3,', D=',par4,', CI=', par7, ', CI type=',par6,')',sep='')
}
plot(x,type='l', main=mytitle,xlab='time',ylab='value')
par(op)
dev.off()
bitmap(file='pic1.png')
racf <- acf(x, par1, main='Autocorrelation', xlab='time lag', ylab='ACF', ci.type=par6, ci=par7, sub=mysub)
dev.off()
bitmap(file='pic2.png')
rpacf <- pacf(x,par1,main='Partial Autocorrelation',xlab='lags',ylab='PACF',sub=mysub)
dev.off()
(myacf <- c(racf$acf))
(mypacf <- c(rpacf$acf))
lengthx <- length(x)
sqrtn <- sqrt(lengthx)
load(file='createtable')
a<-table.start()
a<-table.row.start(a)
a<-table.element(a,'Autocorrelation Function',4,TRUE)
a<-table.row.end(a)
a<-table.row.start(a)
a<-table.element(a,'Time lag k',header=TRUE)
a<-table.element(a,hyperlink('basics.htm','ACF(k)','click here for more information about the Autocorrelation Function'),header=TRUE)
a<-table.element(a,'T-STAT',header=TRUE)
a<-table.element(a,'P-value',header=TRUE)
a<-table.row.end(a)
for (i in 2:(par1+1)) {
a<-table.row.start(a)
a<-table.element(a,i-1,header=TRUE)
a<-table.element(a,round(myacf[i],6))
mytstat <- myacf[i]*sqrtn
a<-table.element(a,round(mytstat,4))
a<-table.element(a,round(1-pt(abs(mytstat),lengthx),6))
a<-table.row.end(a)
}
a<-table.end(a)
table.save(a,file='mytable.tab')
a<-table.start()
a<-table.row.start(a)
a<-table.element(a,'Partial Autocorrelation Function',4,TRUE)
a<-table.row.end(a)
a<-table.row.start(a)
a<-table.element(a,'Time lag k',header=TRUE)
a<-table.element(a,hyperlink('basics.htm','PACF(k)','click here for more information about the Partial Autocorrelation Function'),header=TRUE)
a<-table.element(a,'T-STAT',header=TRUE)
a<-table.element(a,'P-value',header=TRUE)
a<-table.row.end(a)
for (i in 1:par1) {
a<-table.row.start(a)
a<-table.element(a,i,header=TRUE)
a<-table.element(a,round(mypacf[i],6))
mytstat <- mypacf[i]*sqrtn
a<-table.element(a,round(mytstat,4))
a<-table.element(a,round(1-pt(abs(mytstat),lengthx),6))
a<-table.row.end(a)
}
a<-table.end(a)
table.save(a,file='mytable1.tab')