| Multiple Linear Regression - Estimated Regression Equation |
| ipi[t] = -70.5918402602645 + 1.92131992879401`tip `[t] -15.2527580996292M1[t] -9.41583810663133M2[t] -9.00345348001863M3[t] -12.3096963200716M4[t] -11.693757159947M5[t] -8.0483269034278M6[t] + 0.794772889364236M7[t] -26.5485279715176M8[t] -22.3276669390308M9[t] -26.2678700849142M10[t] -18.4759401990215M11[t] + e[t] |
| Multiple Linear Regression - Ordinary Least Squares | |||||
| Variable | Parameter | S.D. | T-STAT H0: parameter = 0 | 2-tail p-value | 1-tail p-value |
| (Intercept) | -70.5918402602645 | 13.335151 | -5.2937 | 3e-06 | 1e-06 |
| `tip ` | 1.92131992879401 | 0.133273 | 14.4164 | 0 | 0 |
| M1 | -15.2527580996292 | 4.089094 | -3.7301 | 0.000506 | 0.000253 |
| M2 | -9.41583810663133 | 4.305566 | -2.1869 | 0.033655 | 0.016828 |
| M3 | -9.00345348001863 | 4.604486 | -1.9554 | 0.056375 | 0.028188 |
| M4 | -12.3096963200716 | 4.36386 | -2.8208 | 0.006945 | 0.003473 |
| M5 | -11.693757159947 | 4.349111 | -2.6888 | 0.009831 | 0.004916 |
| M6 | -8.0483269034278 | 4.738012 | -1.6987 | 0.095855 | 0.047927 |
| M7 | 0.794772889364236 | 4.472748 | 0.1777 | 0.859712 | 0.429856 |
| M8 | -26.5485279715176 | 4.270743 | -6.2164 | 0 | 0 |
| M9 | -22.3276669390308 | 4.70953 | -4.741 | 1.9e-05 | 1e-05 |
| M10 | -26.2678700849142 | 4.753125 | -5.5264 | 1e-06 | 1e-06 |
| M11 | -18.4759401990215 | 4.416065 | -4.1838 | 0.000121 | 6.1e-05 |
| Multiple Linear Regression - Regression Statistics | |
| Multiple R | 0.94817767238409 |
| R-squared | 0.89904089840771 |
| Adjusted R-squared | 0.873801123009637 |
| F-TEST (value) | 35.6200039116181 |
| F-TEST (DF numerator) | 12 |
| F-TEST (DF denominator) | 48 |
| p-value | 0 |
| Multiple Linear Regression - Residual Statistics | |
| Residual Standard Deviation | 6.75211221609483 |
| Sum Squared Residuals | 2188.36893017938 |
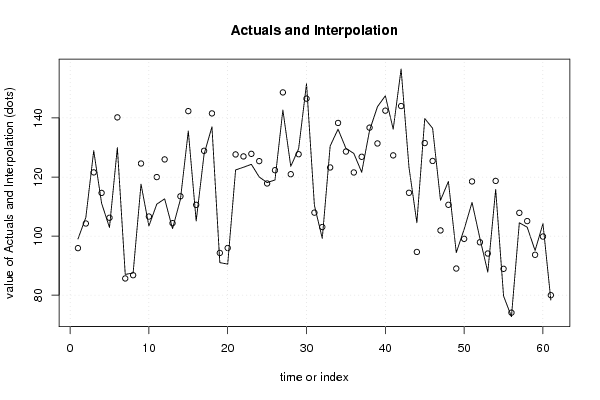
| Multiple Linear Regression - Actuals, Interpolation, and Residuals | |||
| Time or Index | Actuals | Interpolation Forecast | Residuals Prediction Error |
| 1 | 99 | 95.91226690402 | 3.08773309598005 |
| 2 | 106.3 | 104.24690280445 | 2.05309719554997 |
| 3 | 128.9 | 121.56690280445 | 7.33309719554998 |
| 4 | 111.1 | 114.610152099688 | -3.51015209968838 |
| 5 | 102.9 | 106.195887594481 | -3.29588759448116 |
| 6 | 130 | 140.198172725946 | -10.1981727259458 |
| 7 | 87 | 85.6377148685354 | 1.36228513146459 |
| 8 | 87.5 | 86.729948953805 | 0.77005104619506 |
| 9 | 117.6 | 124.573908740187 | -6.97390874018698 |
| 10 | 103.4 | 106.608070114107 | -3.20807011410722 |
| 11 | 110.8 | 119.971827793503 | -9.17182779350262 |
| 12 | 112.6 | 125.959188455363 | -13.3591884553630 |
| 13 | 102.5 | 104.366074590714 | -1.86607459071361 |
| 14 | 112.4 | 113.469238462661 | -1.06923846266127 |
| 15 | 135.6 | 142.317158035425 | -6.71715803542535 |
| 16 | 105.1 | 110.575380249221 | -5.47538024922097 |
| 17 | 127.7 | 128.867462754251 | -1.16746275425052 |
| 18 | 137 | 141.543096676102 | -4.54309667610157 |
| 19 | 91 | 94.2836545481085 | -3.28365454810847 |
| 20 | 90.5 | 95.9522846120162 | -5.45228461201619 |
| 21 | 122.4 | 127.648020626257 | -5.24802062625738 |
| 22 | 123.3 | 126.974061359324 | -3.67406135932376 |
| 23 | 124.3 | 127.849239501558 | -3.54923950155809 |
| 24 | 120 | 125.382792476725 | -5.38279247672481 |
| 25 | 118.1 | 117.815314092272 | 0.284685907728300 |
| 26 | 119 | 122.307310135114 | -3.30731013511372 |
| 27 | 142.7 | 148.657513800446 | -5.95751380044559 |
| 28 | 123.6 | 120.950507864709 | 2.64949213529138 |
| 29 | 129.6 | 127.714670796974 | 1.88532920302589 |
| 30 | 151.6 | 146.538528490966 | 5.06147150903398 |
| 31 | 110.4 | 107.925026042546 | 2.47497395745407 |
| 32 | 99.2 | 103.061168348554 | -3.86116834855404 |
| 33 | 130.5 | 123.228984790031 | 7.27101520996883 |
| 34 | 136.2 | 138.309848939208 | -2.10984893920845 |
| 35 | 129.7 | 128.617767473076 | 1.08223252692431 |
| 36 | 128 | 121.540152619137 | 6.45984738086321 |
| 37 | 121.6 | 126.845517757604 | -5.24551775760356 |
| 38 | 135.8 | 136.717209601069 | -0.917209601068798 |
| 39 | 143.8 | 131.365634441299 | 12.4343655587005 |
| 40 | 147.5 | 142.469291067202 | 5.03070893279844 |
| 41 | 136.2 | 127.330406811215 | 8.8695931887847 |
| 42 | 156.6 | 144.040812583534 | 12.5591874164662 |
| 43 | 123.3 | 114.649645793325 | 8.65035420667502 |
| 44 | 104.5 | 94.6073606618604 | 9.89263933813961 |
| 45 | 139.8 | 131.490660483845 | 8.3093395161546 |
| 46 | 136.5 | 125.437005416289 | 11.0629945837114 |
| 47 | 112.1 | 101.911420462839 | 10.1885795371611 |
| 48 | 118.5 | 110.588629025011 | 7.91137097498908 |
| 49 | 94.4 | 88.9955151603615 | 5.40448483963849 |
| 50 | 102.3 | 99.0593389967062 | 3.24066100329381 |
| 51 | 111.4 | 118.492790918380 | -7.09279091837958 |
| 52 | 99.2 | 97.8946687191805 | 1.30533128081953 |
| 53 | 87.8 | 94.0915720430789 | -6.2915720430789 |
| 54 | 115.8 | 118.679389523453 | -2.87938952345284 |
| 55 | 79.7 | 88.9039587474852 | -9.2039587474852 |
| 56 | 72.7 | 74.0492374237645 | -1.34923742376444 |
| 57 | 104.5 | 107.858425359679 | -3.35842535967907 |
| 58 | 103 | 105.071014171072 | -2.07101417107201 |
| 59 | 95.1 | 93.6497447690247 | 1.45025523097534 |
| 60 | 104.2 | 99.8292374237645 | 4.37076257623554 |
| 61 | 78.3 | 79.9653114950297 | -1.66531149502966 |
| Goldfeld-Quandt test for Heteroskedasticity | |||
| p-values | Alternative Hypothesis | ||
| breakpoint index | greater | 2-sided | less |
| 16 | 0.0416459383256458 | 0.0832918766512917 | 0.958354061674354 |
| 17 | 0.208754920828958 | 0.417509841657916 | 0.791245079171042 |
| 18 | 0.171437152055514 | 0.342874304111028 | 0.828562847944486 |
| 19 | 0.0975249229766727 | 0.195049845953345 | 0.902475077023327 |
| 20 | 0.0610022263551397 | 0.122004452710279 | 0.93899777364486 |
| 21 | 0.0381365527066469 | 0.0762731054132939 | 0.961863447293353 |
| 22 | 0.0276237807804865 | 0.0552475615609729 | 0.972376219219514 |
| 23 | 0.0318658801987914 | 0.0637317603975828 | 0.968134119801209 |
| 24 | 0.0476127306373149 | 0.0952254612746297 | 0.952387269362685 |
| 25 | 0.0289898711285964 | 0.0579797422571929 | 0.971010128871404 |
| 26 | 0.0164946287955907 | 0.0329892575911813 | 0.98350537120441 |
| 27 | 0.0139705808580587 | 0.0279411617161173 | 0.986029419141941 |
| 28 | 0.0206662584328961 | 0.0413325168657921 | 0.979333741567104 |
| 29 | 0.0164045903461241 | 0.0328091806922482 | 0.983595409653876 |
| 30 | 0.0457404509185833 | 0.0914809018371666 | 0.954259549081417 |
| 31 | 0.0327353438341914 | 0.0654706876683828 | 0.967264656165809 |
| 32 | 0.0275351325346125 | 0.0550702650692251 | 0.972464867465388 |
| 33 | 0.0524827271677833 | 0.104965454335567 | 0.947517272832217 |
| 34 | 0.0478790895483947 | 0.0957581790967894 | 0.952120910451605 |
| 35 | 0.0602685126401806 | 0.120537025280361 | 0.93973148735982 |
| 36 | 0.103066138786688 | 0.206132277573375 | 0.896933861213312 |
| 37 | 0.252917453800927 | 0.505834907601854 | 0.747082546199073 |
| 38 | 0.496625835210786 | 0.993251670421571 | 0.503374164789214 |
| 39 | 0.778144136377215 | 0.443711727245571 | 0.221855863622785 |
| 40 | 0.998771992681473 | 0.00245601463705438 | 0.00122800731852719 |
| 41 | 0.999054459359756 | 0.00189108128048877 | 0.000945540640244383 |
| 42 | 0.99777104506156 | 0.00445790987687922 | 0.00222895493843961 |
| 43 | 0.99525383544556 | 0.00949232910887979 | 0.00474616455443989 |
| 44 | 0.984881253675234 | 0.0302374926495327 | 0.0151187463247663 |
| 45 | 0.964707601808473 | 0.0705847963830542 | 0.0352923981915271 |
| Meta Analysis of Goldfeld-Quandt test for Heteroskedasticity | |||
| Description | # significant tests | % significant tests | OK/NOK |
| 1% type I error level | 4 | 0.133333333333333 | NOK |
| 5% type I error level | 9 | 0.3 | NOK |
| 10% type I error level | 20 | 0.666666666666667 | NOK |