Free Statistics

of Irreproducible Research!

Author's title

Author*The author of this computation has been verified*
R Software Modulerwasp_multipleregression.wasp
Title produced by softwareMultiple Regression
Date of computationTue, 28 Dec 2010 00:44:59 +0000
Cite this page as followsStatistical Computations at FreeStatistics.org, Office for Research Development and Education, URL https://freestatistics.org/blog/index.php?v=date/2010/Dec/28/t1293497011gige8uvplb3glud.htm/, Retrieved Sun, 05 May 2024 07:22:42 +0000
Statistical Computations at FreeStatistics.org, Office for Research Development and Education, URL https://freestatistics.org/blog/index.php?pk=116206, Retrieved Sun, 05 May 2024 07:22:42 +0000
QR Codes:

Original text written by user:
IsPrivate?No (this computation is public)
User-defined keywords
Estimated Impact215
Family? (F = Feedback message, R = changed R code, M = changed R Module, P = changed Parameters, D = changed Data)
-       [Multiple Regression] [] [2010-12-28 00:44:59] [c984196f1244e05baf3e7c2e52d47a33] [Current]
Feedback Forum

Post a new message
Dataseries X:
99	94.6
106.3	95.9
128.9	104.7
111.1	102.8
102.9	98.1
130	113.9
87	80.9
87.5	95.7
117.6	113.2
103.4	105.9
110.8	108.8
112.6	102.3
102.5	99
112.4	100.7
135.6	115.5
105.1	100.7
127.7	109.9
137	114.6
91	85.4
90.5	100.5
122.4	114.8
123.3	116.5
124.3	112.9
120	102
118.1	106
119	105.3
142.7	118.8
123.6	106.1
129.6	109.3
151.6	117.2
110.4	92.5
99.2	104.2
130.5	112.5
136.2	122.4
129.7	113.3
128	100
121.6	110.7
135.8	112.8
143.8	109.8
147.5	117.3
136.2	109.1
156.6	115.9
123.3	96
104.5	99.8
139.8	116.8
136.5	115.7
112.1	99.4
118.5	94.3
94.4	91
102.3	93.2
111.4	103.1
99.2	94.1
87.8	91.8
115.8	102.7
79.7	82.6
72.7	89.1
104.5	104.5
103	105.1
95.1	95.1
104.2	88.7
78.3	86.3


Summary of computational transaction
Raw Inputview raw input (R code)
Raw Outputview raw output of R engine
Computing time5 seconds
R Server'Sir Ronald Aylmer Fisher' @ 193.190.124.24
R Framework error message
The field 'Names of X columns' contains a hard return which cannot be interpreted.
Please, resubmit your request without hard returns in the 'Names of X columns'.

\begin{tabular}{lllllllll}
\hline
Summary of computational transaction \tabularnewline
Raw Input & view raw input (R code)  \tabularnewline
Raw Output & view raw output of R engine  \tabularnewline
Computing time & 5 seconds \tabularnewline
R Server & 'Sir Ronald Aylmer Fisher' @ 193.190.124.24 \tabularnewline
R Framework error message & 
The field 'Names of X columns' contains a hard return which cannot be interpreted.
Please, resubmit your request without hard returns in the 'Names of X columns'.
\tabularnewline \hline \end{tabular} %Source: https://freestatistics.org/blog/index.php?pk=116206&T=0

[TABLE]
[ROW][C]Summary of computational transaction[/C][/ROW]
[ROW][C]Raw Input[/C][C]view raw input (R code) [/C][/ROW]
[ROW][C]Raw Output[/C][C]view raw output of R engine [/C][/ROW]
[ROW][C]Computing time[/C][C]5 seconds[/C][/ROW]
[ROW][C]R Server[/C][C]'Sir Ronald Aylmer Fisher' @ 193.190.124.24[/C][/ROW]
[ROW][C]R Framework error message[/C][C]
The field 'Names of X columns' contains a hard return which cannot be interpreted.
Please, resubmit your request without hard returns in the 'Names of X columns'.
[/C][/ROW] [/TABLE] Source: https://freestatistics.org/blog/index.php?pk=116206&T=0

Globally Unique Identifier (entire table): ba.freestatistics.org/blog/index.php?pk=116206&T=0

As an alternative you can also use a QR Code:  

The GUIDs for individual cells are displayed in the table below:

Summary of computational transaction
Raw Inputview raw input (R code)
Raw Outputview raw output of R engine
Computing time5 seconds
R Server'Sir Ronald Aylmer Fisher' @ 193.190.124.24
R Framework error message
The field 'Names of X columns' contains a hard return which cannot be interpreted.
Please, resubmit your request without hard returns in the 'Names of X columns'.


Multiple Linear Regression - Estimated Regression Equation
ipi[t] = -70.5918402602645 + 1.92131992879401`tip `[t] -15.2527580996292M1[t] -9.41583810663133M2[t] -9.00345348001863M3[t] -12.3096963200716M4[t] -11.693757159947M5[t] -8.0483269034278M6[t] + 0.794772889364236M7[t] -26.5485279715176M8[t] -22.3276669390308M9[t] -26.2678700849142M10[t] -18.4759401990215M11[t] + e[t]

\begin{tabular}{lllllllll}
\hline
Multiple Linear Regression - Estimated Regression Equation \tabularnewline
ipi[t] =  -70.5918402602645 +  1.92131992879401`tip
`[t] -15.2527580996292M1[t] -9.41583810663133M2[t] -9.00345348001863M3[t] -12.3096963200716M4[t] -11.693757159947M5[t] -8.0483269034278M6[t] +  0.794772889364236M7[t] -26.5485279715176M8[t] -22.3276669390308M9[t] -26.2678700849142M10[t] -18.4759401990215M11[t]  + e[t] \tabularnewline
\hline
\end{tabular}
%Source: https://freestatistics.org/blog/index.php?pk=116206&T=1

[TABLE]
[ROW][C]Multiple Linear Regression - Estimated Regression Equation[/C][/ROW]
[ROW][C]ipi[t] =  -70.5918402602645 +  1.92131992879401`tip
`[t] -15.2527580996292M1[t] -9.41583810663133M2[t] -9.00345348001863M3[t] -12.3096963200716M4[t] -11.693757159947M5[t] -8.0483269034278M6[t] +  0.794772889364236M7[t] -26.5485279715176M8[t] -22.3276669390308M9[t] -26.2678700849142M10[t] -18.4759401990215M11[t]  + e[t][/C][/ROW]
[/TABLE]
Source: https://freestatistics.org/blog/index.php?pk=116206&T=1

Globally Unique Identifier (entire table): ba.freestatistics.org/blog/index.php?pk=116206&T=1

As an alternative you can also use a QR Code:  

The GUIDs for individual cells are displayed in the table below:

Multiple Linear Regression - Estimated Regression Equation
ipi[t] = -70.5918402602645 + 1.92131992879401`tip `[t] -15.2527580996292M1[t] -9.41583810663133M2[t] -9.00345348001863M3[t] -12.3096963200716M4[t] -11.693757159947M5[t] -8.0483269034278M6[t] + 0.794772889364236M7[t] -26.5485279715176M8[t] -22.3276669390308M9[t] -26.2678700849142M10[t] -18.4759401990215M11[t] + e[t]


Multiple Linear Regression - Ordinary Least Squares
VariableParameterS.D.T-STATH0: parameter = 02-tail p-value1-tail p-value
(Intercept)-70.591840260264513.335151-5.29373e-061e-06
`tip `1.921319928794010.13327314.416400
M1-15.25275809962924.089094-3.73010.0005060.000253
M2-9.415838106631334.305566-2.18690.0336550.016828
M3-9.003453480018634.604486-1.95540.0563750.028188
M4-12.30969632007164.36386-2.82080.0069450.003473
M5-11.6937571599474.349111-2.68880.0098310.004916
M6-8.04832690342784.738012-1.69870.0958550.047927
M70.7947728893642364.4727480.17770.8597120.429856
M8-26.54852797151764.270743-6.216400
M9-22.32766693903084.70953-4.7411.9e-051e-05
M10-26.26787008491424.753125-5.52641e-061e-06
M11-18.47594019902154.416065-4.18380.0001216.1e-05

\begin{tabular}{lllllllll}
\hline
Multiple Linear Regression - Ordinary Least Squares \tabularnewline
Variable & Parameter & S.D. & T-STATH0: parameter = 0 & 2-tail p-value & 1-tail p-value \tabularnewline
(Intercept) & -70.5918402602645 & 13.335151 & -5.2937 & 3e-06 & 1e-06 \tabularnewline
`tip
` & 1.92131992879401 & 0.133273 & 14.4164 & 0 & 0 \tabularnewline
M1 & -15.2527580996292 & 4.089094 & -3.7301 & 0.000506 & 0.000253 \tabularnewline
M2 & -9.41583810663133 & 4.305566 & -2.1869 & 0.033655 & 0.016828 \tabularnewline
M3 & -9.00345348001863 & 4.604486 & -1.9554 & 0.056375 & 0.028188 \tabularnewline
M4 & -12.3096963200716 & 4.36386 & -2.8208 & 0.006945 & 0.003473 \tabularnewline
M5 & -11.693757159947 & 4.349111 & -2.6888 & 0.009831 & 0.004916 \tabularnewline
M6 & -8.0483269034278 & 4.738012 & -1.6987 & 0.095855 & 0.047927 \tabularnewline
M7 & 0.794772889364236 & 4.472748 & 0.1777 & 0.859712 & 0.429856 \tabularnewline
M8 & -26.5485279715176 & 4.270743 & -6.2164 & 0 & 0 \tabularnewline
M9 & -22.3276669390308 & 4.70953 & -4.741 & 1.9e-05 & 1e-05 \tabularnewline
M10 & -26.2678700849142 & 4.753125 & -5.5264 & 1e-06 & 1e-06 \tabularnewline
M11 & -18.4759401990215 & 4.416065 & -4.1838 & 0.000121 & 6.1e-05 \tabularnewline
\hline
\end{tabular}
%Source: https://freestatistics.org/blog/index.php?pk=116206&T=2

[TABLE]
[ROW][C]Multiple Linear Regression - Ordinary Least Squares[/C][/ROW]
[ROW][C]Variable[/C][C]Parameter[/C][C]S.D.[/C][C]T-STATH0: parameter = 0[/C][C]2-tail p-value[/C][C]1-tail p-value[/C][/ROW]
[ROW][C](Intercept)[/C][C]-70.5918402602645[/C][C]13.335151[/C][C]-5.2937[/C][C]3e-06[/C][C]1e-06[/C][/ROW]
[ROW][C]`tip
`[/C][C]1.92131992879401[/C][C]0.133273[/C][C]14.4164[/C][C]0[/C][C]0[/C][/ROW]
[ROW][C]M1[/C][C]-15.2527580996292[/C][C]4.089094[/C][C]-3.7301[/C][C]0.000506[/C][C]0.000253[/C][/ROW]
[ROW][C]M2[/C][C]-9.41583810663133[/C][C]4.305566[/C][C]-2.1869[/C][C]0.033655[/C][C]0.016828[/C][/ROW]
[ROW][C]M3[/C][C]-9.00345348001863[/C][C]4.604486[/C][C]-1.9554[/C][C]0.056375[/C][C]0.028188[/C][/ROW]
[ROW][C]M4[/C][C]-12.3096963200716[/C][C]4.36386[/C][C]-2.8208[/C][C]0.006945[/C][C]0.003473[/C][/ROW]
[ROW][C]M5[/C][C]-11.693757159947[/C][C]4.349111[/C][C]-2.6888[/C][C]0.009831[/C][C]0.004916[/C][/ROW]
[ROW][C]M6[/C][C]-8.0483269034278[/C][C]4.738012[/C][C]-1.6987[/C][C]0.095855[/C][C]0.047927[/C][/ROW]
[ROW][C]M7[/C][C]0.794772889364236[/C][C]4.472748[/C][C]0.1777[/C][C]0.859712[/C][C]0.429856[/C][/ROW]
[ROW][C]M8[/C][C]-26.5485279715176[/C][C]4.270743[/C][C]-6.2164[/C][C]0[/C][C]0[/C][/ROW]
[ROW][C]M9[/C][C]-22.3276669390308[/C][C]4.70953[/C][C]-4.741[/C][C]1.9e-05[/C][C]1e-05[/C][/ROW]
[ROW][C]M10[/C][C]-26.2678700849142[/C][C]4.753125[/C][C]-5.5264[/C][C]1e-06[/C][C]1e-06[/C][/ROW]
[ROW][C]M11[/C][C]-18.4759401990215[/C][C]4.416065[/C][C]-4.1838[/C][C]0.000121[/C][C]6.1e-05[/C][/ROW]
[/TABLE]
Source: https://freestatistics.org/blog/index.php?pk=116206&T=2

Globally Unique Identifier (entire table): ba.freestatistics.org/blog/index.php?pk=116206&T=2

As an alternative you can also use a QR Code:  

The GUIDs for individual cells are displayed in the table below:

Multiple Linear Regression - Ordinary Least Squares
VariableParameterS.D.T-STATH0: parameter = 02-tail p-value1-tail p-value
(Intercept)-70.591840260264513.335151-5.29373e-061e-06
`tip `1.921319928794010.13327314.416400
M1-15.25275809962924.089094-3.73010.0005060.000253
M2-9.415838106631334.305566-2.18690.0336550.016828
M3-9.003453480018634.604486-1.95540.0563750.028188
M4-12.30969632007164.36386-2.82080.0069450.003473
M5-11.6937571599474.349111-2.68880.0098310.004916
M6-8.04832690342784.738012-1.69870.0958550.047927
M70.7947728893642364.4727480.17770.8597120.429856
M8-26.54852797151764.270743-6.216400
M9-22.32766693903084.70953-4.7411.9e-051e-05
M10-26.26787008491424.753125-5.52641e-061e-06
M11-18.47594019902154.416065-4.18380.0001216.1e-05


Multiple Linear Regression - Regression Statistics
Multiple R0.94817767238409
R-squared0.89904089840771
Adjusted R-squared0.873801123009637
F-TEST (value)35.6200039116181
F-TEST (DF numerator)12
F-TEST (DF denominator)48
p-value0
Multiple Linear Regression - Residual Statistics
Residual Standard Deviation6.75211221609483
Sum Squared Residuals2188.36893017938

\begin{tabular}{lllllllll}
\hline
Multiple Linear Regression - Regression Statistics \tabularnewline
Multiple R & 0.94817767238409 \tabularnewline
R-squared & 0.89904089840771 \tabularnewline
Adjusted R-squared & 0.873801123009637 \tabularnewline
F-TEST (value) & 35.6200039116181 \tabularnewline
F-TEST (DF numerator) & 12 \tabularnewline
F-TEST (DF denominator) & 48 \tabularnewline
p-value & 0 \tabularnewline
Multiple Linear Regression - Residual Statistics \tabularnewline
Residual Standard Deviation & 6.75211221609483 \tabularnewline
Sum Squared Residuals & 2188.36893017938 \tabularnewline
\hline
\end{tabular}
%Source: https://freestatistics.org/blog/index.php?pk=116206&T=3

[TABLE]
[ROW][C]Multiple Linear Regression - Regression Statistics[/C][/ROW]
[ROW][C]Multiple R[/C][C]0.94817767238409[/C][/ROW]
[ROW][C]R-squared[/C][C]0.89904089840771[/C][/ROW]
[ROW][C]Adjusted R-squared[/C][C]0.873801123009637[/C][/ROW]
[ROW][C]F-TEST (value)[/C][C]35.6200039116181[/C][/ROW]
[ROW][C]F-TEST (DF numerator)[/C][C]12[/C][/ROW]
[ROW][C]F-TEST (DF denominator)[/C][C]48[/C][/ROW]
[ROW][C]p-value[/C][C]0[/C][/ROW]
[ROW][C]Multiple Linear Regression - Residual Statistics[/C][/ROW]
[ROW][C]Residual Standard Deviation[/C][C]6.75211221609483[/C][/ROW]
[ROW][C]Sum Squared Residuals[/C][C]2188.36893017938[/C][/ROW]
[/TABLE]
Source: https://freestatistics.org/blog/index.php?pk=116206&T=3

Globally Unique Identifier (entire table): ba.freestatistics.org/blog/index.php?pk=116206&T=3

As an alternative you can also use a QR Code:  

The GUIDs for individual cells are displayed in the table below:

Multiple Linear Regression - Regression Statistics
Multiple R0.94817767238409
R-squared0.89904089840771
Adjusted R-squared0.873801123009637
F-TEST (value)35.6200039116181
F-TEST (DF numerator)12
F-TEST (DF denominator)48
p-value0
Multiple Linear Regression - Residual Statistics
Residual Standard Deviation6.75211221609483
Sum Squared Residuals2188.36893017938


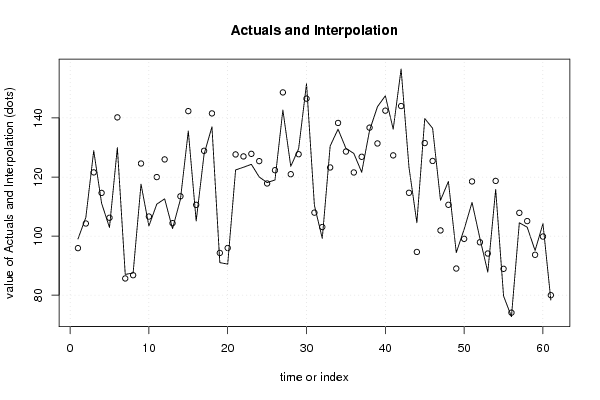
Multiple Linear Regression - Actuals, Interpolation, and Residuals
Time or IndexActualsInterpolationForecastResidualsPrediction Error
19995.912266904023.08773309598005
2106.3104.246902804452.05309719554997
3128.9121.566902804457.33309719554998
4111.1114.610152099688-3.51015209968838
5102.9106.195887594481-3.29588759448116
6130140.198172725946-10.1981727259458
78785.63771486853541.36228513146459
887.586.7299489538050.77005104619506
9117.6124.573908740187-6.97390874018698
10103.4106.608070114107-3.20807011410722
11110.8119.971827793503-9.17182779350262
12112.6125.959188455363-13.3591884553630
13102.5104.366074590714-1.86607459071361
14112.4113.469238462661-1.06923846266127
15135.6142.317158035425-6.71715803542535
16105.1110.575380249221-5.47538024922097
17127.7128.867462754251-1.16746275425052
18137141.543096676102-4.54309667610157
199194.2836545481085-3.28365454810847
2090.595.9522846120162-5.45228461201619
21122.4127.648020626257-5.24802062625738
22123.3126.974061359324-3.67406135932376
23124.3127.849239501558-3.54923950155809
24120125.382792476725-5.38279247672481
25118.1117.8153140922720.284685907728300
26119122.307310135114-3.30731013511372
27142.7148.657513800446-5.95751380044559
28123.6120.9505078647092.64949213529138
29129.6127.7146707969741.88532920302589
30151.6146.5385284909665.06147150903398
31110.4107.9250260425462.47497395745407
3299.2103.061168348554-3.86116834855404
33130.5123.2289847900317.27101520996883
34136.2138.309848939208-2.10984893920845
35129.7128.6177674730761.08223252692431
36128121.5401526191376.45984738086321
37121.6126.845517757604-5.24551775760356
38135.8136.717209601069-0.917209601068798
39143.8131.36563444129912.4343655587005
40147.5142.4692910672025.03070893279844
41136.2127.3304068112158.8695931887847
42156.6144.04081258353412.5591874164662
43123.3114.6496457933258.65035420667502
44104.594.60736066186049.89263933813961
45139.8131.4906604838458.3093395161546
46136.5125.43700541628911.0629945837114
47112.1101.91142046283910.1885795371611
48118.5110.5886290250117.91137097498908
4994.488.99551516036155.40448483963849
50102.399.05933899670623.24066100329381
51111.4118.492790918380-7.09279091837958
5299.297.89466871918051.30533128081953
5387.894.0915720430789-6.2915720430789
54115.8118.679389523453-2.87938952345284
5579.788.9039587474852-9.2039587474852
5672.774.0492374237645-1.34923742376444
57104.5107.858425359679-3.35842535967907
58103105.071014171072-2.07101417107201
5995.193.64974476902471.45025523097534
60104.299.82923742376454.37076257623554
6178.379.9653114950297-1.66531149502966

\begin{tabular}{lllllllll}
\hline
Multiple Linear Regression - Actuals, Interpolation, and Residuals \tabularnewline
Time or Index & Actuals & InterpolationForecast & ResidualsPrediction Error \tabularnewline
1 & 99 & 95.91226690402 & 3.08773309598005 \tabularnewline
2 & 106.3 & 104.24690280445 & 2.05309719554997 \tabularnewline
3 & 128.9 & 121.56690280445 & 7.33309719554998 \tabularnewline
4 & 111.1 & 114.610152099688 & -3.51015209968838 \tabularnewline
5 & 102.9 & 106.195887594481 & -3.29588759448116 \tabularnewline
6 & 130 & 140.198172725946 & -10.1981727259458 \tabularnewline
7 & 87 & 85.6377148685354 & 1.36228513146459 \tabularnewline
8 & 87.5 & 86.729948953805 & 0.77005104619506 \tabularnewline
9 & 117.6 & 124.573908740187 & -6.97390874018698 \tabularnewline
10 & 103.4 & 106.608070114107 & -3.20807011410722 \tabularnewline
11 & 110.8 & 119.971827793503 & -9.17182779350262 \tabularnewline
12 & 112.6 & 125.959188455363 & -13.3591884553630 \tabularnewline
13 & 102.5 & 104.366074590714 & -1.86607459071361 \tabularnewline
14 & 112.4 & 113.469238462661 & -1.06923846266127 \tabularnewline
15 & 135.6 & 142.317158035425 & -6.71715803542535 \tabularnewline
16 & 105.1 & 110.575380249221 & -5.47538024922097 \tabularnewline
17 & 127.7 & 128.867462754251 & -1.16746275425052 \tabularnewline
18 & 137 & 141.543096676102 & -4.54309667610157 \tabularnewline
19 & 91 & 94.2836545481085 & -3.28365454810847 \tabularnewline
20 & 90.5 & 95.9522846120162 & -5.45228461201619 \tabularnewline
21 & 122.4 & 127.648020626257 & -5.24802062625738 \tabularnewline
22 & 123.3 & 126.974061359324 & -3.67406135932376 \tabularnewline
23 & 124.3 & 127.849239501558 & -3.54923950155809 \tabularnewline
24 & 120 & 125.382792476725 & -5.38279247672481 \tabularnewline
25 & 118.1 & 117.815314092272 & 0.284685907728300 \tabularnewline
26 & 119 & 122.307310135114 & -3.30731013511372 \tabularnewline
27 & 142.7 & 148.657513800446 & -5.95751380044559 \tabularnewline
28 & 123.6 & 120.950507864709 & 2.64949213529138 \tabularnewline
29 & 129.6 & 127.714670796974 & 1.88532920302589 \tabularnewline
30 & 151.6 & 146.538528490966 & 5.06147150903398 \tabularnewline
31 & 110.4 & 107.925026042546 & 2.47497395745407 \tabularnewline
32 & 99.2 & 103.061168348554 & -3.86116834855404 \tabularnewline
33 & 130.5 & 123.228984790031 & 7.27101520996883 \tabularnewline
34 & 136.2 & 138.309848939208 & -2.10984893920845 \tabularnewline
35 & 129.7 & 128.617767473076 & 1.08223252692431 \tabularnewline
36 & 128 & 121.540152619137 & 6.45984738086321 \tabularnewline
37 & 121.6 & 126.845517757604 & -5.24551775760356 \tabularnewline
38 & 135.8 & 136.717209601069 & -0.917209601068798 \tabularnewline
39 & 143.8 & 131.365634441299 & 12.4343655587005 \tabularnewline
40 & 147.5 & 142.469291067202 & 5.03070893279844 \tabularnewline
41 & 136.2 & 127.330406811215 & 8.8695931887847 \tabularnewline
42 & 156.6 & 144.040812583534 & 12.5591874164662 \tabularnewline
43 & 123.3 & 114.649645793325 & 8.65035420667502 \tabularnewline
44 & 104.5 & 94.6073606618604 & 9.89263933813961 \tabularnewline
45 & 139.8 & 131.490660483845 & 8.3093395161546 \tabularnewline
46 & 136.5 & 125.437005416289 & 11.0629945837114 \tabularnewline
47 & 112.1 & 101.911420462839 & 10.1885795371611 \tabularnewline
48 & 118.5 & 110.588629025011 & 7.91137097498908 \tabularnewline
49 & 94.4 & 88.9955151603615 & 5.40448483963849 \tabularnewline
50 & 102.3 & 99.0593389967062 & 3.24066100329381 \tabularnewline
51 & 111.4 & 118.492790918380 & -7.09279091837958 \tabularnewline
52 & 99.2 & 97.8946687191805 & 1.30533128081953 \tabularnewline
53 & 87.8 & 94.0915720430789 & -6.2915720430789 \tabularnewline
54 & 115.8 & 118.679389523453 & -2.87938952345284 \tabularnewline
55 & 79.7 & 88.9039587474852 & -9.2039587474852 \tabularnewline
56 & 72.7 & 74.0492374237645 & -1.34923742376444 \tabularnewline
57 & 104.5 & 107.858425359679 & -3.35842535967907 \tabularnewline
58 & 103 & 105.071014171072 & -2.07101417107201 \tabularnewline
59 & 95.1 & 93.6497447690247 & 1.45025523097534 \tabularnewline
60 & 104.2 & 99.8292374237645 & 4.37076257623554 \tabularnewline
61 & 78.3 & 79.9653114950297 & -1.66531149502966 \tabularnewline
\hline
\end{tabular}
%Source: https://freestatistics.org/blog/index.php?pk=116206&T=4

[TABLE]
[ROW][C]Multiple Linear Regression - Actuals, Interpolation, and Residuals[/C][/ROW]
[ROW][C]Time or Index[/C][C]Actuals[/C][C]InterpolationForecast[/C][C]ResidualsPrediction Error[/C][/ROW]
[ROW][C]1[/C][C]99[/C][C]95.91226690402[/C][C]3.08773309598005[/C][/ROW]
[ROW][C]2[/C][C]106.3[/C][C]104.24690280445[/C][C]2.05309719554997[/C][/ROW]
[ROW][C]3[/C][C]128.9[/C][C]121.56690280445[/C][C]7.33309719554998[/C][/ROW]
[ROW][C]4[/C][C]111.1[/C][C]114.610152099688[/C][C]-3.51015209968838[/C][/ROW]
[ROW][C]5[/C][C]102.9[/C][C]106.195887594481[/C][C]-3.29588759448116[/C][/ROW]
[ROW][C]6[/C][C]130[/C][C]140.198172725946[/C][C]-10.1981727259458[/C][/ROW]
[ROW][C]7[/C][C]87[/C][C]85.6377148685354[/C][C]1.36228513146459[/C][/ROW]
[ROW][C]8[/C][C]87.5[/C][C]86.729948953805[/C][C]0.77005104619506[/C][/ROW]
[ROW][C]9[/C][C]117.6[/C][C]124.573908740187[/C][C]-6.97390874018698[/C][/ROW]
[ROW][C]10[/C][C]103.4[/C][C]106.608070114107[/C][C]-3.20807011410722[/C][/ROW]
[ROW][C]11[/C][C]110.8[/C][C]119.971827793503[/C][C]-9.17182779350262[/C][/ROW]
[ROW][C]12[/C][C]112.6[/C][C]125.959188455363[/C][C]-13.3591884553630[/C][/ROW]
[ROW][C]13[/C][C]102.5[/C][C]104.366074590714[/C][C]-1.86607459071361[/C][/ROW]
[ROW][C]14[/C][C]112.4[/C][C]113.469238462661[/C][C]-1.06923846266127[/C][/ROW]
[ROW][C]15[/C][C]135.6[/C][C]142.317158035425[/C][C]-6.71715803542535[/C][/ROW]
[ROW][C]16[/C][C]105.1[/C][C]110.575380249221[/C][C]-5.47538024922097[/C][/ROW]
[ROW][C]17[/C][C]127.7[/C][C]128.867462754251[/C][C]-1.16746275425052[/C][/ROW]
[ROW][C]18[/C][C]137[/C][C]141.543096676102[/C][C]-4.54309667610157[/C][/ROW]
[ROW][C]19[/C][C]91[/C][C]94.2836545481085[/C][C]-3.28365454810847[/C][/ROW]
[ROW][C]20[/C][C]90.5[/C][C]95.9522846120162[/C][C]-5.45228461201619[/C][/ROW]
[ROW][C]21[/C][C]122.4[/C][C]127.648020626257[/C][C]-5.24802062625738[/C][/ROW]
[ROW][C]22[/C][C]123.3[/C][C]126.974061359324[/C][C]-3.67406135932376[/C][/ROW]
[ROW][C]23[/C][C]124.3[/C][C]127.849239501558[/C][C]-3.54923950155809[/C][/ROW]
[ROW][C]24[/C][C]120[/C][C]125.382792476725[/C][C]-5.38279247672481[/C][/ROW]
[ROW][C]25[/C][C]118.1[/C][C]117.815314092272[/C][C]0.284685907728300[/C][/ROW]
[ROW][C]26[/C][C]119[/C][C]122.307310135114[/C][C]-3.30731013511372[/C][/ROW]
[ROW][C]27[/C][C]142.7[/C][C]148.657513800446[/C][C]-5.95751380044559[/C][/ROW]
[ROW][C]28[/C][C]123.6[/C][C]120.950507864709[/C][C]2.64949213529138[/C][/ROW]
[ROW][C]29[/C][C]129.6[/C][C]127.714670796974[/C][C]1.88532920302589[/C][/ROW]
[ROW][C]30[/C][C]151.6[/C][C]146.538528490966[/C][C]5.06147150903398[/C][/ROW]
[ROW][C]31[/C][C]110.4[/C][C]107.925026042546[/C][C]2.47497395745407[/C][/ROW]
[ROW][C]32[/C][C]99.2[/C][C]103.061168348554[/C][C]-3.86116834855404[/C][/ROW]
[ROW][C]33[/C][C]130.5[/C][C]123.228984790031[/C][C]7.27101520996883[/C][/ROW]
[ROW][C]34[/C][C]136.2[/C][C]138.309848939208[/C][C]-2.10984893920845[/C][/ROW]
[ROW][C]35[/C][C]129.7[/C][C]128.617767473076[/C][C]1.08223252692431[/C][/ROW]
[ROW][C]36[/C][C]128[/C][C]121.540152619137[/C][C]6.45984738086321[/C][/ROW]
[ROW][C]37[/C][C]121.6[/C][C]126.845517757604[/C][C]-5.24551775760356[/C][/ROW]
[ROW][C]38[/C][C]135.8[/C][C]136.717209601069[/C][C]-0.917209601068798[/C][/ROW]
[ROW][C]39[/C][C]143.8[/C][C]131.365634441299[/C][C]12.4343655587005[/C][/ROW]
[ROW][C]40[/C][C]147.5[/C][C]142.469291067202[/C][C]5.03070893279844[/C][/ROW]
[ROW][C]41[/C][C]136.2[/C][C]127.330406811215[/C][C]8.8695931887847[/C][/ROW]
[ROW][C]42[/C][C]156.6[/C][C]144.040812583534[/C][C]12.5591874164662[/C][/ROW]
[ROW][C]43[/C][C]123.3[/C][C]114.649645793325[/C][C]8.65035420667502[/C][/ROW]
[ROW][C]44[/C][C]104.5[/C][C]94.6073606618604[/C][C]9.89263933813961[/C][/ROW]
[ROW][C]45[/C][C]139.8[/C][C]131.490660483845[/C][C]8.3093395161546[/C][/ROW]
[ROW][C]46[/C][C]136.5[/C][C]125.437005416289[/C][C]11.0629945837114[/C][/ROW]
[ROW][C]47[/C][C]112.1[/C][C]101.911420462839[/C][C]10.1885795371611[/C][/ROW]
[ROW][C]48[/C][C]118.5[/C][C]110.588629025011[/C][C]7.91137097498908[/C][/ROW]
[ROW][C]49[/C][C]94.4[/C][C]88.9955151603615[/C][C]5.40448483963849[/C][/ROW]
[ROW][C]50[/C][C]102.3[/C][C]99.0593389967062[/C][C]3.24066100329381[/C][/ROW]
[ROW][C]51[/C][C]111.4[/C][C]118.492790918380[/C][C]-7.09279091837958[/C][/ROW]
[ROW][C]52[/C][C]99.2[/C][C]97.8946687191805[/C][C]1.30533128081953[/C][/ROW]
[ROW][C]53[/C][C]87.8[/C][C]94.0915720430789[/C][C]-6.2915720430789[/C][/ROW]
[ROW][C]54[/C][C]115.8[/C][C]118.679389523453[/C][C]-2.87938952345284[/C][/ROW]
[ROW][C]55[/C][C]79.7[/C][C]88.9039587474852[/C][C]-9.2039587474852[/C][/ROW]
[ROW][C]56[/C][C]72.7[/C][C]74.0492374237645[/C][C]-1.34923742376444[/C][/ROW]
[ROW][C]57[/C][C]104.5[/C][C]107.858425359679[/C][C]-3.35842535967907[/C][/ROW]
[ROW][C]58[/C][C]103[/C][C]105.071014171072[/C][C]-2.07101417107201[/C][/ROW]
[ROW][C]59[/C][C]95.1[/C][C]93.6497447690247[/C][C]1.45025523097534[/C][/ROW]
[ROW][C]60[/C][C]104.2[/C][C]99.8292374237645[/C][C]4.37076257623554[/C][/ROW]
[ROW][C]61[/C][C]78.3[/C][C]79.9653114950297[/C][C]-1.66531149502966[/C][/ROW]
[/TABLE]
Source: https://freestatistics.org/blog/index.php?pk=116206&T=4

Globally Unique Identifier (entire table): ba.freestatistics.org/blog/index.php?pk=116206&T=4

As an alternative you can also use a QR Code:  

The GUIDs for individual cells are displayed in the table below:

Multiple Linear Regression - Actuals, Interpolation, and Residuals
Time or IndexActualsInterpolationForecastResidualsPrediction Error
19995.912266904023.08773309598005
2106.3104.246902804452.05309719554997
3128.9121.566902804457.33309719554998
4111.1114.610152099688-3.51015209968838
5102.9106.195887594481-3.29588759448116
6130140.198172725946-10.1981727259458
78785.63771486853541.36228513146459
887.586.7299489538050.77005104619506
9117.6124.573908740187-6.97390874018698
10103.4106.608070114107-3.20807011410722
11110.8119.971827793503-9.17182779350262
12112.6125.959188455363-13.3591884553630
13102.5104.366074590714-1.86607459071361
14112.4113.469238462661-1.06923846266127
15135.6142.317158035425-6.71715803542535
16105.1110.575380249221-5.47538024922097
17127.7128.867462754251-1.16746275425052
18137141.543096676102-4.54309667610157
199194.2836545481085-3.28365454810847
2090.595.9522846120162-5.45228461201619
21122.4127.648020626257-5.24802062625738
22123.3126.974061359324-3.67406135932376
23124.3127.849239501558-3.54923950155809
24120125.382792476725-5.38279247672481
25118.1117.8153140922720.284685907728300
26119122.307310135114-3.30731013511372
27142.7148.657513800446-5.95751380044559
28123.6120.9505078647092.64949213529138
29129.6127.7146707969741.88532920302589
30151.6146.5385284909665.06147150903398
31110.4107.9250260425462.47497395745407
3299.2103.061168348554-3.86116834855404
33130.5123.2289847900317.27101520996883
34136.2138.309848939208-2.10984893920845
35129.7128.6177674730761.08223252692431
36128121.5401526191376.45984738086321
37121.6126.845517757604-5.24551775760356
38135.8136.717209601069-0.917209601068798
39143.8131.36563444129912.4343655587005
40147.5142.4692910672025.03070893279844
41136.2127.3304068112158.8695931887847
42156.6144.04081258353412.5591874164662
43123.3114.6496457933258.65035420667502
44104.594.60736066186049.89263933813961
45139.8131.4906604838458.3093395161546
46136.5125.43700541628911.0629945837114
47112.1101.91142046283910.1885795371611
48118.5110.5886290250117.91137097498908
4994.488.99551516036155.40448483963849
50102.399.05933899670623.24066100329381
51111.4118.492790918380-7.09279091837958
5299.297.89466871918051.30533128081953
5387.894.0915720430789-6.2915720430789
54115.8118.679389523453-2.87938952345284
5579.788.9039587474852-9.2039587474852
5672.774.0492374237645-1.34923742376444
57104.5107.858425359679-3.35842535967907
58103105.071014171072-2.07101417107201
5995.193.64974476902471.45025523097534
60104.299.82923742376454.37076257623554
6178.379.9653114950297-1.66531149502966


Goldfeld-Quandt test for Heteroskedasticity
p-valuesAlternative Hypothesis
breakpoint indexgreater2-sidedless
160.04164593832564580.08329187665129170.958354061674354
170.2087549208289580.4175098416579160.791245079171042
180.1714371520555140.3428743041110280.828562847944486
190.09752492297667270.1950498459533450.902475077023327
200.06100222635513970.1220044527102790.93899777364486
210.03813655270664690.07627310541329390.961863447293353
220.02762378078048650.05524756156097290.972376219219514
230.03186588019879140.06373176039758280.968134119801209
240.04761273063731490.09522546127462970.952387269362685
250.02898987112859640.05797974225719290.971010128871404
260.01649462879559070.03298925759118130.98350537120441
270.01397058085805870.02794116171611730.986029419141941
280.02066625843289610.04133251686579210.979333741567104
290.01640459034612410.03280918069224820.983595409653876
300.04574045091858330.09148090183716660.954259549081417
310.03273534383419140.06547068766838280.967264656165809
320.02753513253461250.05507026506922510.972464867465388
330.05248272716778330.1049654543355670.947517272832217
340.04787908954839470.09575817909678940.952120910451605
350.06026851264018060.1205370252803610.93973148735982
360.1030661387866880.2061322775733750.896933861213312
370.2529174538009270.5058349076018540.747082546199073
380.4966258352107860.9932516704215710.503374164789214
390.7781441363772150.4437117272455710.221855863622785
400.9987719926814730.002456014637054380.00122800731852719
410.9990544593597560.001891081280488770.000945540640244383
420.997771045061560.004457909876879220.00222895493843961
430.995253835445560.009492329108879790.00474616455443989
440.9848812536752340.03023749264953270.0151187463247663
450.9647076018084730.07058479638305420.0352923981915271

\begin{tabular}{lllllllll}
\hline
Goldfeld-Quandt test for Heteroskedasticity \tabularnewline
p-values & Alternative Hypothesis \tabularnewline
breakpoint index & greater & 2-sided & less \tabularnewline
16 & 0.0416459383256458 & 0.0832918766512917 & 0.958354061674354 \tabularnewline
17 & 0.208754920828958 & 0.417509841657916 & 0.791245079171042 \tabularnewline
18 & 0.171437152055514 & 0.342874304111028 & 0.828562847944486 \tabularnewline
19 & 0.0975249229766727 & 0.195049845953345 & 0.902475077023327 \tabularnewline
20 & 0.0610022263551397 & 0.122004452710279 & 0.93899777364486 \tabularnewline
21 & 0.0381365527066469 & 0.0762731054132939 & 0.961863447293353 \tabularnewline
22 & 0.0276237807804865 & 0.0552475615609729 & 0.972376219219514 \tabularnewline
23 & 0.0318658801987914 & 0.0637317603975828 & 0.968134119801209 \tabularnewline
24 & 0.0476127306373149 & 0.0952254612746297 & 0.952387269362685 \tabularnewline
25 & 0.0289898711285964 & 0.0579797422571929 & 0.971010128871404 \tabularnewline
26 & 0.0164946287955907 & 0.0329892575911813 & 0.98350537120441 \tabularnewline
27 & 0.0139705808580587 & 0.0279411617161173 & 0.986029419141941 \tabularnewline
28 & 0.0206662584328961 & 0.0413325168657921 & 0.979333741567104 \tabularnewline
29 & 0.0164045903461241 & 0.0328091806922482 & 0.983595409653876 \tabularnewline
30 & 0.0457404509185833 & 0.0914809018371666 & 0.954259549081417 \tabularnewline
31 & 0.0327353438341914 & 0.0654706876683828 & 0.967264656165809 \tabularnewline
32 & 0.0275351325346125 & 0.0550702650692251 & 0.972464867465388 \tabularnewline
33 & 0.0524827271677833 & 0.104965454335567 & 0.947517272832217 \tabularnewline
34 & 0.0478790895483947 & 0.0957581790967894 & 0.952120910451605 \tabularnewline
35 & 0.0602685126401806 & 0.120537025280361 & 0.93973148735982 \tabularnewline
36 & 0.103066138786688 & 0.206132277573375 & 0.896933861213312 \tabularnewline
37 & 0.252917453800927 & 0.505834907601854 & 0.747082546199073 \tabularnewline
38 & 0.496625835210786 & 0.993251670421571 & 0.503374164789214 \tabularnewline
39 & 0.778144136377215 & 0.443711727245571 & 0.221855863622785 \tabularnewline
40 & 0.998771992681473 & 0.00245601463705438 & 0.00122800731852719 \tabularnewline
41 & 0.999054459359756 & 0.00189108128048877 & 0.000945540640244383 \tabularnewline
42 & 0.99777104506156 & 0.00445790987687922 & 0.00222895493843961 \tabularnewline
43 & 0.99525383544556 & 0.00949232910887979 & 0.00474616455443989 \tabularnewline
44 & 0.984881253675234 & 0.0302374926495327 & 0.0151187463247663 \tabularnewline
45 & 0.964707601808473 & 0.0705847963830542 & 0.0352923981915271 \tabularnewline
\hline
\end{tabular}
%Source: https://freestatistics.org/blog/index.php?pk=116206&T=5

[TABLE]
[ROW][C]Goldfeld-Quandt test for Heteroskedasticity[/C][/ROW]
[ROW][C]p-values[/C][C]Alternative Hypothesis[/C][/ROW]
[ROW][C]breakpoint index[/C][C]greater[/C][C]2-sided[/C][C]less[/C][/ROW]
[ROW][C]16[/C][C]0.0416459383256458[/C][C]0.0832918766512917[/C][C]0.958354061674354[/C][/ROW]
[ROW][C]17[/C][C]0.208754920828958[/C][C]0.417509841657916[/C][C]0.791245079171042[/C][/ROW]
[ROW][C]18[/C][C]0.171437152055514[/C][C]0.342874304111028[/C][C]0.828562847944486[/C][/ROW]
[ROW][C]19[/C][C]0.0975249229766727[/C][C]0.195049845953345[/C][C]0.902475077023327[/C][/ROW]
[ROW][C]20[/C][C]0.0610022263551397[/C][C]0.122004452710279[/C][C]0.93899777364486[/C][/ROW]
[ROW][C]21[/C][C]0.0381365527066469[/C][C]0.0762731054132939[/C][C]0.961863447293353[/C][/ROW]
[ROW][C]22[/C][C]0.0276237807804865[/C][C]0.0552475615609729[/C][C]0.972376219219514[/C][/ROW]
[ROW][C]23[/C][C]0.0318658801987914[/C][C]0.0637317603975828[/C][C]0.968134119801209[/C][/ROW]
[ROW][C]24[/C][C]0.0476127306373149[/C][C]0.0952254612746297[/C][C]0.952387269362685[/C][/ROW]
[ROW][C]25[/C][C]0.0289898711285964[/C][C]0.0579797422571929[/C][C]0.971010128871404[/C][/ROW]
[ROW][C]26[/C][C]0.0164946287955907[/C][C]0.0329892575911813[/C][C]0.98350537120441[/C][/ROW]
[ROW][C]27[/C][C]0.0139705808580587[/C][C]0.0279411617161173[/C][C]0.986029419141941[/C][/ROW]
[ROW][C]28[/C][C]0.0206662584328961[/C][C]0.0413325168657921[/C][C]0.979333741567104[/C][/ROW]
[ROW][C]29[/C][C]0.0164045903461241[/C][C]0.0328091806922482[/C][C]0.983595409653876[/C][/ROW]
[ROW][C]30[/C][C]0.0457404509185833[/C][C]0.0914809018371666[/C][C]0.954259549081417[/C][/ROW]
[ROW][C]31[/C][C]0.0327353438341914[/C][C]0.0654706876683828[/C][C]0.967264656165809[/C][/ROW]
[ROW][C]32[/C][C]0.0275351325346125[/C][C]0.0550702650692251[/C][C]0.972464867465388[/C][/ROW]
[ROW][C]33[/C][C]0.0524827271677833[/C][C]0.104965454335567[/C][C]0.947517272832217[/C][/ROW]
[ROW][C]34[/C][C]0.0478790895483947[/C][C]0.0957581790967894[/C][C]0.952120910451605[/C][/ROW]
[ROW][C]35[/C][C]0.0602685126401806[/C][C]0.120537025280361[/C][C]0.93973148735982[/C][/ROW]
[ROW][C]36[/C][C]0.103066138786688[/C][C]0.206132277573375[/C][C]0.896933861213312[/C][/ROW]
[ROW][C]37[/C][C]0.252917453800927[/C][C]0.505834907601854[/C][C]0.747082546199073[/C][/ROW]
[ROW][C]38[/C][C]0.496625835210786[/C][C]0.993251670421571[/C][C]0.503374164789214[/C][/ROW]
[ROW][C]39[/C][C]0.778144136377215[/C][C]0.443711727245571[/C][C]0.221855863622785[/C][/ROW]
[ROW][C]40[/C][C]0.998771992681473[/C][C]0.00245601463705438[/C][C]0.00122800731852719[/C][/ROW]
[ROW][C]41[/C][C]0.999054459359756[/C][C]0.00189108128048877[/C][C]0.000945540640244383[/C][/ROW]
[ROW][C]42[/C][C]0.99777104506156[/C][C]0.00445790987687922[/C][C]0.00222895493843961[/C][/ROW]
[ROW][C]43[/C][C]0.99525383544556[/C][C]0.00949232910887979[/C][C]0.00474616455443989[/C][/ROW]
[ROW][C]44[/C][C]0.984881253675234[/C][C]0.0302374926495327[/C][C]0.0151187463247663[/C][/ROW]
[ROW][C]45[/C][C]0.964707601808473[/C][C]0.0705847963830542[/C][C]0.0352923981915271[/C][/ROW]
[/TABLE]
Source: https://freestatistics.org/blog/index.php?pk=116206&T=5

Globally Unique Identifier (entire table): ba.freestatistics.org/blog/index.php?pk=116206&T=5

As an alternative you can also use a QR Code:  

The GUIDs for individual cells are displayed in the table below:

Goldfeld-Quandt test for Heteroskedasticity
p-valuesAlternative Hypothesis
breakpoint indexgreater2-sidedless
160.04164593832564580.08329187665129170.958354061674354
170.2087549208289580.4175098416579160.791245079171042
180.1714371520555140.3428743041110280.828562847944486
190.09752492297667270.1950498459533450.902475077023327
200.06100222635513970.1220044527102790.93899777364486
210.03813655270664690.07627310541329390.961863447293353
220.02762378078048650.05524756156097290.972376219219514
230.03186588019879140.06373176039758280.968134119801209
240.04761273063731490.09522546127462970.952387269362685
250.02898987112859640.05797974225719290.971010128871404
260.01649462879559070.03298925759118130.98350537120441
270.01397058085805870.02794116171611730.986029419141941
280.02066625843289610.04133251686579210.979333741567104
290.01640459034612410.03280918069224820.983595409653876
300.04574045091858330.09148090183716660.954259549081417
310.03273534383419140.06547068766838280.967264656165809
320.02753513253461250.05507026506922510.972464867465388
330.05248272716778330.1049654543355670.947517272832217
340.04787908954839470.09575817909678940.952120910451605
350.06026851264018060.1205370252803610.93973148735982
360.1030661387866880.2061322775733750.896933861213312
370.2529174538009270.5058349076018540.747082546199073
380.4966258352107860.9932516704215710.503374164789214
390.7781441363772150.4437117272455710.221855863622785
400.9987719926814730.002456014637054380.00122800731852719
410.9990544593597560.001891081280488770.000945540640244383
420.997771045061560.004457909876879220.00222895493843961
430.995253835445560.009492329108879790.00474616455443989
440.9848812536752340.03023749264953270.0151187463247663
450.9647076018084730.07058479638305420.0352923981915271


Meta Analysis of Goldfeld-Quandt test for Heteroskedasticity
Description# significant tests% significant testsOK/NOK
1% type I error level40.133333333333333NOK
5% type I error level90.3NOK
10% type I error level200.666666666666667NOK

\begin{tabular}{lllllllll}
\hline
Meta Analysis of Goldfeld-Quandt test for Heteroskedasticity \tabularnewline
Description & # significant tests & % significant tests & OK/NOK \tabularnewline
1% type I error level & 4 & 0.133333333333333 & NOK \tabularnewline
5% type I error level & 9 & 0.3 & NOK \tabularnewline
10% type I error level & 20 & 0.666666666666667 & NOK \tabularnewline
\hline
\end{tabular}
%Source: https://freestatistics.org/blog/index.php?pk=116206&T=6

[TABLE]
[ROW][C]Meta Analysis of Goldfeld-Quandt test for Heteroskedasticity[/C][/ROW]
[ROW][C]Description[/C][C]# significant tests[/C][C]% significant tests[/C][C]OK/NOK[/C][/ROW]
[ROW][C]1% type I error level[/C][C]4[/C][C]0.133333333333333[/C][C]NOK[/C][/ROW]
[ROW][C]5% type I error level[/C][C]9[/C][C]0.3[/C][C]NOK[/C][/ROW]
[ROW][C]10% type I error level[/C][C]20[/C][C]0.666666666666667[/C][C]NOK[/C][/ROW]
[/TABLE]
Source: https://freestatistics.org/blog/index.php?pk=116206&T=6

Globally Unique Identifier (entire table): ba.freestatistics.org/blog/index.php?pk=116206&T=6

As an alternative you can also use a QR Code:  

The GUIDs for individual cells are displayed in the table below:

Meta Analysis of Goldfeld-Quandt test for Heteroskedasticity
Description# significant tests% significant testsOK/NOK
1% type I error level40.133333333333333NOK
5% type I error level90.3NOK
10% type I error level200.666666666666667NOK


Parameters (Session):
par1 = 1 ; par2 = Include Monthly Dummies ; par3 = No Linear Trend ;
Parameters (R input):
par1 = 1 ; par2 = Include Monthly Dummies ; par3 = No Linear Trend ;
R code (references can be found in the software module):
library(lattice)
library(lmtest)
n25 <- 25 #minimum number of obs. for Goldfeld-Quandt test
par1 <- as.numeric(par1)
x <- t(y)
k <- length(x[1,])
n <- length(x[,1])
x1 <- cbind(x[,par1], x[,1:k!=par1])
mycolnames <- c(colnames(x)[par1], colnames(x)[1:k!=par1])
colnames(x1) <- mycolnames #colnames(x)[par1]
x <- x1
if (par3 == 'First Differences'){
x2 <- array(0, dim=c(n-1,k), dimnames=list(1:(n-1), paste('(1-B)',colnames(x),sep='')))
for (i in 1:n-1) {
for (j in 1:k) {
x2[i,j] <- x[i+1,j] - x[i,j]
}
}
x <- x2
}
if (par2 == 'Include Monthly Dummies'){
x2 <- array(0, dim=c(n,11), dimnames=list(1:n, paste('M', seq(1:11), sep ='')))
for (i in 1:11){
x2[seq(i,n,12),i] <- 1
}
x <- cbind(x, x2)
}
if (par2 == 'Include Quarterly Dummies'){
x2 <- array(0, dim=c(n,3), dimnames=list(1:n, paste('Q', seq(1:3), sep ='')))
for (i in 1:3){
x2[seq(i,n,4),i] <- 1
}
x <- cbind(x, x2)
}
k <- length(x[1,])
if (par3 == 'Linear Trend'){
x <- cbind(x, c(1:n))
colnames(x)[k+1] <- 't'
}
x
k <- length(x[1,])
df <- as.data.frame(x)
(mylm <- lm(df))
(mysum <- summary(mylm))
if (n > n25) {
kp3 <- k + 3
nmkm3 <- n - k - 3
gqarr <- array(NA, dim=c(nmkm3-kp3+1,3))
numgqtests <- 0
numsignificant1 <- 0
numsignificant5 <- 0
numsignificant10 <- 0
for (mypoint in kp3:nmkm3) {
j <- 0
numgqtests <- numgqtests + 1
for (myalt in c('greater', 'two.sided', 'less')) {
j <- j + 1
gqarr[mypoint-kp3+1,j] <- gqtest(mylm, point=mypoint, alternative=myalt)$p.value
}
if (gqarr[mypoint-kp3+1,2] < 0.01) numsignificant1 <- numsignificant1 + 1
if (gqarr[mypoint-kp3+1,2] < 0.05) numsignificant5 <- numsignificant5 + 1
if (gqarr[mypoint-kp3+1,2] < 0.10) numsignificant10 <- numsignificant10 + 1
}
gqarr
}
bitmap(file='test0.png')
plot(x[,1], type='l', main='Actuals and Interpolation', ylab='value of Actuals and Interpolation (dots)', xlab='time or index')
points(x[,1]-mysum$resid)
grid()
dev.off()
bitmap(file='test1.png')
plot(mysum$resid, type='b', pch=19, main='Residuals', ylab='value of Residuals', xlab='time or index')
grid()
dev.off()
bitmap(file='test2.png')
hist(mysum$resid, main='Residual Histogram', xlab='values of Residuals')
grid()
dev.off()
bitmap(file='test3.png')
densityplot(~mysum$resid,col='black',main='Residual Density Plot', xlab='values of Residuals')
dev.off()
bitmap(file='test4.png')
qqnorm(mysum$resid, main='Residual Normal Q-Q Plot')
qqline(mysum$resid)
grid()
dev.off()
(myerror <- as.ts(mysum$resid))
bitmap(file='test5.png')
dum <- cbind(lag(myerror,k=1),myerror)
dum
dum1 <- dum[2:length(myerror),]
dum1
z <- as.data.frame(dum1)
z
plot(z,main=paste('Residual Lag plot, lowess, and regression line'), ylab='values of Residuals', xlab='lagged values of Residuals')
lines(lowess(z))
abline(lm(z))
grid()
dev.off()
bitmap(file='test6.png')
acf(mysum$resid, lag.max=length(mysum$resid)/2, main='Residual Autocorrelation Function')
grid()
dev.off()
bitmap(file='test7.png')
pacf(mysum$resid, lag.max=length(mysum$resid)/2, main='Residual Partial Autocorrelation Function')
grid()
dev.off()
bitmap(file='test8.png')
opar <- par(mfrow = c(2,2), oma = c(0, 0, 1.1, 0))
plot(mylm, las = 1, sub='Residual Diagnostics')
par(opar)
dev.off()
if (n > n25) {
bitmap(file='test9.png')
plot(kp3:nmkm3,gqarr[,2], main='Goldfeld-Quandt test',ylab='2-sided p-value',xlab='breakpoint')
grid()
dev.off()
}
load(file='createtable')
a<-table.start()
a<-table.row.start(a)
a<-table.element(a, 'Multiple Linear Regression - Estimated Regression Equation', 1, TRUE)
a<-table.row.end(a)
myeq <- colnames(x)[1]
myeq <- paste(myeq, '[t] = ', sep='')
for (i in 1:k){
if (mysum$coefficients[i,1] > 0) myeq <- paste(myeq, '+', '')
myeq <- paste(myeq, mysum$coefficients[i,1], sep=' ')
if (rownames(mysum$coefficients)[i] != '(Intercept)') {
myeq <- paste(myeq, rownames(mysum$coefficients)[i], sep='')
if (rownames(mysum$coefficients)[i] != 't') myeq <- paste(myeq, '[t]', sep='')
}
}
myeq <- paste(myeq, ' + e[t]')
a<-table.row.start(a)
a<-table.element(a, myeq)
a<-table.row.end(a)
a<-table.end(a)
table.save(a,file='mytable1.tab')
a<-table.start()
a<-table.row.start(a)
a<-table.element(a,hyperlink('ols1.htm','Multiple Linear Regression - Ordinary Least Squares',''), 6, TRUE)
a<-table.row.end(a)
a<-table.row.start(a)
a<-table.element(a,'Variable',header=TRUE)
a<-table.element(a,'Parameter',header=TRUE)
a<-table.element(a,'S.D.',header=TRUE)
a<-table.element(a,'T-STAT
H0: parameter = 0',header=TRUE)
a<-table.element(a,'2-tail p-value',header=TRUE)
a<-table.element(a,'1-tail p-value',header=TRUE)
a<-table.row.end(a)
for (i in 1:k){
a<-table.row.start(a)
a<-table.element(a,rownames(mysum$coefficients)[i],header=TRUE)
a<-table.element(a,mysum$coefficients[i,1])
a<-table.element(a, round(mysum$coefficients[i,2],6))
a<-table.element(a, round(mysum$coefficients[i,3],4))
a<-table.element(a, round(mysum$coefficients[i,4],6))
a<-table.element(a, round(mysum$coefficients[i,4]/2,6))
a<-table.row.end(a)
}
a<-table.end(a)
table.save(a,file='mytable2.tab')
a<-table.start()
a<-table.row.start(a)
a<-table.element(a, 'Multiple Linear Regression - Regression Statistics', 2, TRUE)
a<-table.row.end(a)
a<-table.row.start(a)
a<-table.element(a, 'Multiple R',1,TRUE)
a<-table.element(a, sqrt(mysum$r.squared))
a<-table.row.end(a)
a<-table.row.start(a)
a<-table.element(a, 'R-squared',1,TRUE)
a<-table.element(a, mysum$r.squared)
a<-table.row.end(a)
a<-table.row.start(a)
a<-table.element(a, 'Adjusted R-squared',1,TRUE)
a<-table.element(a, mysum$adj.r.squared)
a<-table.row.end(a)
a<-table.row.start(a)
a<-table.element(a, 'F-TEST (value)',1,TRUE)
a<-table.element(a, mysum$fstatistic[1])
a<-table.row.end(a)
a<-table.row.start(a)
a<-table.element(a, 'F-TEST (DF numerator)',1,TRUE)
a<-table.element(a, mysum$fstatistic[2])
a<-table.row.end(a)
a<-table.row.start(a)
a<-table.element(a, 'F-TEST (DF denominator)',1,TRUE)
a<-table.element(a, mysum$fstatistic[3])
a<-table.row.end(a)
a<-table.row.start(a)
a<-table.element(a, 'p-value',1,TRUE)
a<-table.element(a, 1-pf(mysum$fstatistic[1],mysum$fstatistic[2],mysum$fstatistic[3]))
a<-table.row.end(a)
a<-table.row.start(a)
a<-table.element(a, 'Multiple Linear Regression - Residual Statistics', 2, TRUE)
a<-table.row.end(a)
a<-table.row.start(a)
a<-table.element(a, 'Residual Standard Deviation',1,TRUE)
a<-table.element(a, mysum$sigma)
a<-table.row.end(a)
a<-table.row.start(a)
a<-table.element(a, 'Sum Squared Residuals',1,TRUE)
a<-table.element(a, sum(myerror*myerror))
a<-table.row.end(a)
a<-table.end(a)
table.save(a,file='mytable3.tab')
a<-table.start()
a<-table.row.start(a)
a<-table.element(a, 'Multiple Linear Regression - Actuals, Interpolation, and Residuals', 4, TRUE)
a<-table.row.end(a)
a<-table.row.start(a)
a<-table.element(a, 'Time or Index', 1, TRUE)
a<-table.element(a, 'Actuals', 1, TRUE)
a<-table.element(a, 'Interpolation
Forecast', 1, TRUE)
a<-table.element(a, 'Residuals
Prediction Error', 1, TRUE)
a<-table.row.end(a)
for (i in 1:n) {
a<-table.row.start(a)
a<-table.element(a,i, 1, TRUE)
a<-table.element(a,x[i])
a<-table.element(a,x[i]-mysum$resid[i])
a<-table.element(a,mysum$resid[i])
a<-table.row.end(a)
}
a<-table.end(a)
table.save(a,file='mytable4.tab')
if (n > n25) {
a<-table.start()
a<-table.row.start(a)
a<-table.element(a,'Goldfeld-Quandt test for Heteroskedasticity',4,TRUE)
a<-table.row.end(a)
a<-table.row.start(a)
a<-table.element(a,'p-values',header=TRUE)
a<-table.element(a,'Alternative Hypothesis',3,header=TRUE)
a<-table.row.end(a)
a<-table.row.start(a)
a<-table.element(a,'breakpoint index',header=TRUE)
a<-table.element(a,'greater',header=TRUE)
a<-table.element(a,'2-sided',header=TRUE)
a<-table.element(a,'less',header=TRUE)
a<-table.row.end(a)
for (mypoint in kp3:nmkm3) {
a<-table.row.start(a)
a<-table.element(a,mypoint,header=TRUE)
a<-table.element(a,gqarr[mypoint-kp3+1,1])
a<-table.element(a,gqarr[mypoint-kp3+1,2])
a<-table.element(a,gqarr[mypoint-kp3+1,3])
a<-table.row.end(a)
}
a<-table.end(a)
table.save(a,file='mytable5.tab')
a<-table.start()
a<-table.row.start(a)
a<-table.element(a,'Meta Analysis of Goldfeld-Quandt test for Heteroskedasticity',4,TRUE)
a<-table.row.end(a)
a<-table.row.start(a)
a<-table.element(a,'Description',header=TRUE)
a<-table.element(a,'# significant tests',header=TRUE)
a<-table.element(a,'% significant tests',header=TRUE)
a<-table.element(a,'OK/NOK',header=TRUE)
a<-table.row.end(a)
a<-table.row.start(a)
a<-table.element(a,'1% type I error level',header=TRUE)
a<-table.element(a,numsignificant1)
a<-table.element(a,numsignificant1/numgqtests)
if (numsignificant1/numgqtests < 0.01) dum <- 'OK' else dum <- 'NOK'
a<-table.element(a,dum)
a<-table.row.end(a)
a<-table.row.start(a)
a<-table.element(a,'5% type I error level',header=TRUE)
a<-table.element(a,numsignificant5)
a<-table.element(a,numsignificant5/numgqtests)
if (numsignificant5/numgqtests < 0.05) dum <- 'OK' else dum <- 'NOK'
a<-table.element(a,dum)
a<-table.row.end(a)
a<-table.row.start(a)
a<-table.element(a,'10% type I error level',header=TRUE)
a<-table.element(a,numsignificant10)
a<-table.element(a,numsignificant10/numgqtests)
if (numsignificant10/numgqtests < 0.1) dum <- 'OK' else dum <- 'NOK'
a<-table.element(a,dum)
a<-table.row.end(a)
a<-table.end(a)
table.save(a,file='mytable6.tab')
}