Free Statistics

of Irreproducible Research!

Author's title

Author*The author of this computation has been verified*
R Software Modulerwasp_arimabackwardselection.wasp
Title produced by softwareARIMA Backward Selection
Date of computationMon, 27 Dec 2010 23:49:35 +0000
Cite this page as followsStatistical Computations at FreeStatistics.org, Office for Research Development and Education, URL https://freestatistics.org/blog/index.php?v=date/2010/Dec/28/t12934936432i11vfn9prjpmee.htm/, Retrieved Sat, 04 May 2024 22:18:30 +0000
Statistical Computations at FreeStatistics.org, Office for Research Development and Education, URL https://freestatistics.org/blog/index.php?pk=116190, Retrieved Sat, 04 May 2024 22:18:30 +0000
QR Codes:

Original text written by user:
IsPrivate?No (this computation is public)
User-defined keywords
Estimated Impact174
Family? (F = Feedback message, R = changed R code, M = changed R Module, P = changed Parameters, D = changed Data)
-     [ARIMA Backward Selection] [] [2010-12-14 14:33:50] [c91278f1cd2d8b4eeb874e50bb706c21]
-   PD  [ARIMA Backward Selection] [] [2010-12-19 14:42:37] [c91278f1cd2d8b4eeb874e50bb706c21]
-   PD    [ARIMA Backward Selection] [] [2010-12-21 16:43:04] [c91278f1cd2d8b4eeb874e50bb706c21]
-             [ARIMA Backward Selection] [] [2010-12-27 23:49:35] [4dbe485270073769796ed1462cddce37] [Current]
Feedback Forum

Post a new message
Dataseries X:
224
215
196
159
187
208
131
93
210
228
176
195
188
188
190
188
176
225
93
79
235
247
195
197
211
156
209
180
185
303
129
85
249
231
212
240
234
217
287
221
208
241
156
96
320
242
227
200
215
238
279
208
262
259
167
123
302
246
235


Summary of computational transaction
Raw Inputview raw input (R code)
Raw Outputview raw output of R engine
Computing time13 seconds
R Server'George Udny Yule' @ 72.249.76.132

\begin{tabular}{lllllllll}
\hline
Summary of computational transaction \tabularnewline
Raw Input & view raw input (R code)  \tabularnewline
Raw Output & view raw output of R engine  \tabularnewline
Computing time & 13 seconds \tabularnewline
R Server & 'George Udny Yule' @ 72.249.76.132 \tabularnewline
\hline
\end{tabular}
%Source: https://freestatistics.org/blog/index.php?pk=116190&T=0

[TABLE]
[ROW][C]Summary of computational transaction[/C][/ROW]
[ROW][C]Raw Input[/C][C]view raw input (R code) [/C][/ROW]
[ROW][C]Raw Output[/C][C]view raw output of R engine [/C][/ROW]
[ROW][C]Computing time[/C][C]13 seconds[/C][/ROW]
[ROW][C]R Server[/C][C]'George Udny Yule' @ 72.249.76.132[/C][/ROW]
[/TABLE]
Source: https://freestatistics.org/blog/index.php?pk=116190&T=0

Globally Unique Identifier (entire table): ba.freestatistics.org/blog/index.php?pk=116190&T=0

As an alternative you can also use a QR Code:  

The GUIDs for individual cells are displayed in the table below:

Summary of computational transaction
Raw Inputview raw input (R code)
Raw Outputview raw output of R engine
Computing time13 seconds
R Server'George Udny Yule' @ 72.249.76.132


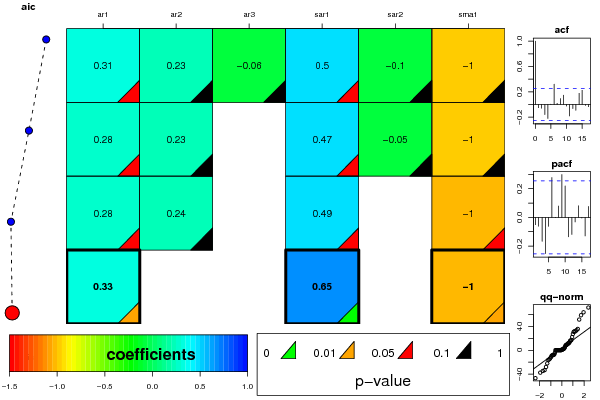
ARIMA Parameter Estimation and Backward Selection
Iterationar1ar2ar3sar1sar2sma1
Estimates ( 1 )0.30520.2259-0.0630.4972-0.0983-0.9988
(p-val)(0.0591 )(0.185 )(0.7295 )(0.0779 )(0.7265 )(0.1684 )
Estimates ( 2 )0.28350.229500.4682-0.0521-0.9999
(p-val)(0.0574 )(0.1744 )(NA )(0.0834 )(0.8345 )(0.172 )
Estimates ( 3 )0.27540.236700.48670-1.0002
(p-val)(0.0548 )(0.1472 )(NA )(0.0571 )(NA )(0.0917 )
Estimates ( 4 )0.3339000.65320-1
(p-val)(0.022 )(NA )(NA )(0.0041 )(NA )(0.0355 )
Estimates ( 5 )NANANANANANA
(p-val)(NA )(NA )(NA )(NA )(NA )(NA )
Estimates ( 6 )NANANANANANA
(p-val)(NA )(NA )(NA )(NA )(NA )(NA )
Estimates ( 7 )NANANANANANA
(p-val)(NA )(NA )(NA )(NA )(NA )(NA )
Estimates ( 8 )NANANANANANA
(p-val)(NA )(NA )(NA )(NA )(NA )(NA )
Estimates ( 9 )NANANANANANA
(p-val)(NA )(NA )(NA )(NA )(NA )(NA )
Estimates ( 10 )NANANANANANA
(p-val)(NA )(NA )(NA )(NA )(NA )(NA )
Estimates ( 11 )NANANANANANA
(p-val)(NA )(NA )(NA )(NA )(NA )(NA )

\begin{tabular}{lllllllll}
\hline
ARIMA Parameter Estimation and Backward Selection \tabularnewline
Iteration & ar1 & ar2 & ar3 & sar1 & sar2 & sma1 \tabularnewline
Estimates ( 1 ) & 0.3052 & 0.2259 & -0.063 & 0.4972 & -0.0983 & -0.9988 \tabularnewline
(p-val) & (0.0591 ) & (0.185 ) & (0.7295 ) & (0.0779 ) & (0.7265 ) & (0.1684 ) \tabularnewline
Estimates ( 2 ) & 0.2835 & 0.2295 & 0 & 0.4682 & -0.0521 & -0.9999 \tabularnewline
(p-val) & (0.0574 ) & (0.1744 ) & (NA ) & (0.0834 ) & (0.8345 ) & (0.172 ) \tabularnewline
Estimates ( 3 ) & 0.2754 & 0.2367 & 0 & 0.4867 & 0 & -1.0002 \tabularnewline
(p-val) & (0.0548 ) & (0.1472 ) & (NA ) & (0.0571 ) & (NA ) & (0.0917 ) \tabularnewline
Estimates ( 4 ) & 0.3339 & 0 & 0 & 0.6532 & 0 & -1 \tabularnewline
(p-val) & (0.022 ) & (NA ) & (NA ) & (0.0041 ) & (NA ) & (0.0355 ) \tabularnewline
Estimates ( 5 ) & NA & NA & NA & NA & NA & NA \tabularnewline
(p-val) & (NA ) & (NA ) & (NA ) & (NA ) & (NA ) & (NA ) \tabularnewline
Estimates ( 6 ) & NA & NA & NA & NA & NA & NA \tabularnewline
(p-val) & (NA ) & (NA ) & (NA ) & (NA ) & (NA ) & (NA ) \tabularnewline
Estimates ( 7 ) & NA & NA & NA & NA & NA & NA \tabularnewline
(p-val) & (NA ) & (NA ) & (NA ) & (NA ) & (NA ) & (NA ) \tabularnewline
Estimates ( 8 ) & NA & NA & NA & NA & NA & NA \tabularnewline
(p-val) & (NA ) & (NA ) & (NA ) & (NA ) & (NA ) & (NA ) \tabularnewline
Estimates ( 9 ) & NA & NA & NA & NA & NA & NA \tabularnewline
(p-val) & (NA ) & (NA ) & (NA ) & (NA ) & (NA ) & (NA ) \tabularnewline
Estimates ( 10 ) & NA & NA & NA & NA & NA & NA \tabularnewline
(p-val) & (NA ) & (NA ) & (NA ) & (NA ) & (NA ) & (NA ) \tabularnewline
Estimates ( 11 ) & NA & NA & NA & NA & NA & NA \tabularnewline
(p-val) & (NA ) & (NA ) & (NA ) & (NA ) & (NA ) & (NA ) \tabularnewline
\hline
\end{tabular}
%Source: https://freestatistics.org/blog/index.php?pk=116190&T=1

[TABLE]
[ROW][C]ARIMA Parameter Estimation and Backward Selection[/C][/ROW]
[ROW][C]Iteration[/C][C]ar1[/C][C]ar2[/C][C]ar3[/C][C]sar1[/C][C]sar2[/C][C]sma1[/C][/ROW]
[ROW][C]Estimates ( 1 )[/C][C]0.3052[/C][C]0.2259[/C][C]-0.063[/C][C]0.4972[/C][C]-0.0983[/C][C]-0.9988[/C][/ROW]
[ROW][C](p-val)[/C][C](0.0591 )[/C][C](0.185 )[/C][C](0.7295 )[/C][C](0.0779 )[/C][C](0.7265 )[/C][C](0.1684 )[/C][/ROW]
[ROW][C]Estimates ( 2 )[/C][C]0.2835[/C][C]0.2295[/C][C]0[/C][C]0.4682[/C][C]-0.0521[/C][C]-0.9999[/C][/ROW]
[ROW][C](p-val)[/C][C](0.0574 )[/C][C](0.1744 )[/C][C](NA )[/C][C](0.0834 )[/C][C](0.8345 )[/C][C](0.172 )[/C][/ROW]
[ROW][C]Estimates ( 3 )[/C][C]0.2754[/C][C]0.2367[/C][C]0[/C][C]0.4867[/C][C]0[/C][C]-1.0002[/C][/ROW]
[ROW][C](p-val)[/C][C](0.0548 )[/C][C](0.1472 )[/C][C](NA )[/C][C](0.0571 )[/C][C](NA )[/C][C](0.0917 )[/C][/ROW]
[ROW][C]Estimates ( 4 )[/C][C]0.3339[/C][C]0[/C][C]0[/C][C]0.6532[/C][C]0[/C][C]-1[/C][/ROW]
[ROW][C](p-val)[/C][C](0.022 )[/C][C](NA )[/C][C](NA )[/C][C](0.0041 )[/C][C](NA )[/C][C](0.0355 )[/C][/ROW]
[ROW][C]Estimates ( 5 )[/C][C]NA[/C][C]NA[/C][C]NA[/C][C]NA[/C][C]NA[/C][C]NA[/C][/ROW]
[ROW][C](p-val)[/C][C](NA )[/C][C](NA )[/C][C](NA )[/C][C](NA )[/C][C](NA )[/C][C](NA )[/C][/ROW]
[ROW][C]Estimates ( 6 )[/C][C]NA[/C][C]NA[/C][C]NA[/C][C]NA[/C][C]NA[/C][C]NA[/C][/ROW]
[ROW][C](p-val)[/C][C](NA )[/C][C](NA )[/C][C](NA )[/C][C](NA )[/C][C](NA )[/C][C](NA )[/C][/ROW]
[ROW][C]Estimates ( 7 )[/C][C]NA[/C][C]NA[/C][C]NA[/C][C]NA[/C][C]NA[/C][C]NA[/C][/ROW]
[ROW][C](p-val)[/C][C](NA )[/C][C](NA )[/C][C](NA )[/C][C](NA )[/C][C](NA )[/C][C](NA )[/C][/ROW]
[ROW][C]Estimates ( 8 )[/C][C]NA[/C][C]NA[/C][C]NA[/C][C]NA[/C][C]NA[/C][C]NA[/C][/ROW]
[ROW][C](p-val)[/C][C](NA )[/C][C](NA )[/C][C](NA )[/C][C](NA )[/C][C](NA )[/C][C](NA )[/C][/ROW]
[ROW][C]Estimates ( 9 )[/C][C]NA[/C][C]NA[/C][C]NA[/C][C]NA[/C][C]NA[/C][C]NA[/C][/ROW]
[ROW][C](p-val)[/C][C](NA )[/C][C](NA )[/C][C](NA )[/C][C](NA )[/C][C](NA )[/C][C](NA )[/C][/ROW]
[ROW][C]Estimates ( 10 )[/C][C]NA[/C][C]NA[/C][C]NA[/C][C]NA[/C][C]NA[/C][C]NA[/C][/ROW]
[ROW][C](p-val)[/C][C](NA )[/C][C](NA )[/C][C](NA )[/C][C](NA )[/C][C](NA )[/C][C](NA )[/C][/ROW]
[ROW][C]Estimates ( 11 )[/C][C]NA[/C][C]NA[/C][C]NA[/C][C]NA[/C][C]NA[/C][C]NA[/C][/ROW]
[ROW][C](p-val)[/C][C](NA )[/C][C](NA )[/C][C](NA )[/C][C](NA )[/C][C](NA )[/C][C](NA )[/C][/ROW]
[/TABLE]
Source: https://freestatistics.org/blog/index.php?pk=116190&T=1

Globally Unique Identifier (entire table): ba.freestatistics.org/blog/index.php?pk=116190&T=1

As an alternative you can also use a QR Code:  

The GUIDs for individual cells are displayed in the table below:

ARIMA Parameter Estimation and Backward Selection
Iterationar1ar2ar3sar1sar2sma1
Estimates ( 1 )0.30520.2259-0.0630.4972-0.0983-0.9988
(p-val)(0.0591 )(0.185 )(0.7295 )(0.0779 )(0.7265 )(0.1684 )
Estimates ( 2 )0.28350.229500.4682-0.0521-0.9999
(p-val)(0.0574 )(0.1744 )(NA )(0.0834 )(0.8345 )(0.172 )
Estimates ( 3 )0.27540.236700.48670-1.0002
(p-val)(0.0548 )(0.1472 )(NA )(0.0571 )(NA )(0.0917 )
Estimates ( 4 )0.3339000.65320-1
(p-val)(0.022 )(NA )(NA )(0.0041 )(NA )(0.0355 )
Estimates ( 5 )NANANANANANA
(p-val)(NA )(NA )(NA )(NA )(NA )(NA )
Estimates ( 6 )NANANANANANA
(p-val)(NA )(NA )(NA )(NA )(NA )(NA )
Estimates ( 7 )NANANANANANA
(p-val)(NA )(NA )(NA )(NA )(NA )(NA )
Estimates ( 8 )NANANANANANA
(p-val)(NA )(NA )(NA )(NA )(NA )(NA )
Estimates ( 9 )NANANANANANA
(p-val)(NA )(NA )(NA )(NA )(NA )(NA )
Estimates ( 10 )NANANANANANA
(p-val)(NA )(NA )(NA )(NA )(NA )(NA )
Estimates ( 11 )NANANANANANA
(p-val)(NA )(NA )(NA )(NA )(NA )(NA )


Estimated ARIMA Residuals
Value
0.194999574829288
-28.1486988414853
-11.7808016560948
8.5279903740943
31.8475899173193
-15.2824957498166
11.1361737857702
-34.8902247409119
-7.03048696732752
31.7971099483076
12.1548320022030
4.68160159693529
-9.03740756671427
9.58753789643614
-37.6960889359721
22.1878503684079
3.36607115249341
1.85287577893713
71.9031443406118
1.61942625439385
-22.0857798229305
11.4517740206816
-16.3821157374378
16.3834100271377
33.7669145597095
6.89709041146274
27.403546847861
58.9279066717584
9.88283834299156
-7.6069187375025
-46.9654585952233
31.0603938278567
8.65553381066564
63.8301945313868
-13.8642157908667
1.14820638567185
-33.5037265863247
-8.1850523589678
35.8799133739488
15.9786336934593
-8.5367051639819
51.619504125627
1.28152722161357
2.55607334360043
17.3098578543953
0.135900034193168
-4.29674294436115
13.4016991884049

\begin{tabular}{lllllllll}
\hline
Estimated ARIMA Residuals \tabularnewline
Value \tabularnewline
0.194999574829288 \tabularnewline
-28.1486988414853 \tabularnewline
-11.7808016560948 \tabularnewline
8.5279903740943 \tabularnewline
31.8475899173193 \tabularnewline
-15.2824957498166 \tabularnewline
11.1361737857702 \tabularnewline
-34.8902247409119 \tabularnewline
-7.03048696732752 \tabularnewline
31.7971099483076 \tabularnewline
12.1548320022030 \tabularnewline
4.68160159693529 \tabularnewline
-9.03740756671427 \tabularnewline
9.58753789643614 \tabularnewline
-37.6960889359721 \tabularnewline
22.1878503684079 \tabularnewline
3.36607115249341 \tabularnewline
1.85287577893713 \tabularnewline
71.9031443406118 \tabularnewline
1.61942625439385 \tabularnewline
-22.0857798229305 \tabularnewline
11.4517740206816 \tabularnewline
-16.3821157374378 \tabularnewline
16.3834100271377 \tabularnewline
33.7669145597095 \tabularnewline
6.89709041146274 \tabularnewline
27.403546847861 \tabularnewline
58.9279066717584 \tabularnewline
9.88283834299156 \tabularnewline
-7.6069187375025 \tabularnewline
-46.9654585952233 \tabularnewline
31.0603938278567 \tabularnewline
8.65553381066564 \tabularnewline
63.8301945313868 \tabularnewline
-13.8642157908667 \tabularnewline
1.14820638567185 \tabularnewline
-33.5037265863247 \tabularnewline
-8.1850523589678 \tabularnewline
35.8799133739488 \tabularnewline
15.9786336934593 \tabularnewline
-8.5367051639819 \tabularnewline
51.619504125627 \tabularnewline
1.28152722161357 \tabularnewline
2.55607334360043 \tabularnewline
17.3098578543953 \tabularnewline
0.135900034193168 \tabularnewline
-4.29674294436115 \tabularnewline
13.4016991884049 \tabularnewline
\hline
\end{tabular}
%Source: https://freestatistics.org/blog/index.php?pk=116190&T=2

[TABLE]
[ROW][C]Estimated ARIMA Residuals[/C][/ROW]
[ROW][C]Value[/C][/ROW]
[ROW][C]0.194999574829288[/C][/ROW]
[ROW][C]-28.1486988414853[/C][/ROW]
[ROW][C]-11.7808016560948[/C][/ROW]
[ROW][C]8.5279903740943[/C][/ROW]
[ROW][C]31.8475899173193[/C][/ROW]
[ROW][C]-15.2824957498166[/C][/ROW]
[ROW][C]11.1361737857702[/C][/ROW]
[ROW][C]-34.8902247409119[/C][/ROW]
[ROW][C]-7.03048696732752[/C][/ROW]
[ROW][C]31.7971099483076[/C][/ROW]
[ROW][C]12.1548320022030[/C][/ROW]
[ROW][C]4.68160159693529[/C][/ROW]
[ROW][C]-9.03740756671427[/C][/ROW]
[ROW][C]9.58753789643614[/C][/ROW]
[ROW][C]-37.6960889359721[/C][/ROW]
[ROW][C]22.1878503684079[/C][/ROW]
[ROW][C]3.36607115249341[/C][/ROW]
[ROW][C]1.85287577893713[/C][/ROW]
[ROW][C]71.9031443406118[/C][/ROW]
[ROW][C]1.61942625439385[/C][/ROW]
[ROW][C]-22.0857798229305[/C][/ROW]
[ROW][C]11.4517740206816[/C][/ROW]
[ROW][C]-16.3821157374378[/C][/ROW]
[ROW][C]16.3834100271377[/C][/ROW]
[ROW][C]33.7669145597095[/C][/ROW]
[ROW][C]6.89709041146274[/C][/ROW]
[ROW][C]27.403546847861[/C][/ROW]
[ROW][C]58.9279066717584[/C][/ROW]
[ROW][C]9.88283834299156[/C][/ROW]
[ROW][C]-7.6069187375025[/C][/ROW]
[ROW][C]-46.9654585952233[/C][/ROW]
[ROW][C]31.0603938278567[/C][/ROW]
[ROW][C]8.65553381066564[/C][/ROW]
[ROW][C]63.8301945313868[/C][/ROW]
[ROW][C]-13.8642157908667[/C][/ROW]
[ROW][C]1.14820638567185[/C][/ROW]
[ROW][C]-33.5037265863247[/C][/ROW]
[ROW][C]-8.1850523589678[/C][/ROW]
[ROW][C]35.8799133739488[/C][/ROW]
[ROW][C]15.9786336934593[/C][/ROW]
[ROW][C]-8.5367051639819[/C][/ROW]
[ROW][C]51.619504125627[/C][/ROW]
[ROW][C]1.28152722161357[/C][/ROW]
[ROW][C]2.55607334360043[/C][/ROW]
[ROW][C]17.3098578543953[/C][/ROW]
[ROW][C]0.135900034193168[/C][/ROW]
[ROW][C]-4.29674294436115[/C][/ROW]
[ROW][C]13.4016991884049[/C][/ROW]
[/TABLE]
Source: https://freestatistics.org/blog/index.php?pk=116190&T=2

Globally Unique Identifier (entire table): ba.freestatistics.org/blog/index.php?pk=116190&T=2

As an alternative you can also use a QR Code:  

The GUIDs for individual cells are displayed in the table below:

Estimated ARIMA Residuals
Value
0.194999574829288
-28.1486988414853
-11.7808016560948
8.5279903740943
31.8475899173193
-15.2824957498166
11.1361737857702
-34.8902247409119
-7.03048696732752
31.7971099483076
12.1548320022030
4.68160159693529
-9.03740756671427
9.58753789643614
-37.6960889359721
22.1878503684079
3.36607115249341
1.85287577893713
71.9031443406118
1.61942625439385
-22.0857798229305
11.4517740206816
-16.3821157374378
16.3834100271377
33.7669145597095
6.89709041146274
27.403546847861
58.9279066717584
9.88283834299156
-7.6069187375025
-46.9654585952233
31.0603938278567
8.65553381066564
63.8301945313868
-13.8642157908667
1.14820638567185
-33.5037265863247
-8.1850523589678
35.8799133739488
15.9786336934593
-8.5367051639819
51.619504125627
1.28152722161357
2.55607334360043
17.3098578543953
0.135900034193168
-4.29674294436115
13.4016991884049


Parameters (Session):
par1 = TRUE ; par2 = 1 ; par3 = 0 ; par4 = 1 ; par5 = 12 ; par6 = 3 ; par7 = 0 ; par8 = 2 ; par9 = 1 ;
Parameters (R input):
par1 = TRUE ; par2 = 1 ; par3 = 0 ; par4 = 1 ; par5 = 12 ; par6 = 3 ; par7 = 0 ; par8 = 2 ; par9 = 1 ;
R code (references can be found in the software module):
library(lattice)
if (par1 == 'TRUE') par1 <- TRUE
if (par1 == 'FALSE') par1 <- FALSE
par2 <- as.numeric(par2) #Box-Cox lambda transformation parameter
par3 <- as.numeric(par3) #degree of non-seasonal differencing
par4 <- as.numeric(par4) #degree of seasonal differencing
par5 <- as.numeric(par5) #seasonal period
par6 <- as.numeric(par6) #degree (p) of the non-seasonal AR(p) polynomial
par7 <- as.numeric(par7) #degree (q) of the non-seasonal MA(q) polynomial
par8 <- as.numeric(par8) #degree (P) of the seasonal AR(P) polynomial
par9 <- as.numeric(par9) #degree (Q) of the seasonal MA(Q) polynomial
armaGR <- function(arima.out, names, n){
try1 <- arima.out$coef
try2 <- sqrt(diag(arima.out$var.coef))
try.data.frame <- data.frame(matrix(NA,ncol=4,nrow=length(names)))
dimnames(try.data.frame) <- list(names,c('coef','std','tstat','pv'))
try.data.frame[,1] <- try1
for(i in 1:length(try2)) try.data.frame[which(rownames(try.data.frame)==names(try2)[i]),2] <- try2[i]
try.data.frame[,3] <- try.data.frame[,1] / try.data.frame[,2]
try.data.frame[,4] <- round((1-pt(abs(try.data.frame[,3]),df=n-(length(try2)+1)))*2,5)
vector <- rep(NA,length(names))
vector[is.na(try.data.frame[,4])] <- 0
maxi <- which.max(try.data.frame[,4])
continue <- max(try.data.frame[,4],na.rm=TRUE) > .05
vector[maxi] <- 0
list(summary=try.data.frame,next.vector=vector,continue=continue)
}
arimaSelect <- function(series, order=c(13,0,0), seasonal=list(order=c(2,0,0),period=12), include.mean=F){
nrc <- order[1]+order[3]+seasonal$order[1]+seasonal$order[3]
coeff <- matrix(NA, nrow=nrc*2, ncol=nrc)
pval <- matrix(NA, nrow=nrc*2, ncol=nrc)
mylist <- rep(list(NULL), nrc)
names <- NULL
if(order[1] > 0) names <- paste('ar',1:order[1],sep='')
if(order[3] > 0) names <- c( names , paste('ma',1:order[3],sep='') )
if(seasonal$order[1] > 0) names <- c(names, paste('sar',1:seasonal$order[1],sep=''))
if(seasonal$order[3] > 0) names <- c(names, paste('sma',1:seasonal$order[3],sep=''))
arima.out <- arima(series, order=order, seasonal=seasonal, include.mean=include.mean, method='ML')
mylist[[1]] <- arima.out
last.arma <- armaGR(arima.out, names, length(series))
mystop <- FALSE
i <- 1
coeff[i,] <- last.arma[[1]][,1]
pval [i,] <- last.arma[[1]][,4]
i <- 2
aic <- arima.out$aic
while(!mystop){
mylist[[i]] <- arima.out
arima.out <- arima(series, order=order, seasonal=seasonal, include.mean=include.mean, method='ML', fixed=last.arma$next.vector)
aic <- c(aic, arima.out$aic)
last.arma <- armaGR(arima.out, names, length(series))
mystop <- !last.arma$continue
coeff[i,] <- last.arma[[1]][,1]
pval [i,] <- last.arma[[1]][,4]
i <- i+1
}
list(coeff, pval, mylist, aic=aic)
}
arimaSelectplot <- function(arimaSelect.out,noms,choix){
noms <- names(arimaSelect.out[[3]][[1]]$coef)
coeff <- arimaSelect.out[[1]]
k <- min(which(is.na(coeff[,1])))-1
coeff <- coeff[1:k,]
pval <- arimaSelect.out[[2]][1:k,]
aic <- arimaSelect.out$aic[1:k]
coeff[coeff==0] <- NA
n <- ncol(coeff)
if(missing(choix)) choix <- k
layout(matrix(c(1,1,1,2,
3,3,3,2,
3,3,3,4,
5,6,7,7),nr=4),
widths=c(10,35,45,15),
heights=c(30,30,15,15))
couleurs <- rainbow(75)[1:50]#(50)
ticks <- pretty(coeff)
par(mar=c(1,1,3,1))
plot(aic,k:1-.5,type='o',pch=21,bg='blue',cex=2,axes=F,lty=2,xpd=NA)
points(aic[choix],k-choix+.5,pch=21,cex=4,bg=2,xpd=NA)
title('aic',line=2)
par(mar=c(3,0,0,0))
plot(0,axes=F,xlab='',ylab='',xlim=range(ticks),ylim=c(.1,1))
rect(xleft = min(ticks) + (0:49)/50*(max(ticks)-min(ticks)),
xright = min(ticks) + (1:50)/50*(max(ticks)-min(ticks)),
ytop = rep(1,50),
ybottom= rep(0,50),col=couleurs,border=NA)
axis(1,ticks)
rect(xleft=min(ticks),xright=max(ticks),ytop=1,ybottom=0)
text(mean(coeff,na.rm=T),.5,'coefficients',cex=2,font=2)
par(mar=c(1,1,3,1))
image(1:n,1:k,t(coeff[k:1,]),axes=F,col=couleurs,zlim=range(ticks))
for(i in 1:n) for(j in 1:k) if(!is.na(coeff[j,i])) {
if(pval[j,i]<.01) symb = 'green'
else if( (pval[j,i]<.05) & (pval[j,i]>=.01)) symb = 'orange'
else if( (pval[j,i]<.1) & (pval[j,i]>=.05)) symb = 'red'
else symb = 'black'
polygon(c(i+.5 ,i+.2 ,i+.5 ,i+.5),
c(k-j+0.5,k-j+0.5,k-j+0.8,k-j+0.5),
col=symb)
if(j==choix) {
rect(xleft=i-.5,
xright=i+.5,
ybottom=k-j+1.5,
ytop=k-j+.5,
lwd=4)
text(i,
k-j+1,
round(coeff[j,i],2),
cex=1.2,
font=2)
}
else{
rect(xleft=i-.5,xright=i+.5,ybottom=k-j+1.5,ytop=k-j+.5)
text(i,k-j+1,round(coeff[j,i],2),cex=1.2,font=1)
}
}
axis(3,1:n,noms)
par(mar=c(0.5,0,0,0.5))
plot(0,axes=F,xlab='',ylab='',type='n',xlim=c(0,8),ylim=c(-.2,.8))
cols <- c('green','orange','red','black')
niv <- c('0','0.01','0.05','0.1')
for(i in 0:3){
polygon(c(1+2*i ,1+2*i ,1+2*i-.5 ,1+2*i),
c(.4 ,.7 , .4 , .4),
col=cols[i+1])
text(2*i,0.5,niv[i+1],cex=1.5)
}
text(8,.5,1,cex=1.5)
text(4,0,'p-value',cex=2)
box()
residus <- arimaSelect.out[[3]][[choix]]$res
par(mar=c(1,2,4,1))
acf(residus,main='')
title('acf',line=.5)
par(mar=c(1,2,4,1))
pacf(residus,main='')
title('pacf',line=.5)
par(mar=c(2,2,4,1))
qqnorm(residus,main='')
title('qq-norm',line=.5)
qqline(residus)
residus
}
if (par2 == 0) x <- log(x)
if (par2 != 0) x <- x^par2
(selection <- arimaSelect(x, order=c(par6,par3,par7), seasonal=list(order=c(par8,par4,par9), period=par5)))
bitmap(file='test1.png')
resid <- arimaSelectplot(selection)
dev.off()
resid
bitmap(file='test2.png')
acf(resid,length(resid)/2, main='Residual Autocorrelation Function')
dev.off()
bitmap(file='test3.png')
pacf(resid,length(resid)/2, main='Residual Partial Autocorrelation Function')
dev.off()
bitmap(file='test4.png')
cpgram(resid, main='Residual Cumulative Periodogram')
dev.off()
bitmap(file='test5.png')
hist(resid, main='Residual Histogram', xlab='values of Residuals')
dev.off()
bitmap(file='test6.png')
densityplot(~resid,col='black',main='Residual Density Plot', xlab='values of Residuals')
dev.off()
bitmap(file='test7.png')
qqnorm(resid, main='Residual Normal Q-Q Plot')
qqline(resid)
dev.off()
ncols <- length(selection[[1]][1,])
nrows <- length(selection[[2]][,1])-1
load(file='createtable')
a<-table.start()
a<-table.row.start(a)
a<-table.element(a,'ARIMA Parameter Estimation and Backward Selection', ncols+1,TRUE)
a<-table.row.end(a)
a<-table.row.start(a)
a<-table.element(a,'Iteration', header=TRUE)
for (i in 1:ncols) {
a<-table.element(a,names(selection[[3]][[1]]$coef)[i],header=TRUE)
}
a<-table.row.end(a)
for (j in 1:nrows) {
a<-table.row.start(a)
mydum <- 'Estimates ('
mydum <- paste(mydum,j)
mydum <- paste(mydum,')')
a<-table.element(a,mydum, header=TRUE)
for (i in 1:ncols) {
a<-table.element(a,round(selection[[1]][j,i],4))
}
a<-table.row.end(a)
a<-table.row.start(a)
a<-table.element(a,'(p-val)', header=TRUE)
for (i in 1:ncols) {
mydum <- '('
mydum <- paste(mydum,round(selection[[2]][j,i],4),sep='')
mydum <- paste(mydum,')')
a<-table.element(a,mydum)
}
a<-table.row.end(a)
}
a<-table.end(a)
table.save(a,file='mytable.tab')
a<-table.start()
a<-table.row.start(a)
a<-table.element(a,'Estimated ARIMA Residuals', 1,TRUE)
a<-table.row.end(a)
a<-table.row.start(a)
a<-table.element(a,'Value', 1,TRUE)
a<-table.row.end(a)
for (i in (par4*par5+par3):length(resid)) {
a<-table.row.start(a)
a<-table.element(a,resid[i])
a<-table.row.end(a)
}
a<-table.end(a)
table.save(a,file='mytable1.tab')