Free Statistics

of Irreproducible Research!

Author's title

Author*The author of this computation has been verified*
R Software Modulerwasp_autocorrelation.wasp
Title produced by software(Partial) Autocorrelation Function
Date of computationMon, 27 Dec 2010 23:37:26 +0000
Cite this page as followsStatistical Computations at FreeStatistics.org, Office for Research Development and Education, URL https://freestatistics.org/blog/index.php?v=date/2010/Dec/28/t129349292463hzhb2koy92kzg.htm/, Retrieved Sun, 05 May 2024 08:26:43 +0000
Statistical Computations at FreeStatistics.org, Office for Research Development and Education, URL https://freestatistics.org/blog/index.php?pk=116183, Retrieved Sun, 05 May 2024 08:26:43 +0000
QR Codes:

Original text written by user:
IsPrivate?No (this computation is public)
User-defined keywords
Estimated Impact161
Family? (F = Feedback message, R = changed R code, M = changed R Module, P = changed Parameters, D = changed Data)
-     [(Partial) Autocorrelation Function] [] [2010-12-14 13:20:01] [c91278f1cd2d8b4eeb874e50bb706c21]
-   PD  [(Partial) Autocorrelation Function] [] [2010-12-19 14:08:29] [c91278f1cd2d8b4eeb874e50bb706c21]
-    D    [(Partial) Autocorrelation Function] [] [2010-12-21 15:54:36] [c91278f1cd2d8b4eeb874e50bb706c21]
-             [(Partial) Autocorrelation Function] [] [2010-12-27 23:37:26] [4dbe485270073769796ed1462cddce37] [Current]
Feedback Forum

Post a new message
Dataseries X:
224
215
196
159
187
208
131
93
210
228
176
195
188
188
190
188
176
225
93
79
235
247
195
197
211
156
209
180
185
303
129
85
249
231
212
240
234
217
287
221
208
241
156
96
320
242
227
200
215
238
279
208
262
259
167
123
302
246
235


Summary of computational transaction
Raw Inputview raw input (R code)
Raw Outputview raw output of R engine
Computing time1 seconds
R Server'Sir Ronald Aylmer Fisher' @ 193.190.124.24

\begin{tabular}{lllllllll}
\hline
Summary of computational transaction \tabularnewline
Raw Input & view raw input (R code)  \tabularnewline
Raw Output & view raw output of R engine  \tabularnewline
Computing time & 1 seconds \tabularnewline
R Server & 'Sir Ronald Aylmer Fisher' @ 193.190.124.24 \tabularnewline
\hline
\end{tabular}
%Source: https://freestatistics.org/blog/index.php?pk=116183&T=0

[TABLE]
[ROW][C]Summary of computational transaction[/C][/ROW]
[ROW][C]Raw Input[/C][C]view raw input (R code) [/C][/ROW]
[ROW][C]Raw Output[/C][C]view raw output of R engine [/C][/ROW]
[ROW][C]Computing time[/C][C]1 seconds[/C][/ROW]
[ROW][C]R Server[/C][C]'Sir Ronald Aylmer Fisher' @ 193.190.124.24[/C][/ROW]
[/TABLE]
Source: https://freestatistics.org/blog/index.php?pk=116183&T=0

Globally Unique Identifier (entire table): ba.freestatistics.org/blog/index.php?pk=116183&T=0

As an alternative you can also use a QR Code:  

The GUIDs for individual cells are displayed in the table below:

Summary of computational transaction
Raw Inputview raw input (R code)
Raw Outputview raw output of R engine
Computing time1 seconds
R Server'Sir Ronald Aylmer Fisher' @ 193.190.124.24


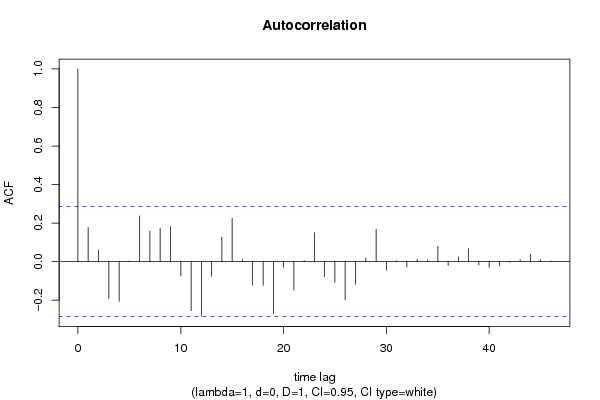
Autocorrelation Function
Time lag kACF(k)T-STATP-value
10.1771511.21450.115315
20.0601380.41230.341002
3-0.192048-1.31660.097176
4-0.205836-1.41110.082394
50.0030820.02110.491615
60.2364051.62070.055885
70.1581021.08390.141971
80.1727031.1840.121184
90.1808951.24020.110537
10-0.074365-0.50980.30628
11-0.255204-1.74960.043358
12-0.28286-1.93920.029247
13-0.076669-0.52560.300813
140.1267550.8690.194635
150.2241291.53660.065554
160.0101650.06970.472368
17-0.121614-0.83370.204321
18-0.12261-0.84060.202421
19-0.270078-1.85160.035188
20-0.029663-0.20340.419865
21-0.149126-1.02240.155923
220.006230.04270.483055
230.1492121.02290.155785
24-0.078052-0.53510.297553
25-0.107666-0.73810.232055
26-0.197465-1.35380.091145
27-0.117795-0.80760.211706
280.0194580.13340.447226
290.1677981.15040.127907
30-0.045259-0.31030.37886
310.0047010.03220.487214
32-0.026631-0.18260.427959
330.0104770.07180.471521
340.0077880.05340.478824
350.0800480.54880.292876
36-0.020873-0.14310.443413
370.0254390.17440.431149
380.0665510.45630.325155
39-0.017654-0.1210.45209
40-0.029825-0.20450.419434
41-0.023488-0.1610.436382
42-0.004435-0.03040.487938
430.0094880.0650.474206
440.0391360.26830.394819
450.0101760.06980.47234
460.0031890.02190.491324
47NANANA
48NANANA

\begin{tabular}{lllllllll}
\hline
Autocorrelation Function \tabularnewline
Time lag k & ACF(k) & T-STAT & P-value \tabularnewline
1 & 0.177151 & 1.2145 & 0.115315 \tabularnewline
2 & 0.060138 & 0.4123 & 0.341002 \tabularnewline
3 & -0.192048 & -1.3166 & 0.097176 \tabularnewline
4 & -0.205836 & -1.4111 & 0.082394 \tabularnewline
5 & 0.003082 & 0.0211 & 0.491615 \tabularnewline
6 & 0.236405 & 1.6207 & 0.055885 \tabularnewline
7 & 0.158102 & 1.0839 & 0.141971 \tabularnewline
8 & 0.172703 & 1.184 & 0.121184 \tabularnewline
9 & 0.180895 & 1.2402 & 0.110537 \tabularnewline
10 & -0.074365 & -0.5098 & 0.30628 \tabularnewline
11 & -0.255204 & -1.7496 & 0.043358 \tabularnewline
12 & -0.28286 & -1.9392 & 0.029247 \tabularnewline
13 & -0.076669 & -0.5256 & 0.300813 \tabularnewline
14 & 0.126755 & 0.869 & 0.194635 \tabularnewline
15 & 0.224129 & 1.5366 & 0.065554 \tabularnewline
16 & 0.010165 & 0.0697 & 0.472368 \tabularnewline
17 & -0.121614 & -0.8337 & 0.204321 \tabularnewline
18 & -0.12261 & -0.8406 & 0.202421 \tabularnewline
19 & -0.270078 & -1.8516 & 0.035188 \tabularnewline
20 & -0.029663 & -0.2034 & 0.419865 \tabularnewline
21 & -0.149126 & -1.0224 & 0.155923 \tabularnewline
22 & 0.00623 & 0.0427 & 0.483055 \tabularnewline
23 & 0.149212 & 1.0229 & 0.155785 \tabularnewline
24 & -0.078052 & -0.5351 & 0.297553 \tabularnewline
25 & -0.107666 & -0.7381 & 0.232055 \tabularnewline
26 & -0.197465 & -1.3538 & 0.091145 \tabularnewline
27 & -0.117795 & -0.8076 & 0.211706 \tabularnewline
28 & 0.019458 & 0.1334 & 0.447226 \tabularnewline
29 & 0.167798 & 1.1504 & 0.127907 \tabularnewline
30 & -0.045259 & -0.3103 & 0.37886 \tabularnewline
31 & 0.004701 & 0.0322 & 0.487214 \tabularnewline
32 & -0.026631 & -0.1826 & 0.427959 \tabularnewline
33 & 0.010477 & 0.0718 & 0.471521 \tabularnewline
34 & 0.007788 & 0.0534 & 0.478824 \tabularnewline
35 & 0.080048 & 0.5488 & 0.292876 \tabularnewline
36 & -0.020873 & -0.1431 & 0.443413 \tabularnewline
37 & 0.025439 & 0.1744 & 0.431149 \tabularnewline
38 & 0.066551 & 0.4563 & 0.325155 \tabularnewline
39 & -0.017654 & -0.121 & 0.45209 \tabularnewline
40 & -0.029825 & -0.2045 & 0.419434 \tabularnewline
41 & -0.023488 & -0.161 & 0.436382 \tabularnewline
42 & -0.004435 & -0.0304 & 0.487938 \tabularnewline
43 & 0.009488 & 0.065 & 0.474206 \tabularnewline
44 & 0.039136 & 0.2683 & 0.394819 \tabularnewline
45 & 0.010176 & 0.0698 & 0.47234 \tabularnewline
46 & 0.003189 & 0.0219 & 0.491324 \tabularnewline
47 & NA & NA & NA \tabularnewline
48 & NA & NA & NA \tabularnewline
\hline
\end{tabular}
%Source: https://freestatistics.org/blog/index.php?pk=116183&T=1

[TABLE]
[ROW][C]Autocorrelation Function[/C][/ROW]
[ROW][C]Time lag k[/C][C]ACF(k)[/C][C]T-STAT[/C][C]P-value[/C][/ROW]
[ROW][C]1[/C][C]0.177151[/C][C]1.2145[/C][C]0.115315[/C][/ROW]
[ROW][C]2[/C][C]0.060138[/C][C]0.4123[/C][C]0.341002[/C][/ROW]
[ROW][C]3[/C][C]-0.192048[/C][C]-1.3166[/C][C]0.097176[/C][/ROW]
[ROW][C]4[/C][C]-0.205836[/C][C]-1.4111[/C][C]0.082394[/C][/ROW]
[ROW][C]5[/C][C]0.003082[/C][C]0.0211[/C][C]0.491615[/C][/ROW]
[ROW][C]6[/C][C]0.236405[/C][C]1.6207[/C][C]0.055885[/C][/ROW]
[ROW][C]7[/C][C]0.158102[/C][C]1.0839[/C][C]0.141971[/C][/ROW]
[ROW][C]8[/C][C]0.172703[/C][C]1.184[/C][C]0.121184[/C][/ROW]
[ROW][C]9[/C][C]0.180895[/C][C]1.2402[/C][C]0.110537[/C][/ROW]
[ROW][C]10[/C][C]-0.074365[/C][C]-0.5098[/C][C]0.30628[/C][/ROW]
[ROW][C]11[/C][C]-0.255204[/C][C]-1.7496[/C][C]0.043358[/C][/ROW]
[ROW][C]12[/C][C]-0.28286[/C][C]-1.9392[/C][C]0.029247[/C][/ROW]
[ROW][C]13[/C][C]-0.076669[/C][C]-0.5256[/C][C]0.300813[/C][/ROW]
[ROW][C]14[/C][C]0.126755[/C][C]0.869[/C][C]0.194635[/C][/ROW]
[ROW][C]15[/C][C]0.224129[/C][C]1.5366[/C][C]0.065554[/C][/ROW]
[ROW][C]16[/C][C]0.010165[/C][C]0.0697[/C][C]0.472368[/C][/ROW]
[ROW][C]17[/C][C]-0.121614[/C][C]-0.8337[/C][C]0.204321[/C][/ROW]
[ROW][C]18[/C][C]-0.12261[/C][C]-0.8406[/C][C]0.202421[/C][/ROW]
[ROW][C]19[/C][C]-0.270078[/C][C]-1.8516[/C][C]0.035188[/C][/ROW]
[ROW][C]20[/C][C]-0.029663[/C][C]-0.2034[/C][C]0.419865[/C][/ROW]
[ROW][C]21[/C][C]-0.149126[/C][C]-1.0224[/C][C]0.155923[/C][/ROW]
[ROW][C]22[/C][C]0.00623[/C][C]0.0427[/C][C]0.483055[/C][/ROW]
[ROW][C]23[/C][C]0.149212[/C][C]1.0229[/C][C]0.155785[/C][/ROW]
[ROW][C]24[/C][C]-0.078052[/C][C]-0.5351[/C][C]0.297553[/C][/ROW]
[ROW][C]25[/C][C]-0.107666[/C][C]-0.7381[/C][C]0.232055[/C][/ROW]
[ROW][C]26[/C][C]-0.197465[/C][C]-1.3538[/C][C]0.091145[/C][/ROW]
[ROW][C]27[/C][C]-0.117795[/C][C]-0.8076[/C][C]0.211706[/C][/ROW]
[ROW][C]28[/C][C]0.019458[/C][C]0.1334[/C][C]0.447226[/C][/ROW]
[ROW][C]29[/C][C]0.167798[/C][C]1.1504[/C][C]0.127907[/C][/ROW]
[ROW][C]30[/C][C]-0.045259[/C][C]-0.3103[/C][C]0.37886[/C][/ROW]
[ROW][C]31[/C][C]0.004701[/C][C]0.0322[/C][C]0.487214[/C][/ROW]
[ROW][C]32[/C][C]-0.026631[/C][C]-0.1826[/C][C]0.427959[/C][/ROW]
[ROW][C]33[/C][C]0.010477[/C][C]0.0718[/C][C]0.471521[/C][/ROW]
[ROW][C]34[/C][C]0.007788[/C][C]0.0534[/C][C]0.478824[/C][/ROW]
[ROW][C]35[/C][C]0.080048[/C][C]0.5488[/C][C]0.292876[/C][/ROW]
[ROW][C]36[/C][C]-0.020873[/C][C]-0.1431[/C][C]0.443413[/C][/ROW]
[ROW][C]37[/C][C]0.025439[/C][C]0.1744[/C][C]0.431149[/C][/ROW]
[ROW][C]38[/C][C]0.066551[/C][C]0.4563[/C][C]0.325155[/C][/ROW]
[ROW][C]39[/C][C]-0.017654[/C][C]-0.121[/C][C]0.45209[/C][/ROW]
[ROW][C]40[/C][C]-0.029825[/C][C]-0.2045[/C][C]0.419434[/C][/ROW]
[ROW][C]41[/C][C]-0.023488[/C][C]-0.161[/C][C]0.436382[/C][/ROW]
[ROW][C]42[/C][C]-0.004435[/C][C]-0.0304[/C][C]0.487938[/C][/ROW]
[ROW][C]43[/C][C]0.009488[/C][C]0.065[/C][C]0.474206[/C][/ROW]
[ROW][C]44[/C][C]0.039136[/C][C]0.2683[/C][C]0.394819[/C][/ROW]
[ROW][C]45[/C][C]0.010176[/C][C]0.0698[/C][C]0.47234[/C][/ROW]
[ROW][C]46[/C][C]0.003189[/C][C]0.0219[/C][C]0.491324[/C][/ROW]
[ROW][C]47[/C][C]NA[/C][C]NA[/C][C]NA[/C][/ROW]
[ROW][C]48[/C][C]NA[/C][C]NA[/C][C]NA[/C][/ROW]
[/TABLE]
Source: https://freestatistics.org/blog/index.php?pk=116183&T=1

Globally Unique Identifier (entire table): ba.freestatistics.org/blog/index.php?pk=116183&T=1

As an alternative you can also use a QR Code:  

The GUIDs for individual cells are displayed in the table below:

Autocorrelation Function
Time lag kACF(k)T-STATP-value
10.1771511.21450.115315
20.0601380.41230.341002
3-0.192048-1.31660.097176
4-0.205836-1.41110.082394
50.0030820.02110.491615
60.2364051.62070.055885
70.1581021.08390.141971
80.1727031.1840.121184
90.1808951.24020.110537
10-0.074365-0.50980.30628
11-0.255204-1.74960.043358
12-0.28286-1.93920.029247
13-0.076669-0.52560.300813
140.1267550.8690.194635
150.2241291.53660.065554
160.0101650.06970.472368
17-0.121614-0.83370.204321
18-0.12261-0.84060.202421
19-0.270078-1.85160.035188
20-0.029663-0.20340.419865
21-0.149126-1.02240.155923
220.006230.04270.483055
230.1492121.02290.155785
24-0.078052-0.53510.297553
25-0.107666-0.73810.232055
26-0.197465-1.35380.091145
27-0.117795-0.80760.211706
280.0194580.13340.447226
290.1677981.15040.127907
30-0.045259-0.31030.37886
310.0047010.03220.487214
32-0.026631-0.18260.427959
330.0104770.07180.471521
340.0077880.05340.478824
350.0800480.54880.292876
36-0.020873-0.14310.443413
370.0254390.17440.431149
380.0665510.45630.325155
39-0.017654-0.1210.45209
40-0.029825-0.20450.419434
41-0.023488-0.1610.436382
42-0.004435-0.03040.487938
430.0094880.0650.474206
440.0391360.26830.394819
450.0101760.06980.47234
460.0031890.02190.491324
47NANANA
48NANANA


Partial Autocorrelation Function
Time lag kPACF(k)T-STATP-value
10.1771511.21450.115315
20.0296880.20350.4198
3-0.214561-1.4710.073984
4-0.14904-1.02180.156061
50.0948160.650.259421
60.2356711.61570.056429
70.01610.11040.456292
80.0909250.62340.268034
90.2590031.77560.041134
10-0.047797-0.32770.372304
11-0.300334-2.0590.022531
12-0.228832-1.56880.061703
130.0692560.47480.318566
140.0405950.27830.391
15-0.085294-0.58470.280757
16-0.135956-0.93210.178032
170.0423720.29050.386361
180.1432410.9820.165562
19-0.268768-1.84260.035852
200.0154770.10610.457976
21-0.044373-0.30420.381156
22-0.056122-0.38480.351078
23-0.004029-0.02760.489042
24-0.287781-1.97290.027201
250.0358840.2460.403374
260.0438160.30040.382604
270.016270.11150.455832
28-0.018462-0.12660.44991
290.0974010.66770.25378
30-0.034198-0.23450.407827
31-0.043517-0.29830.38338
32-0.009353-0.06410.474572
330.048580.3330.370291
340.0553030.37910.353147
350.0157030.10770.457364
36-0.116913-0.80150.213433
37-0.083268-0.57090.285408
38-0.045752-0.31370.377584
390.1208950.82880.2057
40-0.129115-0.88520.190287
41-0.166882-1.14410.12919
420.0282060.19340.423751
43-0.095956-0.65780.256925
440.0208950.14320.443353
45-0.050278-0.34470.365932
460.0548340.37590.354333
47NANANA
48NANANA

\begin{tabular}{lllllllll}
\hline
Partial Autocorrelation Function \tabularnewline
Time lag k & PACF(k) & T-STAT & P-value \tabularnewline
1 & 0.177151 & 1.2145 & 0.115315 \tabularnewline
2 & 0.029688 & 0.2035 & 0.4198 \tabularnewline
3 & -0.214561 & -1.471 & 0.073984 \tabularnewline
4 & -0.14904 & -1.0218 & 0.156061 \tabularnewline
5 & 0.094816 & 0.65 & 0.259421 \tabularnewline
6 & 0.235671 & 1.6157 & 0.056429 \tabularnewline
7 & 0.0161 & 0.1104 & 0.456292 \tabularnewline
8 & 0.090925 & 0.6234 & 0.268034 \tabularnewline
9 & 0.259003 & 1.7756 & 0.041134 \tabularnewline
10 & -0.047797 & -0.3277 & 0.372304 \tabularnewline
11 & -0.300334 & -2.059 & 0.022531 \tabularnewline
12 & -0.228832 & -1.5688 & 0.061703 \tabularnewline
13 & 0.069256 & 0.4748 & 0.318566 \tabularnewline
14 & 0.040595 & 0.2783 & 0.391 \tabularnewline
15 & -0.085294 & -0.5847 & 0.280757 \tabularnewline
16 & -0.135956 & -0.9321 & 0.178032 \tabularnewline
17 & 0.042372 & 0.2905 & 0.386361 \tabularnewline
18 & 0.143241 & 0.982 & 0.165562 \tabularnewline
19 & -0.268768 & -1.8426 & 0.035852 \tabularnewline
20 & 0.015477 & 0.1061 & 0.457976 \tabularnewline
21 & -0.044373 & -0.3042 & 0.381156 \tabularnewline
22 & -0.056122 & -0.3848 & 0.351078 \tabularnewline
23 & -0.004029 & -0.0276 & 0.489042 \tabularnewline
24 & -0.287781 & -1.9729 & 0.027201 \tabularnewline
25 & 0.035884 & 0.246 & 0.403374 \tabularnewline
26 & 0.043816 & 0.3004 & 0.382604 \tabularnewline
27 & 0.01627 & 0.1115 & 0.455832 \tabularnewline
28 & -0.018462 & -0.1266 & 0.44991 \tabularnewline
29 & 0.097401 & 0.6677 & 0.25378 \tabularnewline
30 & -0.034198 & -0.2345 & 0.407827 \tabularnewline
31 & -0.043517 & -0.2983 & 0.38338 \tabularnewline
32 & -0.009353 & -0.0641 & 0.474572 \tabularnewline
33 & 0.04858 & 0.333 & 0.370291 \tabularnewline
34 & 0.055303 & 0.3791 & 0.353147 \tabularnewline
35 & 0.015703 & 0.1077 & 0.457364 \tabularnewline
36 & -0.116913 & -0.8015 & 0.213433 \tabularnewline
37 & -0.083268 & -0.5709 & 0.285408 \tabularnewline
38 & -0.045752 & -0.3137 & 0.377584 \tabularnewline
39 & 0.120895 & 0.8288 & 0.2057 \tabularnewline
40 & -0.129115 & -0.8852 & 0.190287 \tabularnewline
41 & -0.166882 & -1.1441 & 0.12919 \tabularnewline
42 & 0.028206 & 0.1934 & 0.423751 \tabularnewline
43 & -0.095956 & -0.6578 & 0.256925 \tabularnewline
44 & 0.020895 & 0.1432 & 0.443353 \tabularnewline
45 & -0.050278 & -0.3447 & 0.365932 \tabularnewline
46 & 0.054834 & 0.3759 & 0.354333 \tabularnewline
47 & NA & NA & NA \tabularnewline
48 & NA & NA & NA \tabularnewline
\hline
\end{tabular}
%Source: https://freestatistics.org/blog/index.php?pk=116183&T=2

[TABLE]
[ROW][C]Partial Autocorrelation Function[/C][/ROW]
[ROW][C]Time lag k[/C][C]PACF(k)[/C][C]T-STAT[/C][C]P-value[/C][/ROW]
[ROW][C]1[/C][C]0.177151[/C][C]1.2145[/C][C]0.115315[/C][/ROW]
[ROW][C]2[/C][C]0.029688[/C][C]0.2035[/C][C]0.4198[/C][/ROW]
[ROW][C]3[/C][C]-0.214561[/C][C]-1.471[/C][C]0.073984[/C][/ROW]
[ROW][C]4[/C][C]-0.14904[/C][C]-1.0218[/C][C]0.156061[/C][/ROW]
[ROW][C]5[/C][C]0.094816[/C][C]0.65[/C][C]0.259421[/C][/ROW]
[ROW][C]6[/C][C]0.235671[/C][C]1.6157[/C][C]0.056429[/C][/ROW]
[ROW][C]7[/C][C]0.0161[/C][C]0.1104[/C][C]0.456292[/C][/ROW]
[ROW][C]8[/C][C]0.090925[/C][C]0.6234[/C][C]0.268034[/C][/ROW]
[ROW][C]9[/C][C]0.259003[/C][C]1.7756[/C][C]0.041134[/C][/ROW]
[ROW][C]10[/C][C]-0.047797[/C][C]-0.3277[/C][C]0.372304[/C][/ROW]
[ROW][C]11[/C][C]-0.300334[/C][C]-2.059[/C][C]0.022531[/C][/ROW]
[ROW][C]12[/C][C]-0.228832[/C][C]-1.5688[/C][C]0.061703[/C][/ROW]
[ROW][C]13[/C][C]0.069256[/C][C]0.4748[/C][C]0.318566[/C][/ROW]
[ROW][C]14[/C][C]0.040595[/C][C]0.2783[/C][C]0.391[/C][/ROW]
[ROW][C]15[/C][C]-0.085294[/C][C]-0.5847[/C][C]0.280757[/C][/ROW]
[ROW][C]16[/C][C]-0.135956[/C][C]-0.9321[/C][C]0.178032[/C][/ROW]
[ROW][C]17[/C][C]0.042372[/C][C]0.2905[/C][C]0.386361[/C][/ROW]
[ROW][C]18[/C][C]0.143241[/C][C]0.982[/C][C]0.165562[/C][/ROW]
[ROW][C]19[/C][C]-0.268768[/C][C]-1.8426[/C][C]0.035852[/C][/ROW]
[ROW][C]20[/C][C]0.015477[/C][C]0.1061[/C][C]0.457976[/C][/ROW]
[ROW][C]21[/C][C]-0.044373[/C][C]-0.3042[/C][C]0.381156[/C][/ROW]
[ROW][C]22[/C][C]-0.056122[/C][C]-0.3848[/C][C]0.351078[/C][/ROW]
[ROW][C]23[/C][C]-0.004029[/C][C]-0.0276[/C][C]0.489042[/C][/ROW]
[ROW][C]24[/C][C]-0.287781[/C][C]-1.9729[/C][C]0.027201[/C][/ROW]
[ROW][C]25[/C][C]0.035884[/C][C]0.246[/C][C]0.403374[/C][/ROW]
[ROW][C]26[/C][C]0.043816[/C][C]0.3004[/C][C]0.382604[/C][/ROW]
[ROW][C]27[/C][C]0.01627[/C][C]0.1115[/C][C]0.455832[/C][/ROW]
[ROW][C]28[/C][C]-0.018462[/C][C]-0.1266[/C][C]0.44991[/C][/ROW]
[ROW][C]29[/C][C]0.097401[/C][C]0.6677[/C][C]0.25378[/C][/ROW]
[ROW][C]30[/C][C]-0.034198[/C][C]-0.2345[/C][C]0.407827[/C][/ROW]
[ROW][C]31[/C][C]-0.043517[/C][C]-0.2983[/C][C]0.38338[/C][/ROW]
[ROW][C]32[/C][C]-0.009353[/C][C]-0.0641[/C][C]0.474572[/C][/ROW]
[ROW][C]33[/C][C]0.04858[/C][C]0.333[/C][C]0.370291[/C][/ROW]
[ROW][C]34[/C][C]0.055303[/C][C]0.3791[/C][C]0.353147[/C][/ROW]
[ROW][C]35[/C][C]0.015703[/C][C]0.1077[/C][C]0.457364[/C][/ROW]
[ROW][C]36[/C][C]-0.116913[/C][C]-0.8015[/C][C]0.213433[/C][/ROW]
[ROW][C]37[/C][C]-0.083268[/C][C]-0.5709[/C][C]0.285408[/C][/ROW]
[ROW][C]38[/C][C]-0.045752[/C][C]-0.3137[/C][C]0.377584[/C][/ROW]
[ROW][C]39[/C][C]0.120895[/C][C]0.8288[/C][C]0.2057[/C][/ROW]
[ROW][C]40[/C][C]-0.129115[/C][C]-0.8852[/C][C]0.190287[/C][/ROW]
[ROW][C]41[/C][C]-0.166882[/C][C]-1.1441[/C][C]0.12919[/C][/ROW]
[ROW][C]42[/C][C]0.028206[/C][C]0.1934[/C][C]0.423751[/C][/ROW]
[ROW][C]43[/C][C]-0.095956[/C][C]-0.6578[/C][C]0.256925[/C][/ROW]
[ROW][C]44[/C][C]0.020895[/C][C]0.1432[/C][C]0.443353[/C][/ROW]
[ROW][C]45[/C][C]-0.050278[/C][C]-0.3447[/C][C]0.365932[/C][/ROW]
[ROW][C]46[/C][C]0.054834[/C][C]0.3759[/C][C]0.354333[/C][/ROW]
[ROW][C]47[/C][C]NA[/C][C]NA[/C][C]NA[/C][/ROW]
[ROW][C]48[/C][C]NA[/C][C]NA[/C][C]NA[/C][/ROW]
[/TABLE]
Source: https://freestatistics.org/blog/index.php?pk=116183&T=2

Globally Unique Identifier (entire table): ba.freestatistics.org/blog/index.php?pk=116183&T=2

As an alternative you can also use a QR Code:  

The GUIDs for individual cells are displayed in the table below:

Partial Autocorrelation Function
Time lag kPACF(k)T-STATP-value
10.1771511.21450.115315
20.0296880.20350.4198
3-0.214561-1.4710.073984
4-0.14904-1.02180.156061
50.0948160.650.259421
60.2356711.61570.056429
70.01610.11040.456292
80.0909250.62340.268034
90.2590031.77560.041134
10-0.047797-0.32770.372304
11-0.300334-2.0590.022531
12-0.228832-1.56880.061703
130.0692560.47480.318566
140.0405950.27830.391
15-0.085294-0.58470.280757
16-0.135956-0.93210.178032
170.0423720.29050.386361
180.1432410.9820.165562
19-0.268768-1.84260.035852
200.0154770.10610.457976
21-0.044373-0.30420.381156
22-0.056122-0.38480.351078
23-0.004029-0.02760.489042
24-0.287781-1.97290.027201
250.0358840.2460.403374
260.0438160.30040.382604
270.016270.11150.455832
28-0.018462-0.12660.44991
290.0974010.66770.25378
30-0.034198-0.23450.407827
31-0.043517-0.29830.38338
32-0.009353-0.06410.474572
330.048580.3330.370291
340.0553030.37910.353147
350.0157030.10770.457364
36-0.116913-0.80150.213433
37-0.083268-0.57090.285408
38-0.045752-0.31370.377584
390.1208950.82880.2057
40-0.129115-0.88520.190287
41-0.166882-1.14410.12919
420.0282060.19340.423751
43-0.095956-0.65780.256925
440.0208950.14320.443353
45-0.050278-0.34470.365932
460.0548340.37590.354333
47NANANA
48NANANA


Parameters (Session):
par1 = 48 ; par2 = 1 ; par3 = 0 ; par4 = 1 ; par5 = 12 ; par6 = White Noise ; par7 = 0.95 ;
Parameters (R input):
par1 = 48 ; par2 = 1 ; par3 = 0 ; par4 = 1 ; par5 = 12 ; par6 = White Noise ; par7 = 0.95 ; par8 = ;
R code (references can be found in the software module):
if (par1 == 'Default') {
par1 = 10*log10(length(x))
} else {
par1 <- as.numeric(par1)
}
par2 <- as.numeric(par2)
par3 <- as.numeric(par3)
par4 <- as.numeric(par4)
par5 <- as.numeric(par5)
if (par6 == 'White Noise') par6 <- 'white' else par6 <- 'ma'
par7 <- as.numeric(par7)
if (par2 == 0) {
x <- log(x)
} else {
x <- (x ^ par2 - 1) / par2
}
if (par3 > 0) x <- diff(x,lag=1,difference=par3)
if (par4 > 0) x <- diff(x,lag=par5,difference=par4)
bitmap(file='pic1.png')
racf <- acf(x, par1, main='Autocorrelation', xlab='time lag', ylab='ACF', ci.type=par6, ci=par7, sub=paste('(lambda=',par2,', d=',par3,', D=',par4,', CI=', par7, ', CI type=',par6,')',sep=''))
dev.off()
bitmap(file='pic2.png')
rpacf <- pacf(x,par1,main='Partial Autocorrelation',xlab='lags',ylab='PACF')
dev.off()
(myacf <- c(racf$acf))
(mypacf <- c(rpacf$acf))
lengthx <- length(x)
sqrtn <- sqrt(lengthx)
load(file='createtable')
a<-table.start()
a<-table.row.start(a)
a<-table.element(a,'Autocorrelation Function',4,TRUE)
a<-table.row.end(a)
a<-table.row.start(a)
a<-table.element(a,'Time lag k',header=TRUE)
a<-table.element(a,hyperlink('basics.htm','ACF(k)','click here for more information about the Autocorrelation Function'),header=TRUE)
a<-table.element(a,'T-STAT',header=TRUE)
a<-table.element(a,'P-value',header=TRUE)
a<-table.row.end(a)
for (i in 2:(par1+1)) {
a<-table.row.start(a)
a<-table.element(a,i-1,header=TRUE)
a<-table.element(a,round(myacf[i],6))
mytstat <- myacf[i]*sqrtn
a<-table.element(a,round(mytstat,4))
a<-table.element(a,round(1-pt(abs(mytstat),lengthx),6))
a<-table.row.end(a)
}
a<-table.end(a)
table.save(a,file='mytable.tab')
a<-table.start()
a<-table.row.start(a)
a<-table.element(a,'Partial Autocorrelation Function',4,TRUE)
a<-table.row.end(a)
a<-table.row.start(a)
a<-table.element(a,'Time lag k',header=TRUE)
a<-table.element(a,hyperlink('basics.htm','PACF(k)','click here for more information about the Partial Autocorrelation Function'),header=TRUE)
a<-table.element(a,'T-STAT',header=TRUE)
a<-table.element(a,'P-value',header=TRUE)
a<-table.row.end(a)
for (i in 1:par1) {
a<-table.row.start(a)
a<-table.element(a,i,header=TRUE)
a<-table.element(a,round(mypacf[i],6))
mytstat <- mypacf[i]*sqrtn
a<-table.element(a,round(mytstat,4))
a<-table.element(a,round(1-pt(abs(mytstat),lengthx),6))
a<-table.row.end(a)
}
a<-table.end(a)
table.save(a,file='mytable1.tab')