| Multiple Linear Regression - Estimated Regression Equation |
| Lening[t] = + 5.84015665054135 -0.702885208147645Huis[t] + 0.273548430791847M1[t] + 0.00364588524323202M2[t] + 0.446708863076928M3[t] + 0.00291691649522005M4[t] + 0.0254458225848275M5[t] + 0.466521896196587M6[t] -0.202668557765756M7[t] -0.108668912703735M8[t] -0.123855902024262M9[t] + 0.162821460073184M10[t] -0.396263611734106M11[t] + 0.0382594099127257t + e[t] |
| Multiple Linear Regression - Ordinary Least Squares | |||||
| Variable | Parameter | S.D. | T-STAT H0: parameter = 0 | 2-tail p-value | 1-tail p-value |
| (Intercept) | 5.84015665054135 | 0.424129 | 13.7698 | 0 | 0 |
| Huis | -0.702885208147645 | 0.089137 | -7.8855 | 0 | 0 |
| M1 | 0.273548430791847 | 0.243719 | 1.1224 | 0.266662 | 0.133331 |
| M2 | 0.00364588524323202 | 0.244706 | 0.0149 | 0.988168 | 0.494084 |
| M3 | 0.446708863076928 | 0.24677 | 1.8102 | 0.075827 | 0.037913 |
| M4 | 0.00291691649522005 | 0.243581 | 0.012 | 0.99049 | 0.495245 |
| M5 | 0.0254458225848275 | 0.243497 | 0.1045 | 0.917158 | 0.458579 |
| M6 | 0.466521896196587 | 0.248222 | 1.8795 | 0.065582 | 0.032791 |
| M7 | -0.202668557765756 | 0.246871 | -0.821 | 0.415284 | 0.207642 |
| M8 | -0.108668912703735 | 0.245279 | -0.443 | 0.659505 | 0.329753 |
| M9 | -0.123855902024262 | 0.254517 | -0.4866 | 0.628488 | 0.314244 |
| M10 | 0.162821460073184 | 0.255252 | 0.6379 | 0.526244 | 0.263122 |
| M11 | -0.396263611734106 | 0.258772 | -1.5313 | 0.131527 | 0.065763 |
| t | 0.0382594099127257 | 0.002676 | 14.2948 | 0 | 0 |
| Multiple Linear Regression - Regression Statistics | |
| Multiple R | 0.894432607624306 |
| R-squared | 0.800009689581615 |
| Adjusted R-squared | 0.751863874110523 |
| F-TEST (value) | 16.6163908899196 |
| F-TEST (DF numerator) | 13 |
| F-TEST (DF denominator) | 54 |
| p-value | 1.98729921407903e-14 |
| Multiple Linear Regression - Residual Statistics | |
| Residual Standard Deviation | 0.401866393352976 |
| Sum Squared Residuals | 8.72081629775257 |
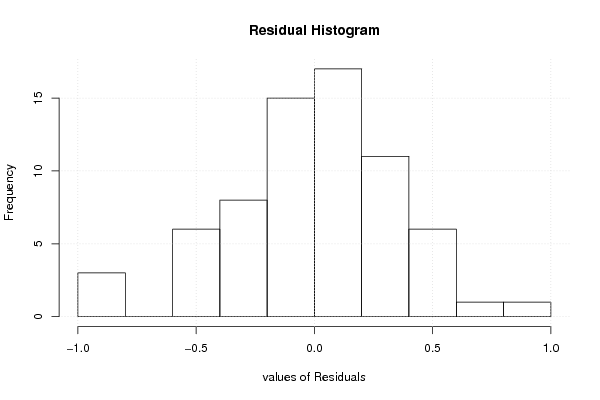
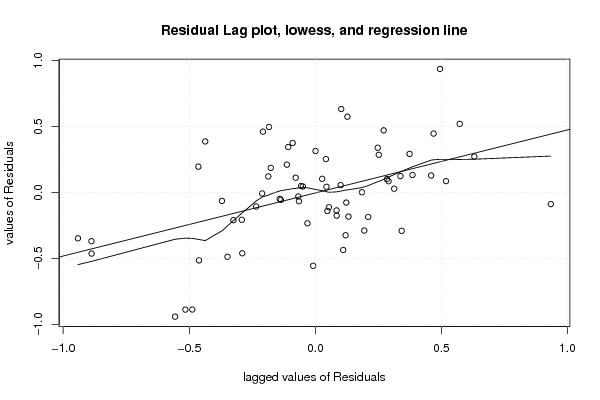
| Multiple Linear Regression - Actuals, Interpolation, and Residuals | |||
| Time or Index | Actuals | Interpolation Forecast | Residuals Prediction Error |
| 1 | 4.24 | 3.79519038832687 | 0.444809611673127 |
| 2 | 4.15 | 3.68092908245163 | 0.469070917548367 |
| 3 | 3.93 | 3.65898566116434 | 0.271014338835657 |
| 4 | 3.7 | 3.06929719996068 | 0.630702800039322 |
| 5 | 3.7 | 3.59750417938119 | 0.102495820618806 |
| 6 | 3.65 | 3.6227758184423 | 0.0272241815576986 |
| 7 | 3.55 | 3.23715171203621 | 0.312848287963789 |
| 8 | 3.43 | 3.42915600970351 | 0.000843990296492454 |
| 9 | 3.47 | 3.28494175075657 | 0.185058249243433 |
| 10 | 3.58 | 3.7567815312696 | -0.176781531269597 |
| 11 | 3.67 | 3.58528981782441 | 0.084710182175588 |
| 12 | 3.72 | 3.20165445718739 | 0.518345542812615 |
| 13 | 3.8 | 3.22738801817587 | 0.572611981824134 |
| 14 | 3.76 | 3.63255888112174 | 0.127441118878256 |
| 15 | 3.63 | 3.17060931953403 | 0.459390680465973 |
| 16 | 3.48 | 3.6879650611629 | -0.207965061162901 |
| 17 | 3.41 | 3.70166006821934 | -0.291660068219342 |
| 18 | 3.43 | 3.08730616786609 | 0.342693832133908 |
| 19 | 3.5 | 3.60770109476232 | -0.107701094762316 |
| 20 | 3.62 | 3.85453043866513 | -0.234530438665129 |
| 21 | 3.58 | 3.61120936536937 | -0.0312093653693708 |
| 22 | 3.52 | 3.58751507413831 | -0.0675150741383104 |
| 23 | 3.45 | 3.51513017504194 | -0.0651301750419436 |
| 24 | 3.36 | 3.73035301174671 | -0.37035301174671 |
| 25 | 3.27 | 4.15813691179564 | -0.888136911795644 |
| 26 | 3.21 | 3.72546860662953 | -0.515468606629529 |
| 27 | 3.19 | 3.65151167993931 | -0.461511679939312 |
| 28 | 3.16 | 3.44981585363315 | -0.289815853633145 |
| 29 | 3.12 | 2.92580367645664 | 0.194196323543362 |
| 30 | 3.06 | 3.52392676015808 | -0.463926760158076 |
| 31 | 3.01 | 3.89741867855144 | -0.887418678551442 |
| 32 | 2.98 | 3.46807245221622 | -0.488072452216221 |
| 33 | 2.97 | 3.3182351116041 | -0.348235111604099 |
| 34 | 3.02 | 3.96157888290515 | -0.941578882905154 |
| 35 | 3.07 | 3.62631491596157 | -0.556314915961568 |
| 36 | 3.18 | 3.18855739429717 | -0.00855739429717252 |
| 37 | 3.29 | 3.50106812020989 | -0.211068120209893 |
| 38 | 3.43 | 3.75511866340403 | -0.325118663404026 |
| 39 | 3.61 | 3.48997696009765 | 0.12002303990235 |
| 40 | 3.74 | 3.92650090278955 | -0.186500902789545 |
| 41 | 3.87 | 3.66044759700322 | 0.209552402996776 |
| 42 | 3.88 | 3.99288007202485 | -0.112880072024851 |
| 43 | 4.09 | 4.03601594258882 | 0.0539840574111749 |
| 44 | 4.19 | 4.08955185425104 | 0.100448145748965 |
| 45 | 4.2 | 3.91581641656189 | 0.284183583438107 |
| 46 | 4.29 | 4.03832224862554 | 0.251677751374457 |
| 47 | 4.37 | 4.32792323172521 | 0.0420767682747863 |
| 48 | 4.47 | 4.42576423866932 | 0.0442357613306763 |
| 49 | 4.61 | 4.65955182126951 | -0.0495518212695073 |
| 50 | 4.65 | 4.79130033824595 | -0.14130033824595 |
| 51 | 4.69 | 4.64213469428394 | 0.0478653057160645 |
| 52 | 4.82 | 4.87693058223746 | -0.0569305822374566 |
| 53 | 4.86 | 4.99676125572419 | -0.136761255724191 |
| 54 | 4.87 | 4.78586346484769 | 0.084136535152309 |
| 55 | 5.01 | 4.71934924294063 | 0.290650757059368 |
| 56 | 5.03 | 4.65620621005033 | 0.373793789949668 |
| 57 | 5.13 | 5.21979735570807 | -0.08979735570807 |
| 58 | 5.18 | 4.2458022630614 | 0.934197736938605 |
| 59 | 5.21 | 4.71534185944686 | 0.494658140553137 |
| 60 | 5.26 | 5.44367089809941 | -0.183670898099409 |
| 61 | 5.25 | 5.11866474022222 | 0.131335259777784 |
| 62 | 5.2 | 4.81462442814712 | 0.385375571852881 |
| 63 | 5.16 | 5.59678168498073 | -0.436781684980733 |
| 64 | 5.19 | 5.07949040021627 | 0.110509599783726 |
| 65 | 5.39 | 5.46782322321541 | -0.0778232232154109 |
| 66 | 5.58 | 5.45724771666099 | 0.122752283339012 |
| 67 | 5.76 | 5.42236332912057 | 0.337636670879427 |
| 68 | 5.89 | 5.64248303511378 | 0.247516964886225 |
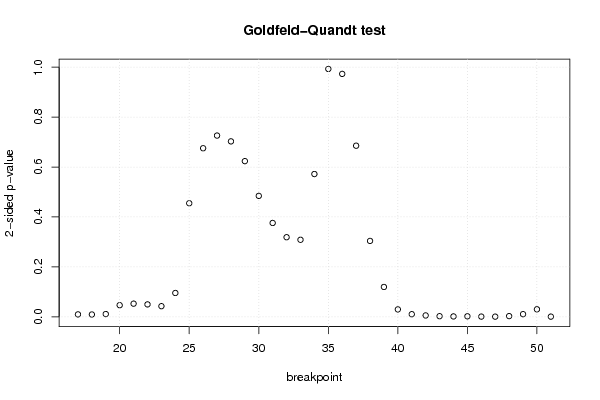
| Goldfeld-Quandt test for Heteroskedasticity | |||
| p-values | Alternative Hypothesis | ||
| breakpoint index | greater | 2-sided | less |
| 17 | 0.0049498619896452 | 0.0098997239792904 | 0.995050138010355 |
| 18 | 0.00474347245390603 | 0.00948694490781207 | 0.995256527546094 |
| 19 | 0.00562387012072593 | 0.0112477402414519 | 0.994376129879274 |
| 20 | 0.023358016902939 | 0.0467160338058779 | 0.976641983097061 |
| 21 | 0.0264031974662394 | 0.0528063949324788 | 0.97359680253376 |
| 22 | 0.0249823506359529 | 0.0499647012719059 | 0.975017649364047 |
| 23 | 0.0213872183311172 | 0.0427744366622345 | 0.978612781668883 |
| 24 | 0.0478205596936364 | 0.0956411193872728 | 0.952179440306364 |
| 25 | 0.227518496690497 | 0.455036993380994 | 0.772481503309503 |
| 26 | 0.337651515702389 | 0.675303031404778 | 0.662348484297611 |
| 27 | 0.36305415408795 | 0.7261083081759 | 0.63694584591205 |
| 28 | 0.351427840440132 | 0.702855680880264 | 0.648572159559868 |
| 29 | 0.311847378074547 | 0.623694756149093 | 0.688152621925453 |
| 30 | 0.242256040505927 | 0.484512081011855 | 0.757743959494073 |
| 31 | 0.188030441214971 | 0.376060882429943 | 0.811969558785029 |
| 32 | 0.159425551794229 | 0.318851103588458 | 0.840574448205771 |
| 33 | 0.15436553616904 | 0.308731072338079 | 0.84563446383096 |
| 34 | 0.286009529816131 | 0.572019059632263 | 0.713990470183869 |
| 35 | 0.496439109953954 | 0.992878219907907 | 0.503560890046046 |
| 36 | 0.513461925902579 | 0.973076148194843 | 0.486538074097421 |
| 37 | 0.65729988714322 | 0.68540022571356 | 0.34270011285678 |
| 38 | 0.847962919368848 | 0.304074161262303 | 0.152037080631152 |
| 39 | 0.940142003328116 | 0.119715993343768 | 0.059857996671884 |
| 40 | 0.98505693105518 | 0.0298861378896417 | 0.0149430689448209 |
| 41 | 0.994668437595115 | 0.0106631248097702 | 0.00533156240488508 |
| 42 | 0.997176037672756 | 0.00564792465448768 | 0.00282396232724384 |
| 43 | 0.998675317719025 | 0.00264936456194921 | 0.00132468228097461 |
| 44 | 0.999159815984855 | 0.00168036803029014 | 0.00084018401514507 |
| 45 | 0.998873701692417 | 0.00225259661516585 | 0.00112629830758292 |
| 46 | 0.999482674540882 | 0.00103465091823533 | 0.000517325459117667 |
| 47 | 0.999587365220202 | 0.000825269559595074 | 0.000412634779797537 |
| 48 | 0.998488826443025 | 0.00302234711395044 | 0.00151117355697522 |
| 49 | 0.99460460384028 | 0.0107907923194408 | 0.00539539615972039 |
| 50 | 0.984863526190635 | 0.03027294761873 | 0.015136473809365 |
| 51 | 0.999541996054065 | 0.00091600789187076 | 0.00045800394593538 |
| Meta Analysis of Goldfeld-Quandt test for Heteroskedasticity | |||
| Description | # significant tests | % significant tests | OK/NOK |
| 1% type I error level | 10 | 0.285714285714286 | NOK |
| 5% type I error level | 18 | 0.514285714285714 | NOK |
| 10% type I error level | 20 | 0.571428571428571 | NOK |