Free Statistics

of Irreproducible Research!

Author's title

Author*The author of this computation has been verified*
R Software Modulerwasp_pairs.wasp
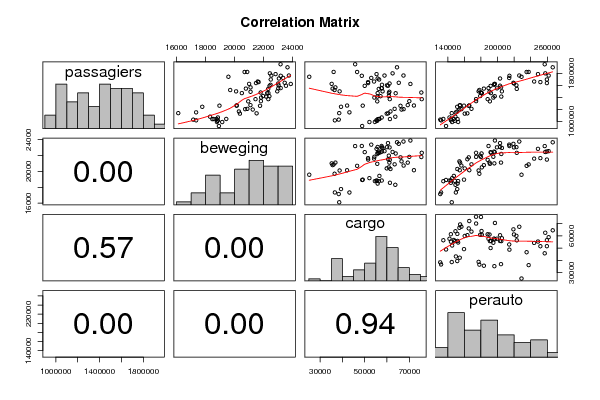
Title produced by softwareKendall tau Correlation Matrix
Date of computationMon, 27 Dec 2010 13:41:06 +0000
Cite this page as followsStatistical Computations at FreeStatistics.org, Office for Research Development and Education, URL https://freestatistics.org/blog/index.php?v=date/2010/Dec/27/t1293457181tre5ioo4vcbrw6p.htm/, Retrieved Mon, 06 May 2024 11:54:17 +0000
Statistical Computations at FreeStatistics.org, Office for Research Development and Education, URL https://freestatistics.org/blog/index.php?pk=115981, Retrieved Mon, 06 May 2024 11:54:17 +0000
QR Codes:

Original text written by user:
IsPrivate?No (this computation is public)
User-defined keywords
Estimated Impact108
Family? (F = Feedback message, R = changed R code, M = changed R Module, P = changed Parameters, D = changed Data)
-     [Multiple Regression] [Regressie Prof ba...] [2008-12-10 13:54:00] [bc937651ef42bf891200cf0e0edc7238]
-   P   [Multiple Regression] [Regressie prof ba...] [2008-12-14 15:03:49] [bc937651ef42bf891200cf0e0edc7238]
-    D    [Multiple Regression] [Prof bach regress...] [2008-12-18 13:48:26] [bc937651ef42bf891200cf0e0edc7238]
- RMPD        [Kendall tau Correlation Matrix] [Kendall tau Corre...] [2010-12-27 13:41:06] [76f6fcd790878de142f355e7238b5c71] [Current]
Feedback Forum

Post a new message
Dataseries X:
921365	18919	48873	137852
987921	19147	52118	145224
1132614	21518	60530	163575
1332224	20941	55644	190761
1418133	22401	57121	196562
1411549	22181	55697	204493
1695920	22494	56483	259479
1636173	21479	51541	259479
1539653	22322	56328	223164
1395314	21829	54349	194886
1127575	20370	59885	160407
1036076	18467	55806	151747
989236	18780	54559	152448
1008380	18815	55590	148388
1207763	20881	63442	168510
1368839	21443	61258	188041
1469798	22333	55829	192020
1498721	22944	58023	205250
1761769	22536	58887	261642
1653214	21658	51510	251614
1599104	23035	60006	222726
1421179	21969	60831	179039
1163995	20297	61559	151462
1037735	18564	61325	143653
1015407	18844	55222	143762
1039210	18762	56370	134580
1258049	21757	66063	165273
1469445	20501	60864	181016
1552346	23181	57596	189079
1549144	23015	57650	199266
1785895	22828	55324	248742
1662335	21597	54203	244139
1629440	23005	61155	219777
1467430	22243	63908	180679
1202209	20729	67466	156369
1076982	18310	63739	149176
1039367	19427	56602	147247
1063449	18849	57640	142026
1335135	21817	70025	174119
1491602	21101	61068	190271
1591972	23546	60467	202998
1641248	23456	65297	219097
1898849	23649	64505	266542
1798580	22432	62517	257522
1762444	23745	67403	226187
1622044	23874	70508	196827
1368955	22327	75601	174065
1262973	20143	72094	165891
1195650	21252	66527	153950
1269530	21094	69324	154796
1479279	21800	75423	179944
1607819	22480	57761	195820
1712466	23055	55801	203015
1721766	23352	52949	214055
1949843	23171	45719	256871
1821326	20691	46610	235046
1757802	23183	48713	214295
1590367	22412	50018	191605
1260647	18958	49123	159512
1149235	17347	43157	149715
1016367	17353	36613	131871
1027885	17153	38355	130864
1262159	20141	42107	154383
1520854	19699	36495	178030
1544144	20780	35589	183488
1564709	21101	36864	204119
1821776	20871	36068	237511
1741365	19574	25131	228871
1623386	21002	35198	196125
1498658	20105	38749	177142
1241822	17772	39385	151338
1136029	16117	38579	144732


Summary of computational transaction
Raw Inputview raw input (R code)
Raw Outputview raw output of R engine
Computing time1 seconds
R Server'RServer@AstonUniversity' @ vre.aston.ac.uk

\begin{tabular}{lllllllll}
\hline
Summary of computational transaction \tabularnewline
Raw Input & view raw input (R code)  \tabularnewline
Raw Output & view raw output of R engine  \tabularnewline
Computing time & 1 seconds \tabularnewline
R Server & 'RServer@AstonUniversity' @ vre.aston.ac.uk \tabularnewline
\hline
\end{tabular}
%Source: https://freestatistics.org/blog/index.php?pk=115981&T=0

[TABLE]
[ROW][C]Summary of computational transaction[/C][/ROW]
[ROW][C]Raw Input[/C][C]view raw input (R code) [/C][/ROW]
[ROW][C]Raw Output[/C][C]view raw output of R engine [/C][/ROW]
[ROW][C]Computing time[/C][C]1 seconds[/C][/ROW]
[ROW][C]R Server[/C][C]'RServer@AstonUniversity' @ vre.aston.ac.uk[/C][/ROW]
[/TABLE]
Source: https://freestatistics.org/blog/index.php?pk=115981&T=0

Globally Unique Identifier (entire table): ba.freestatistics.org/blog/index.php?pk=115981&T=0

As an alternative you can also use a QR Code:  

The GUIDs for individual cells are displayed in the table below:

Summary of computational transaction
Raw Inputview raw input (R code)
Raw Outputview raw output of R engine
Computing time1 seconds
R Server'RServer@AstonUniversity' @ vre.aston.ac.uk


Correlations for all pairs of data series (method=pearson)
passagiersbewegingcargoperauto
passagiers10.757-0.0680.92
beweging0.75710.4320.714
cargo-0.0680.4321-0.008
perauto0.920.714-0.0081

\begin{tabular}{lllllllll}
\hline
Correlations for all pairs of data series (method=pearson) \tabularnewline
  & passagiers & beweging & cargo & perauto \tabularnewline
passagiers & 1 & 0.757 & -0.068 & 0.92 \tabularnewline
beweging & 0.757 & 1 & 0.432 & 0.714 \tabularnewline
cargo & -0.068 & 0.432 & 1 & -0.008 \tabularnewline
perauto & 0.92 & 0.714 & -0.008 & 1 \tabularnewline
\hline
\end{tabular}
%Source: https://freestatistics.org/blog/index.php?pk=115981&T=1

[TABLE]
[ROW][C]Correlations for all pairs of data series (method=pearson)[/C][/ROW]
[ROW][C] [/C][C]passagiers[/C][C]beweging[/C][C]cargo[/C][C]perauto[/C][/ROW]
[ROW][C]passagiers[/C][C]1[/C][C]0.757[/C][C]-0.068[/C][C]0.92[/C][/ROW]
[ROW][C]beweging[/C][C]0.757[/C][C]1[/C][C]0.432[/C][C]0.714[/C][/ROW]
[ROW][C]cargo[/C][C]-0.068[/C][C]0.432[/C][C]1[/C][C]-0.008[/C][/ROW]
[ROW][C]perauto[/C][C]0.92[/C][C]0.714[/C][C]-0.008[/C][C]1[/C][/ROW]
[/TABLE]
Source: https://freestatistics.org/blog/index.php?pk=115981&T=1

Globally Unique Identifier (entire table): ba.freestatistics.org/blog/index.php?pk=115981&T=1

As an alternative you can also use a QR Code:  

The GUIDs for individual cells are displayed in the table below:

Correlations for all pairs of data series (method=pearson)
passagiersbewegingcargoperauto
passagiers10.757-0.0680.92
beweging0.75710.4320.714
cargo-0.0680.4321-0.008
perauto0.920.714-0.0081


Correlations for all pairs of data series with p-values
pairPearson rSpearman rhoKendall tau
passagiers;beweging0.75690.74620.5561
p-value(0)(0)(0)
passagiers;cargo-0.0681-0.058-0.0243
p-value(0.5698)(0.6278)(0.7631)
passagiers;perauto0.92030.9390.7799
p-value(0)(0)(0)
beweging;cargo0.43250.36690.2399
p-value(1e-04)(0.0015)(0.0029)
beweging;perauto0.7140.76820.58
p-value(0)(0)(0)
cargo;perauto-0.0084-0.0065-0.0082
p-value(0.9441)(0.9566)(0.9187)

\begin{tabular}{lllllllll}
\hline
Correlations for all pairs of data series with p-values \tabularnewline
pair & Pearson r & Spearman rho & Kendall tau \tabularnewline
passagiers;beweging & 0.7569 & 0.7462 & 0.5561 \tabularnewline
p-value & (0) & (0) & (0) \tabularnewline
passagiers;cargo & -0.0681 & -0.058 & -0.0243 \tabularnewline
p-value & (0.5698) & (0.6278) & (0.7631) \tabularnewline
passagiers;perauto & 0.9203 & 0.939 & 0.7799 \tabularnewline
p-value & (0) & (0) & (0) \tabularnewline
beweging;cargo & 0.4325 & 0.3669 & 0.2399 \tabularnewline
p-value & (1e-04) & (0.0015) & (0.0029) \tabularnewline
beweging;perauto & 0.714 & 0.7682 & 0.58 \tabularnewline
p-value & (0) & (0) & (0) \tabularnewline
cargo;perauto & -0.0084 & -0.0065 & -0.0082 \tabularnewline
p-value & (0.9441) & (0.9566) & (0.9187) \tabularnewline
\hline
\end{tabular}
%Source: https://freestatistics.org/blog/index.php?pk=115981&T=2

[TABLE]
[ROW][C]Correlations for all pairs of data series with p-values[/C][/ROW]
[ROW][C]pair[/C][C]Pearson r[/C][C]Spearman rho[/C][C]Kendall tau[/C][/ROW]
[ROW][C]passagiers;beweging[/C][C]0.7569[/C][C]0.7462[/C][C]0.5561[/C][/ROW]
[ROW][C]p-value[/C][C](0)[/C][C](0)[/C][C](0)[/C][/ROW]
[ROW][C]passagiers;cargo[/C][C]-0.0681[/C][C]-0.058[/C][C]-0.0243[/C][/ROW]
[ROW][C]p-value[/C][C](0.5698)[/C][C](0.6278)[/C][C](0.7631)[/C][/ROW]
[ROW][C]passagiers;perauto[/C][C]0.9203[/C][C]0.939[/C][C]0.7799[/C][/ROW]
[ROW][C]p-value[/C][C](0)[/C][C](0)[/C][C](0)[/C][/ROW]
[ROW][C]beweging;cargo[/C][C]0.4325[/C][C]0.3669[/C][C]0.2399[/C][/ROW]
[ROW][C]p-value[/C][C](1e-04)[/C][C](0.0015)[/C][C](0.0029)[/C][/ROW]
[ROW][C]beweging;perauto[/C][C]0.714[/C][C]0.7682[/C][C]0.58[/C][/ROW]
[ROW][C]p-value[/C][C](0)[/C][C](0)[/C][C](0)[/C][/ROW]
[ROW][C]cargo;perauto[/C][C]-0.0084[/C][C]-0.0065[/C][C]-0.0082[/C][/ROW]
[ROW][C]p-value[/C][C](0.9441)[/C][C](0.9566)[/C][C](0.9187)[/C][/ROW]
[/TABLE]
Source: https://freestatistics.org/blog/index.php?pk=115981&T=2

Globally Unique Identifier (entire table): ba.freestatistics.org/blog/index.php?pk=115981&T=2

As an alternative you can also use a QR Code:  

The GUIDs for individual cells are displayed in the table below:

Correlations for all pairs of data series with p-values
pairPearson rSpearman rhoKendall tau
passagiers;beweging0.75690.74620.5561
p-value(0)(0)(0)
passagiers;cargo-0.0681-0.058-0.0243
p-value(0.5698)(0.6278)(0.7631)
passagiers;perauto0.92030.9390.7799
p-value(0)(0)(0)
beweging;cargo0.43250.36690.2399
p-value(1e-04)(0.0015)(0.0029)
beweging;perauto0.7140.76820.58
p-value(0)(0)(0)
cargo;perauto-0.0084-0.0065-0.0082
p-value(0.9441)(0.9566)(0.9187)


Parameters (Session):
par1 = pearson ;
Parameters (R input):
par1 = pearson ;
R code (references can be found in the software module):
panel.tau <- function(x, y, digits=2, prefix='', cex.cor)
{
usr <- par('usr'); on.exit(par(usr))
par(usr = c(0, 1, 0, 1))
rr <- cor.test(x, y, method=par1)
r <- round(rr$p.value,2)
txt <- format(c(r, 0.123456789), digits=digits)[1]
txt <- paste(prefix, txt, sep='')
if(missing(cex.cor)) cex <- 0.5/strwidth(txt)
text(0.5, 0.5, txt, cex = cex)
}
panel.hist <- function(x, ...)
{
usr <- par('usr'); on.exit(par(usr))
par(usr = c(usr[1:2], 0, 1.5) )
h <- hist(x, plot = FALSE)
breaks <- h$breaks; nB <- length(breaks)
y <- h$counts; y <- y/max(y)
rect(breaks[-nB], 0, breaks[-1], y, col='grey', ...)
}
bitmap(file='test1.png')
pairs(t(y),diag.panel=panel.hist, upper.panel=panel.smooth, lower.panel=panel.tau, main=main)
dev.off()
load(file='createtable')
n <- length(y[,1])
n
a<-table.start()
a<-table.row.start(a)
a<-table.element(a,paste('Correlations for all pairs of data series (method=',par1,')',sep=''),n+1,TRUE)
a<-table.row.end(a)
a<-table.row.start(a)
a<-table.element(a,' ',header=TRUE)
for (i in 1:n) {
a<-table.element(a,dimnames(t(x))[[2]][i],header=TRUE)
}
a<-table.row.end(a)
for (i in 1:n) {
a<-table.row.start(a)
a<-table.element(a,dimnames(t(x))[[2]][i],header=TRUE)
for (j in 1:n) {
r <- cor.test(y[i,],y[j,],method=par1)
a<-table.element(a,round(r$estimate,3))
}
a<-table.row.end(a)
}
a<-table.end(a)
table.save(a,file='mytable.tab')
a<-table.start()
a<-table.row.start(a)
a<-table.element(a,'Correlations for all pairs of data series with p-values',4,TRUE)
a<-table.row.end(a)
a<-table.row.start(a)
a<-table.element(a,'pair',1,TRUE)
a<-table.element(a,'Pearson r',1,TRUE)
a<-table.element(a,'Spearman rho',1,TRUE)
a<-table.element(a,'Kendall tau',1,TRUE)
a<-table.row.end(a)
cor.test(y[1,],y[2,],method=par1)
for (i in 1:(n-1))
{
for (j in (i+1):n)
{
a<-table.row.start(a)
dum <- paste(dimnames(t(x))[[2]][i],';',dimnames(t(x))[[2]][j],sep='')
a<-table.element(a,dum,header=TRUE)
rp <- cor.test(y[i,],y[j,],method='pearson')
a<-table.element(a,round(rp$estimate,4))
rs <- cor.test(y[i,],y[j,],method='spearman')
a<-table.element(a,round(rs$estimate,4))
rk <- cor.test(y[i,],y[j,],method='kendall')
a<-table.element(a,round(rk$estimate,4))
a<-table.row.end(a)
a<-table.row.start(a)
a<-table.element(a,'p-value',header=T)
a<-table.element(a,paste('(',round(rp$p.value,4),')',sep=''))
a<-table.element(a,paste('(',round(rs$p.value,4),')',sep=''))
a<-table.element(a,paste('(',round(rk$p.value,4),')',sep=''))
a<-table.row.end(a)
}
}
a<-table.end(a)
table.save(a,file='mytable1.tab')