| Tabulation of Results | ||
| ParentalCriticism x Organization | ||
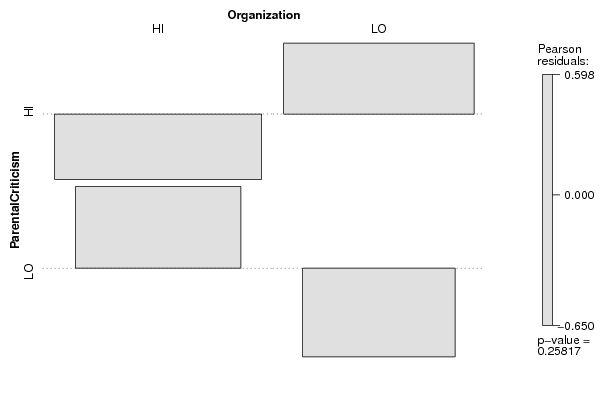
| HI | LO | HI | 49 | 48 | LO | 37 | 25 |
| Tabulation of Expected Results | ||
| ParentalCriticism x Organization | ||
| HI | LO | HI | 52.47 | 44.53 | LO | 33.53 | 28.47 |
| Statistical Results | |
| Pearson's Chi-squared test with Yates' continuity correction | |
| Pearson Chi Square Statistic | 0.94 |
| Degrees of Freedom | 1 |
| P value | 0.33 |