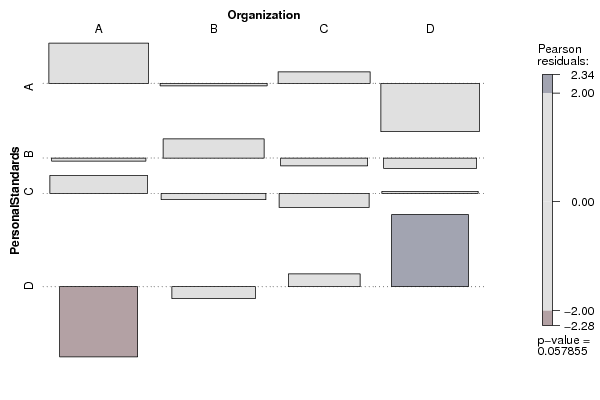
| Tabulation of Results | ||||
| PersonalStandards x Organization | ||||
| A | B | C | D | A | 16 | 13 | 11 | 6 | B | 10 | 14 | 8 | 9 | C | 13 | 12 | 8 | 11 | D | 1 | 7 | 7 | 13 |
| Tabulation of Expected Results | ||||
| PersonalStandards x Organization | ||||
| A | B | C | D | A | 11.57 | 13.31 | 9.84 | 11.28 | B | 10.31 | 11.86 | 8.77 | 10.06 | C | 11.07 | 12.73 | 9.41 | 10.79 | D | 7.04 | 8.1 | 5.99 | 6.87 |
| Statistical Results | |
| Pearson's Chi-squared test | |
| Pearson Chi Square Statistic | 16.46 |
| Degrees of Freedom | 9 |
| P value | 0.06 |