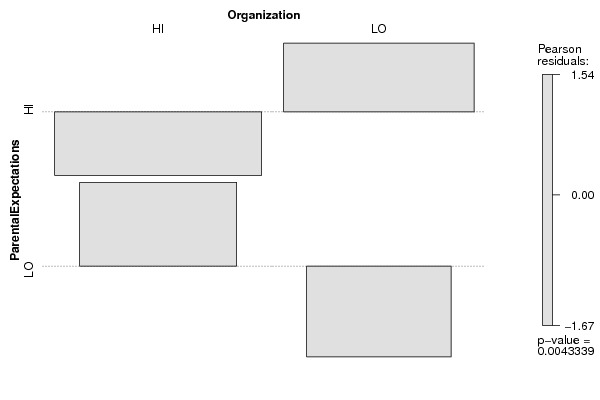
| Tabulation of Results | ||
| ParentalExpectations x Organization | ||
| HI | LO | HI | 46 | 55 | LO | 40 | 18 |
| Tabulation of Expected Results | ||
| ParentalExpectations x Organization | ||
| HI | LO | HI | 54.63 | 46.37 | LO | 31.37 | 26.63 |
| Statistical Results | |
| Pearson's Chi-squared test with Yates' continuity correction | |
| Pearson Chi Square Statistic | 7.22 |
| Degrees of Freedom | 1 |
| P value | 0.01 |