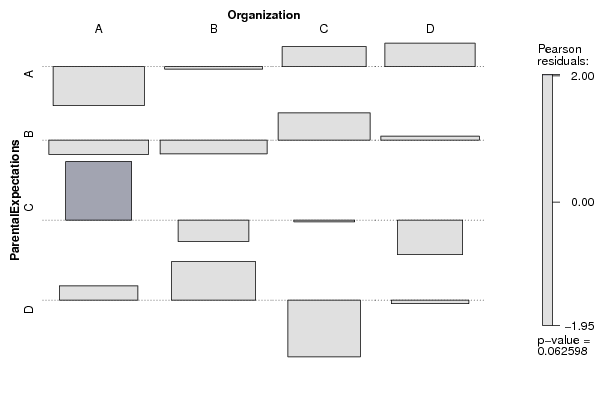
| Tabulation of Results | ||||
| ParentalExpectations x Organization | ||||
| A | B | C | D | A | 7 | 13 | 12 | 14 | B | 12 | 14 | 15 | 14 | C | 11 | 5 | 5 | 3 | D | 10 | 14 | 2 | 8 |
| Tabulation of Expected Results | ||||
| ParentalExpectations x Organization | ||||
| A | B | C | D | A | 11.57 | 13.31 | 9.84 | 11.28 | B | 13.84 | 15.91 | 11.76 | 13.49 | C | 6.04 | 6.94 | 5.13 | 5.89 | D | 8.55 | 9.84 | 7.27 | 8.34 |
| Statistical Results | |
| Pearson's Chi-squared test | |
| Pearson Chi Square Statistic | 16.21 |
| Degrees of Freedom | 9 |
| P value | 0.06 |