Free Statistics

of Irreproducible Research!

Author's title

Author*The author of this computation has been verified*
R Software Modulerwasp_arimaforecasting.wasp
Title produced by softwareARIMA Forecasting
Date of computationSun, 26 Dec 2010 19:15:44 +0000
Cite this page as followsStatistical Computations at FreeStatistics.org, Office for Research Development and Education, URL https://freestatistics.org/blog/index.php?v=date/2010/Dec/26/t12933908222b5k9kn19bcswve.htm/, Retrieved Mon, 06 May 2024 21:11:05 +0000
Statistical Computations at FreeStatistics.org, Office for Research Development and Education, URL https://freestatistics.org/blog/index.php?pk=115784, Retrieved Mon, 06 May 2024 21:11:05 +0000
QR Codes:

Original text written by user:
IsPrivate?No (this computation is public)
User-defined keywords
Estimated Impact109
Family? (F = Feedback message, R = changed R code, M = changed R Module, P = changed Parameters, D = changed Data)
-     [Classical Decomposition] [HPC Retail Sales] [2008-03-02 16:19:32] [74be16979710d4c4e7c6647856088456]
- RMPD  [ARIMA Forecasting] [WS6 - ARIMA forecast] [2010-12-14 20:24:30] [8ed0bd3560b9ca2814a2ed0a29182575]
-   PD      [ARIMA Forecasting] [Forecast Yuan] [2010-12-26 19:15:44] [c9d5faca36bd2ada281161976df30bf1] [Current]
Feedback Forum

Post a new message
Dataseries X:
7,4271
7,7662
7,6289
7,5281
7,3831
7,2355
7,0617
7,1237
7,4533
7,5411
7,4978
7,3525
7,3862
7,311
7,2013
7,249
7,3321
7,59
7,9082
8,2123
8,0929
8,118
8,1206
8,2883
8,4281
8,7917
8,9168
8,9446
8,9786
9,5862
9,6533
9,4125
9,2195
9,2882
9,6774
9,6857
10,1688
10,4399
10,4675
10,149
9,9163
9,9268
10,0529
10,1622
10,083
10,1134
10,3423
10,7536
11,0967
10,8588
10,7719
10,9262
10,708
10,5062
10,0683
9,8954
9,9589
9,9177
9,7189
9,5273
9,5746
9,763
9,6117
9,6581
9,8361
10,2353
10,1285
10,1347
10,2141
10,0971
9,9651
10,1286
10,3356
10,1238
10,1326
10,2467
10,44
10,3689
10,2415
10,3899
10,3162
10,4533
10,6741
10,8957
10,7404
10,6568
10,5682
10,9833
11,0237
10,8462
10,7287
10,7809
10,2609
9,8252
9,1071
8,695
9,2205
9,0496
8,7406
8,921
9,011
9,3157
9,5786
9,6246
9,7485
9,9431
10,1152
10,1827
9,9777
9,7436
9,3462
9,2623
9,1505
8,5794
8,3245
8,6538
8,752
8,8104
9,2665
9,0895


Summary of computational transaction
Raw Inputview raw input (R code)
Raw Outputview raw output of R engine
Computing time9 seconds
R Server'Sir Ronald Aylmer Fisher' @ 193.190.124.24

\begin{tabular}{lllllllll}
\hline
Summary of computational transaction \tabularnewline
Raw Input & view raw input (R code)  \tabularnewline
Raw Output & view raw output of R engine  \tabularnewline
Computing time & 9 seconds \tabularnewline
R Server & 'Sir Ronald Aylmer Fisher' @ 193.190.124.24 \tabularnewline
\hline
\end{tabular}
%Source: https://freestatistics.org/blog/index.php?pk=115784&T=0

[TABLE]
[ROW][C]Summary of computational transaction[/C][/ROW]
[ROW][C]Raw Input[/C][C]view raw input (R code) [/C][/ROW]
[ROW][C]Raw Output[/C][C]view raw output of R engine [/C][/ROW]
[ROW][C]Computing time[/C][C]9 seconds[/C][/ROW]
[ROW][C]R Server[/C][C]'Sir Ronald Aylmer Fisher' @ 193.190.124.24[/C][/ROW]
[/TABLE]
Source: https://freestatistics.org/blog/index.php?pk=115784&T=0

Globally Unique Identifier (entire table): ba.freestatistics.org/blog/index.php?pk=115784&T=0

As an alternative you can also use a QR Code:  

The GUIDs for individual cells are displayed in the table below:

Summary of computational transaction
Raw Inputview raw input (R code)
Raw Outputview raw output of R engine
Computing time9 seconds
R Server'Sir Ronald Aylmer Fisher' @ 193.190.124.24


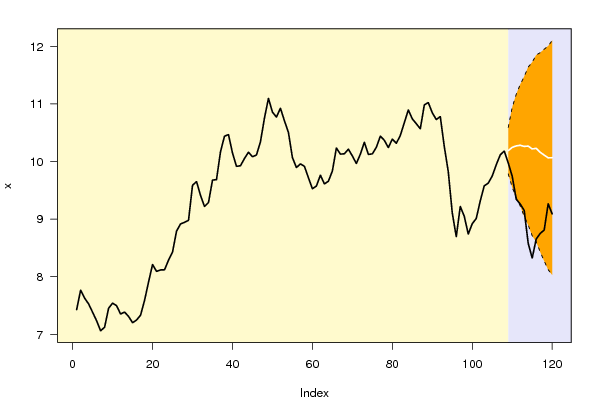
Univariate ARIMA Extrapolation Forecast
timeY[t]F[t]95% LB95% UBp-value(H0: Y[t] = F[t])P(F[t]>Y[t-1])P(F[t]>Y[t-s])P(F[t]>Y[108])
968.695-------
979.2205-------
989.0496-------
998.7406-------
1008.921-------
1019.011-------
1029.3157-------
1039.5786-------
1049.6246-------
1059.7485-------
1069.9431-------
10710.1152-------
10810.1827-------
1099.977710.18829.785210.59130.1530.510710.5107
1109.743610.24629.551110.94130.07820.77550.99960.5711
1119.346210.27129.375311.1670.02150.87580.99960.5767
1129.262310.28239.227911.33660.0290.95910.99430.5734
1139.150510.26259.048511.47650.03630.94680.97830.5513
1148.579410.26858.896711.64030.00790.94490.91330.5488
1158.324510.21798.711211.72470.00690.98350.79720.5183
1168.653810.22928.608711.84980.02840.98940.76770.5224
1178.75210.16028.430911.88960.05520.95610.67960.4898
1188.810410.11158.272711.95020.08270.92630.57120.4697
1199.266510.06418.12212.00620.21040.89710.47940.4523
1209.089510.06718.031512.10260.17330.77960.45570.4557

\begin{tabular}{lllllllll}
\hline
Univariate ARIMA Extrapolation Forecast \tabularnewline
time & Y[t] & F[t] & 95% LB & 95% UB & p-value(H0: Y[t] = F[t]) & P(F[t]>Y[t-1]) & P(F[t]>Y[t-s]) & P(F[t]>Y[108]) \tabularnewline
96 & 8.695 & - & - & - & - & - & - & - \tabularnewline
97 & 9.2205 & - & - & - & - & - & - & - \tabularnewline
98 & 9.0496 & - & - & - & - & - & - & - \tabularnewline
99 & 8.7406 & - & - & - & - & - & - & - \tabularnewline
100 & 8.921 & - & - & - & - & - & - & - \tabularnewline
101 & 9.011 & - & - & - & - & - & - & - \tabularnewline
102 & 9.3157 & - & - & - & - & - & - & - \tabularnewline
103 & 9.5786 & - & - & - & - & - & - & - \tabularnewline
104 & 9.6246 & - & - & - & - & - & - & - \tabularnewline
105 & 9.7485 & - & - & - & - & - & - & - \tabularnewline
106 & 9.9431 & - & - & - & - & - & - & - \tabularnewline
107 & 10.1152 & - & - & - & - & - & - & - \tabularnewline
108 & 10.1827 & - & - & - & - & - & - & - \tabularnewline
109 & 9.9777 & 10.1882 & 9.7852 & 10.5913 & 0.153 & 0.5107 & 1 & 0.5107 \tabularnewline
110 & 9.7436 & 10.2462 & 9.5511 & 10.9413 & 0.0782 & 0.7755 & 0.9996 & 0.5711 \tabularnewline
111 & 9.3462 & 10.2712 & 9.3753 & 11.167 & 0.0215 & 0.8758 & 0.9996 & 0.5767 \tabularnewline
112 & 9.2623 & 10.2823 & 9.2279 & 11.3366 & 0.029 & 0.9591 & 0.9943 & 0.5734 \tabularnewline
113 & 9.1505 & 10.2625 & 9.0485 & 11.4765 & 0.0363 & 0.9468 & 0.9783 & 0.5513 \tabularnewline
114 & 8.5794 & 10.2685 & 8.8967 & 11.6403 & 0.0079 & 0.9449 & 0.9133 & 0.5488 \tabularnewline
115 & 8.3245 & 10.2179 & 8.7112 & 11.7247 & 0.0069 & 0.9835 & 0.7972 & 0.5183 \tabularnewline
116 & 8.6538 & 10.2292 & 8.6087 & 11.8498 & 0.0284 & 0.9894 & 0.7677 & 0.5224 \tabularnewline
117 & 8.752 & 10.1602 & 8.4309 & 11.8896 & 0.0552 & 0.9561 & 0.6796 & 0.4898 \tabularnewline
118 & 8.8104 & 10.1115 & 8.2727 & 11.9502 & 0.0827 & 0.9263 & 0.5712 & 0.4697 \tabularnewline
119 & 9.2665 & 10.0641 & 8.122 & 12.0062 & 0.2104 & 0.8971 & 0.4794 & 0.4523 \tabularnewline
120 & 9.0895 & 10.0671 & 8.0315 & 12.1026 & 0.1733 & 0.7796 & 0.4557 & 0.4557 \tabularnewline
\hline
\end{tabular}
%Source: https://freestatistics.org/blog/index.php?pk=115784&T=1

[TABLE]
[ROW][C]Univariate ARIMA Extrapolation Forecast[/C][/ROW]
[ROW][C]time[/C][C]Y[t][/C][C]F[t][/C][C]95% LB[/C][C]95% UB[/C][C]p-value(H0: Y[t] = F[t])[/C][C]P(F[t]>Y[t-1])[/C][C]P(F[t]>Y[t-s])[/C][C]P(F[t]>Y[108])[/C][/ROW]
[ROW][C]96[/C][C]8.695[/C][C]-[/C][C]-[/C][C]-[/C][C]-[/C][C]-[/C][C]-[/C][C]-[/C][/ROW]
[ROW][C]97[/C][C]9.2205[/C][C]-[/C][C]-[/C][C]-[/C][C]-[/C][C]-[/C][C]-[/C][C]-[/C][/ROW]
[ROW][C]98[/C][C]9.0496[/C][C]-[/C][C]-[/C][C]-[/C][C]-[/C][C]-[/C][C]-[/C][C]-[/C][/ROW]
[ROW][C]99[/C][C]8.7406[/C][C]-[/C][C]-[/C][C]-[/C][C]-[/C][C]-[/C][C]-[/C][C]-[/C][/ROW]
[ROW][C]100[/C][C]8.921[/C][C]-[/C][C]-[/C][C]-[/C][C]-[/C][C]-[/C][C]-[/C][C]-[/C][/ROW]
[ROW][C]101[/C][C]9.011[/C][C]-[/C][C]-[/C][C]-[/C][C]-[/C][C]-[/C][C]-[/C][C]-[/C][/ROW]
[ROW][C]102[/C][C]9.3157[/C][C]-[/C][C]-[/C][C]-[/C][C]-[/C][C]-[/C][C]-[/C][C]-[/C][/ROW]
[ROW][C]103[/C][C]9.5786[/C][C]-[/C][C]-[/C][C]-[/C][C]-[/C][C]-[/C][C]-[/C][C]-[/C][/ROW]
[ROW][C]104[/C][C]9.6246[/C][C]-[/C][C]-[/C][C]-[/C][C]-[/C][C]-[/C][C]-[/C][C]-[/C][/ROW]
[ROW][C]105[/C][C]9.7485[/C][C]-[/C][C]-[/C][C]-[/C][C]-[/C][C]-[/C][C]-[/C][C]-[/C][/ROW]
[ROW][C]106[/C][C]9.9431[/C][C]-[/C][C]-[/C][C]-[/C][C]-[/C][C]-[/C][C]-[/C][C]-[/C][/ROW]
[ROW][C]107[/C][C]10.1152[/C][C]-[/C][C]-[/C][C]-[/C][C]-[/C][C]-[/C][C]-[/C][C]-[/C][/ROW]
[ROW][C]108[/C][C]10.1827[/C][C]-[/C][C]-[/C][C]-[/C][C]-[/C][C]-[/C][C]-[/C][C]-[/C][/ROW]
[ROW][C]109[/C][C]9.9777[/C][C]10.1882[/C][C]9.7852[/C][C]10.5913[/C][C]0.153[/C][C]0.5107[/C][C]1[/C][C]0.5107[/C][/ROW]
[ROW][C]110[/C][C]9.7436[/C][C]10.2462[/C][C]9.5511[/C][C]10.9413[/C][C]0.0782[/C][C]0.7755[/C][C]0.9996[/C][C]0.5711[/C][/ROW]
[ROW][C]111[/C][C]9.3462[/C][C]10.2712[/C][C]9.3753[/C][C]11.167[/C][C]0.0215[/C][C]0.8758[/C][C]0.9996[/C][C]0.5767[/C][/ROW]
[ROW][C]112[/C][C]9.2623[/C][C]10.2823[/C][C]9.2279[/C][C]11.3366[/C][C]0.029[/C][C]0.9591[/C][C]0.9943[/C][C]0.5734[/C][/ROW]
[ROW][C]113[/C][C]9.1505[/C][C]10.2625[/C][C]9.0485[/C][C]11.4765[/C][C]0.0363[/C][C]0.9468[/C][C]0.9783[/C][C]0.5513[/C][/ROW]
[ROW][C]114[/C][C]8.5794[/C][C]10.2685[/C][C]8.8967[/C][C]11.6403[/C][C]0.0079[/C][C]0.9449[/C][C]0.9133[/C][C]0.5488[/C][/ROW]
[ROW][C]115[/C][C]8.3245[/C][C]10.2179[/C][C]8.7112[/C][C]11.7247[/C][C]0.0069[/C][C]0.9835[/C][C]0.7972[/C][C]0.5183[/C][/ROW]
[ROW][C]116[/C][C]8.6538[/C][C]10.2292[/C][C]8.6087[/C][C]11.8498[/C][C]0.0284[/C][C]0.9894[/C][C]0.7677[/C][C]0.5224[/C][/ROW]
[ROW][C]117[/C][C]8.752[/C][C]10.1602[/C][C]8.4309[/C][C]11.8896[/C][C]0.0552[/C][C]0.9561[/C][C]0.6796[/C][C]0.4898[/C][/ROW]
[ROW][C]118[/C][C]8.8104[/C][C]10.1115[/C][C]8.2727[/C][C]11.9502[/C][C]0.0827[/C][C]0.9263[/C][C]0.5712[/C][C]0.4697[/C][/ROW]
[ROW][C]119[/C][C]9.2665[/C][C]10.0641[/C][C]8.122[/C][C]12.0062[/C][C]0.2104[/C][C]0.8971[/C][C]0.4794[/C][C]0.4523[/C][/ROW]
[ROW][C]120[/C][C]9.0895[/C][C]10.0671[/C][C]8.0315[/C][C]12.1026[/C][C]0.1733[/C][C]0.7796[/C][C]0.4557[/C][C]0.4557[/C][/ROW]
[/TABLE]
Source: https://freestatistics.org/blog/index.php?pk=115784&T=1

Globally Unique Identifier (entire table): ba.freestatistics.org/blog/index.php?pk=115784&T=1

As an alternative you can also use a QR Code:  

The GUIDs for individual cells are displayed in the table below:

Univariate ARIMA Extrapolation Forecast
timeY[t]F[t]95% LB95% UBp-value(H0: Y[t] = F[t])P(F[t]>Y[t-1])P(F[t]>Y[t-s])P(F[t]>Y[108])
968.695-------
979.2205-------
989.0496-------
998.7406-------
1008.921-------
1019.011-------
1029.3157-------
1039.5786-------
1049.6246-------
1059.7485-------
1069.9431-------
10710.1152-------
10810.1827-------
1099.977710.18829.785210.59130.1530.510710.5107
1109.743610.24629.551110.94130.07820.77550.99960.5711
1119.346210.27129.375311.1670.02150.87580.99960.5767
1129.262310.28239.227911.33660.0290.95910.99430.5734
1139.150510.26259.048511.47650.03630.94680.97830.5513
1148.579410.26858.896711.64030.00790.94490.91330.5488
1158.324510.21798.711211.72470.00690.98350.79720.5183
1168.653810.22928.608711.84980.02840.98940.76770.5224
1178.75210.16028.430911.88960.05520.95610.67960.4898
1188.810410.11158.272711.95020.08270.92630.57120.4697
1199.266510.06418.12212.00620.21040.89710.47940.4523
1209.089510.06718.031512.10260.17330.77960.45570.4557


Univariate ARIMA Extrapolation Forecast Performance
time% S.E.PEMAPESq.EMSERMSE
1090.0202-0.020700.044300
1100.0346-0.04910.03490.25260.14850.3853
1110.0445-0.09010.05330.85560.38420.6198
1120.0523-0.09920.06471.04030.54820.7404
1130.0604-0.10840.07351.23650.68590.8282
1140.0682-0.16450.08862.8531.04711.0233
1150.0752-0.18530.10243.58511.40961.1873
1160.0808-0.1540.10892.4821.54371.2425
1170.0868-0.13860.11221.98311.59251.262
1180.0928-0.12870.11381.69281.60251.2659
1190.0985-0.07920.11070.63611.51471.2307
1200.1032-0.09710.10960.95561.46811.2117

\begin{tabular}{lllllllll}
\hline
Univariate ARIMA Extrapolation Forecast Performance \tabularnewline
time & % S.E. & PE & MAPE & Sq.E & MSE & RMSE \tabularnewline
109 & 0.0202 & -0.0207 & 0 & 0.0443 & 0 & 0 \tabularnewline
110 & 0.0346 & -0.0491 & 0.0349 & 0.2526 & 0.1485 & 0.3853 \tabularnewline
111 & 0.0445 & -0.0901 & 0.0533 & 0.8556 & 0.3842 & 0.6198 \tabularnewline
112 & 0.0523 & -0.0992 & 0.0647 & 1.0403 & 0.5482 & 0.7404 \tabularnewline
113 & 0.0604 & -0.1084 & 0.0735 & 1.2365 & 0.6859 & 0.8282 \tabularnewline
114 & 0.0682 & -0.1645 & 0.0886 & 2.853 & 1.0471 & 1.0233 \tabularnewline
115 & 0.0752 & -0.1853 & 0.1024 & 3.5851 & 1.4096 & 1.1873 \tabularnewline
116 & 0.0808 & -0.154 & 0.1089 & 2.482 & 1.5437 & 1.2425 \tabularnewline
117 & 0.0868 & -0.1386 & 0.1122 & 1.9831 & 1.5925 & 1.262 \tabularnewline
118 & 0.0928 & -0.1287 & 0.1138 & 1.6928 & 1.6025 & 1.2659 \tabularnewline
119 & 0.0985 & -0.0792 & 0.1107 & 0.6361 & 1.5147 & 1.2307 \tabularnewline
120 & 0.1032 & -0.0971 & 0.1096 & 0.9556 & 1.4681 & 1.2117 \tabularnewline
\hline
\end{tabular}
%Source: https://freestatistics.org/blog/index.php?pk=115784&T=2

[TABLE]
[ROW][C]Univariate ARIMA Extrapolation Forecast Performance[/C][/ROW]
[ROW][C]time[/C][C]% S.E.[/C][C]PE[/C][C]MAPE[/C][C]Sq.E[/C][C]MSE[/C][C]RMSE[/C][/ROW]
[ROW][C]109[/C][C]0.0202[/C][C]-0.0207[/C][C]0[/C][C]0.0443[/C][C]0[/C][C]0[/C][/ROW]
[ROW][C]110[/C][C]0.0346[/C][C]-0.0491[/C][C]0.0349[/C][C]0.2526[/C][C]0.1485[/C][C]0.3853[/C][/ROW]
[ROW][C]111[/C][C]0.0445[/C][C]-0.0901[/C][C]0.0533[/C][C]0.8556[/C][C]0.3842[/C][C]0.6198[/C][/ROW]
[ROW][C]112[/C][C]0.0523[/C][C]-0.0992[/C][C]0.0647[/C][C]1.0403[/C][C]0.5482[/C][C]0.7404[/C][/ROW]
[ROW][C]113[/C][C]0.0604[/C][C]-0.1084[/C][C]0.0735[/C][C]1.2365[/C][C]0.6859[/C][C]0.8282[/C][/ROW]
[ROW][C]114[/C][C]0.0682[/C][C]-0.1645[/C][C]0.0886[/C][C]2.853[/C][C]1.0471[/C][C]1.0233[/C][/ROW]
[ROW][C]115[/C][C]0.0752[/C][C]-0.1853[/C][C]0.1024[/C][C]3.5851[/C][C]1.4096[/C][C]1.1873[/C][/ROW]
[ROW][C]116[/C][C]0.0808[/C][C]-0.154[/C][C]0.1089[/C][C]2.482[/C][C]1.5437[/C][C]1.2425[/C][/ROW]
[ROW][C]117[/C][C]0.0868[/C][C]-0.1386[/C][C]0.1122[/C][C]1.9831[/C][C]1.5925[/C][C]1.262[/C][/ROW]
[ROW][C]118[/C][C]0.0928[/C][C]-0.1287[/C][C]0.1138[/C][C]1.6928[/C][C]1.6025[/C][C]1.2659[/C][/ROW]
[ROW][C]119[/C][C]0.0985[/C][C]-0.0792[/C][C]0.1107[/C][C]0.6361[/C][C]1.5147[/C][C]1.2307[/C][/ROW]
[ROW][C]120[/C][C]0.1032[/C][C]-0.0971[/C][C]0.1096[/C][C]0.9556[/C][C]1.4681[/C][C]1.2117[/C][/ROW]
[/TABLE]
Source: https://freestatistics.org/blog/index.php?pk=115784&T=2

Globally Unique Identifier (entire table): ba.freestatistics.org/blog/index.php?pk=115784&T=2

As an alternative you can also use a QR Code:  

The GUIDs for individual cells are displayed in the table below:

Univariate ARIMA Extrapolation Forecast Performance
time% S.E.PEMAPESq.EMSERMSE
1090.0202-0.020700.044300
1100.0346-0.04910.03490.25260.14850.3853
1110.0445-0.09010.05330.85560.38420.6198
1120.0523-0.09920.06471.04030.54820.7404
1130.0604-0.10840.07351.23650.68590.8282
1140.0682-0.16450.08862.8531.04711.0233
1150.0752-0.18530.10243.58511.40961.1873
1160.0808-0.1540.10892.4821.54371.2425
1170.0868-0.13860.11221.98311.59251.262
1180.0928-0.12870.11381.69281.60251.2659
1190.0985-0.07920.11070.63611.51471.2307
1200.1032-0.09710.10960.95561.46811.2117


Parameters (Session):
par1 = 12 ;
Parameters (R input):
par1 = 12 ; par2 = 1 ; par3 = 1 ; par4 = 0 ; par5 = 12 ; par6 = 3 ; par7 = 2 ; par8 = 2 ; par9 = 1 ; par10 = TRUE ;
R code (references can be found in the software module):
par1 <- as.numeric(par1) #cut off periods
par2 <- as.numeric(par2) #lambda
par3 <- as.numeric(par3) #degree of non-seasonal differencing
par4 <- as.numeric(par4) #degree of seasonal differencing
par5 <- as.numeric(par5) #seasonal period
par6 <- as.numeric(par6) #p
par7 <- as.numeric(par7) #q
par8 <- as.numeric(par8) #P
par9 <- as.numeric(par9) #Q
if (par10 == 'TRUE') par10 <- TRUE
if (par10 == 'FALSE') par10 <- FALSE
if (par2 == 0) x <- log(x)
if (par2 != 0) x <- x^par2
lx <- length(x)
first <- lx - 2*par1
nx <- lx - par1
nx1 <- nx + 1
fx <- lx - nx
if (fx < 1) {
fx <- par5
nx1 <- lx + fx - 1
first <- lx - 2*fx
}
first <- 1
if (fx < 3) fx <- round(lx/10,0)
(arima.out <- arima(x[1:nx], order=c(par6,par3,par7), seasonal=list(order=c(par8,par4,par9), period=par5), include.mean=par10, method='ML'))
(forecast <- predict(arima.out,par1))
(lb <- forecast$pred - 1.96 * forecast$se)
(ub <- forecast$pred + 1.96 * forecast$se)
if (par2 == 0) {
x <- exp(x)
forecast$pred <- exp(forecast$pred)
lb <- exp(lb)
ub <- exp(ub)
}
if (par2 != 0) {
x <- x^(1/par2)
forecast$pred <- forecast$pred^(1/par2)
lb <- lb^(1/par2)
ub <- ub^(1/par2)
}
if (par2 < 0) {
olb <- lb
lb <- ub
ub <- olb
}
(actandfor <- c(x[1:nx], forecast$pred))
(perc.se <- (ub-forecast$pred)/1.96/forecast$pred)
bitmap(file='test1.png')
opar <- par(mar=c(4,4,2,2),las=1)
ylim <- c( min(x[first:nx],lb), max(x[first:nx],ub))
plot(x,ylim=ylim,type='n',xlim=c(first,lx))
usr <- par('usr')
rect(usr[1],usr[3],nx+1,usr[4],border=NA,col='lemonchiffon')
rect(nx1,usr[3],usr[2],usr[4],border=NA,col='lavender')
abline(h= (-3:3)*2 , col ='gray', lty =3)
polygon( c(nx1:lx,lx:nx1), c(lb,rev(ub)), col = 'orange', lty=2,border=NA)
lines(nx1:lx, lb , lty=2)
lines(nx1:lx, ub , lty=2)
lines(x, lwd=2)
lines(nx1:lx, forecast$pred , lwd=2 , col ='white')
box()
par(opar)
dev.off()
prob.dec <- array(NA, dim=fx)
prob.sdec <- array(NA, dim=fx)
prob.ldec <- array(NA, dim=fx)
prob.pval <- array(NA, dim=fx)
perf.pe <- array(0, dim=fx)
perf.mape <- array(0, dim=fx)
perf.mape1 <- array(0, dim=fx)
perf.se <- array(0, dim=fx)
perf.mse <- array(0, dim=fx)
perf.mse1 <- array(0, dim=fx)
perf.rmse <- array(0, dim=fx)
for (i in 1:fx) {
locSD <- (ub[i] - forecast$pred[i]) / 1.96
perf.pe[i] = (x[nx+i] - forecast$pred[i]) / forecast$pred[i]
perf.se[i] = (x[nx+i] - forecast$pred[i])^2
prob.dec[i] = pnorm((x[nx+i-1] - forecast$pred[i]) / locSD)
prob.sdec[i] = pnorm((x[nx+i-par5] - forecast$pred[i]) / locSD)
prob.ldec[i] = pnorm((x[nx] - forecast$pred[i]) / locSD)
prob.pval[i] = pnorm(abs(x[nx+i] - forecast$pred[i]) / locSD)
}
perf.mape[1] = abs(perf.pe[1])
perf.mse[1] = abs(perf.se[1])
for (i in 2:fx) {
perf.mape[i] = perf.mape[i-1] + abs(perf.pe[i])
perf.mape1[i] = perf.mape[i] / i
perf.mse[i] = perf.mse[i-1] + perf.se[i]
perf.mse1[i] = perf.mse[i] / i
}
perf.rmse = sqrt(perf.mse1)
bitmap(file='test2.png')
plot(forecast$pred, pch=19, type='b',main='ARIMA Extrapolation Forecast', ylab='Forecast and 95% CI', xlab='time',ylim=c(min(lb),max(ub)))
dum <- forecast$pred
dum[1:par1] <- x[(nx+1):lx]
lines(dum, lty=1)
lines(ub,lty=3)
lines(lb,lty=3)
dev.off()
load(file='createtable')
a<-table.start()
a<-table.row.start(a)
a<-table.element(a,'Univariate ARIMA Extrapolation Forecast',9,TRUE)
a<-table.row.end(a)
a<-table.row.start(a)
a<-table.element(a,'time',1,header=TRUE)
a<-table.element(a,'Y[t]',1,header=TRUE)
a<-table.element(a,'F[t]',1,header=TRUE)
a<-table.element(a,'95% LB',1,header=TRUE)
a<-table.element(a,'95% UB',1,header=TRUE)
a<-table.element(a,'p-value
(H0: Y[t] = F[t])',1,header=TRUE)
a<-table.element(a,'P(F[t]>Y[t-1])',1,header=TRUE)
a<-table.element(a,'P(F[t]>Y[t-s])',1,header=TRUE)
mylab <- paste('P(F[t]>Y[',nx,sep='')
mylab <- paste(mylab,'])',sep='')
a<-table.element(a,mylab,1,header=TRUE)
a<-table.row.end(a)
for (i in (nx-par5):nx) {
a<-table.row.start(a)
a<-table.element(a,i,header=TRUE)
a<-table.element(a,x[i])
a<-table.element(a,'-')
a<-table.row.end(a)
}
for (i in 1:fx) {
a<-table.row.start(a)
a<-table.element(a,nx+i,header=TRUE)
a<-table.element(a,round(x[nx+i],4))
a<-table.element(a,round(forecast$pred[i],4))
a<-table.element(a,round(lb[i],4))
a<-table.element(a,round(ub[i],4))
a<-table.element(a,round((1-prob.pval[i]),4))
a<-table.element(a,round((1-prob.dec[i]),4))
a<-table.element(a,round((1-prob.sdec[i]),4))
a<-table.element(a,round((1-prob.ldec[i]),4))
a<-table.row.end(a)
}
a<-table.end(a)
table.save(a,file='mytable.tab')
a<-table.start()
a<-table.row.start(a)
a<-table.element(a,'Univariate ARIMA Extrapolation Forecast Performance',7,TRUE)
a<-table.row.end(a)
a<-table.row.start(a)
a<-table.element(a,'time',1,header=TRUE)
a<-table.element(a,'% S.E.',1,header=TRUE)
a<-table.element(a,'PE',1,header=TRUE)
a<-table.element(a,'MAPE',1,header=TRUE)
a<-table.element(a,'Sq.E',1,header=TRUE)
a<-table.element(a,'MSE',1,header=TRUE)
a<-table.element(a,'RMSE',1,header=TRUE)
a<-table.row.end(a)
for (i in 1:fx) {
a<-table.row.start(a)
a<-table.element(a,nx+i,header=TRUE)
a<-table.element(a,round(perc.se[i],4))
a<-table.element(a,round(perf.pe[i],4))
a<-table.element(a,round(perf.mape1[i],4))
a<-table.element(a,round(perf.se[i],4))
a<-table.element(a,round(perf.mse1[i],4))
a<-table.element(a,round(perf.rmse[i],4))
a<-table.row.end(a)
}
a<-table.end(a)
table.save(a,file='mytable1.tab')