Free Statistics

of Irreproducible Research!

Author's title

Author*The author of this computation has been verified*
R Software Modulerwasp_arimabackwardselection.wasp
Title produced by softwareARIMA Backward Selection
Date of computationSun, 26 Dec 2010 15:17:27 +0000
Cite this page as followsStatistical Computations at FreeStatistics.org, Office for Research Development and Education, URL https://freestatistics.org/blog/index.php?v=date/2010/Dec/26/t1293376502p9at77x502ev26a.htm/, Retrieved Mon, 06 May 2024 17:32:48 +0000
Statistical Computations at FreeStatistics.org, Office for Research Development and Education, URL https://freestatistics.org/blog/index.php?pk=115654, Retrieved Mon, 06 May 2024 17:32:48 +0000
QR Codes:

Original text written by user:
IsPrivate?No (this computation is public)
User-defined keywords
Estimated Impact130
Family? (F = Feedback message, R = changed R code, M = changed R Module, P = changed Parameters, D = changed Data)
-     [Univariate Data Series] [tijdreeks bevolki...] [2010-12-26 10:20:42] [efd13e24149aec704f3383e33c1e842a]
-   PD  [Univariate Data Series] [tijdreeks werkloo...] [2010-12-26 13:12:25] [efd13e24149aec704f3383e33c1e842a]
- RMPD      [ARIMA Backward Selection] [tijdreeks werkloo...] [2010-12-26 15:17:27] [531024149246456e4f6d79ace2e85c12] [Current]
Feedback Forum

Post a new message
Dataseries X:
332
369
384
373
378
426
423
397
422
409
430
412
470
491
504
484
474
508
492
452
457
457
471
451
493
514
522
490
484
506
501
462
465
454
464
427
460
473
465
422
415
413
420
363
376
380
384
346
389
407
393
346
348
353
364
305
307
312
312
286
324
336
327
302
299
311
315
264
278
278
287
279
324
354
354
360
363
385
412
370
389
395
417
404
456
478
468
437
432
441
449
386
396
394


Summary of computational transaction
Raw Inputview raw input (R code)
Raw Outputview raw output of R engine
Computing time11 seconds
R Server'RServer@AstonUniversity' @ vre.aston.ac.uk

\begin{tabular}{lllllllll}
\hline
Summary of computational transaction \tabularnewline
Raw Input & view raw input (R code)  \tabularnewline
Raw Output & view raw output of R engine  \tabularnewline
Computing time & 11 seconds \tabularnewline
R Server & 'RServer@AstonUniversity' @ vre.aston.ac.uk \tabularnewline
\hline
\end{tabular}
%Source: https://freestatistics.org/blog/index.php?pk=115654&T=0

[TABLE]
[ROW][C]Summary of computational transaction[/C][/ROW]
[ROW][C]Raw Input[/C][C]view raw input (R code) [/C][/ROW]
[ROW][C]Raw Output[/C][C]view raw output of R engine [/C][/ROW]
[ROW][C]Computing time[/C][C]11 seconds[/C][/ROW]
[ROW][C]R Server[/C][C]'RServer@AstonUniversity' @ vre.aston.ac.uk[/C][/ROW]
[/TABLE]
Source: https://freestatistics.org/blog/index.php?pk=115654&T=0

Globally Unique Identifier (entire table): ba.freestatistics.org/blog/index.php?pk=115654&T=0

As an alternative you can also use a QR Code:  

The GUIDs for individual cells are displayed in the table below:

Summary of computational transaction
Raw Inputview raw input (R code)
Raw Outputview raw output of R engine
Computing time11 seconds
R Server'RServer@AstonUniversity' @ vre.aston.ac.uk


ARIMA Parameter Estimation and Backward Selection
Iterationar1ar2ar3ma1sar1sar2sma1
Estimates ( 1 )0.31760.35070.1995-0.32170.2429-0.1407-0.6005
(p-val)(0.1979 )(0.0033 )(0.2204 )(0.1626 )(0.427 )(0.4369 )(0.0719 )
Estimates ( 2 )0.32130.35540.1917-0.3370.36240-0.7643
(p-val)(0.1835 )(0.0025 )(0.2343 )(0.1303 )(0.1494 )(NA )(0.0026 )
Estimates ( 3 )0.53690.3670-0.51490.37490-0.7452
(p-val)(4e-04 )(0.0031 )(NA )(1e-04 )(0.1568 )(NA )(0.0038 )
Estimates ( 4 )0.52980.37730-0.518800-0.4001
(p-val)(3e-04 )(0.0022 )(NA )(1e-04 )(NA )(NA )(0.0072 )
Estimates ( 5 )NANANANANANANA
(p-val)(NA )(NA )(NA )(NA )(NA )(NA )(NA )
Estimates ( 6 )NANANANANANANA
(p-val)(NA )(NA )(NA )(NA )(NA )(NA )(NA )
Estimates ( 7 )NANANANANANANA
(p-val)(NA )(NA )(NA )(NA )(NA )(NA )(NA )
Estimates ( 8 )NANANANANANANA
(p-val)(NA )(NA )(NA )(NA )(NA )(NA )(NA )
Estimates ( 9 )NANANANANANANA
(p-val)(NA )(NA )(NA )(NA )(NA )(NA )(NA )
Estimates ( 10 )NANANANANANANA
(p-val)(NA )(NA )(NA )(NA )(NA )(NA )(NA )
Estimates ( 11 )NANANANANANANA
(p-val)(NA )(NA )(NA )(NA )(NA )(NA )(NA )
Estimates ( 12 )NANANANANANANA
(p-val)(NA )(NA )(NA )(NA )(NA )(NA )(NA )
Estimates ( 13 )NANANANANANANA
(p-val)(NA )(NA )(NA )(NA )(NA )(NA )(NA )

\begin{tabular}{lllllllll}
\hline
ARIMA Parameter Estimation and Backward Selection \tabularnewline
Iteration & ar1 & ar2 & ar3 & ma1 & sar1 & sar2 & sma1 \tabularnewline
Estimates ( 1 ) & 0.3176 & 0.3507 & 0.1995 & -0.3217 & 0.2429 & -0.1407 & -0.6005 \tabularnewline
(p-val) & (0.1979 ) & (0.0033 ) & (0.2204 ) & (0.1626 ) & (0.427 ) & (0.4369 ) & (0.0719 ) \tabularnewline
Estimates ( 2 ) & 0.3213 & 0.3554 & 0.1917 & -0.337 & 0.3624 & 0 & -0.7643 \tabularnewline
(p-val) & (0.1835 ) & (0.0025 ) & (0.2343 ) & (0.1303 ) & (0.1494 ) & (NA ) & (0.0026 ) \tabularnewline
Estimates ( 3 ) & 0.5369 & 0.367 & 0 & -0.5149 & 0.3749 & 0 & -0.7452 \tabularnewline
(p-val) & (4e-04 ) & (0.0031 ) & (NA ) & (1e-04 ) & (0.1568 ) & (NA ) & (0.0038 ) \tabularnewline
Estimates ( 4 ) & 0.5298 & 0.3773 & 0 & -0.5188 & 0 & 0 & -0.4001 \tabularnewline
(p-val) & (3e-04 ) & (0.0022 ) & (NA ) & (1e-04 ) & (NA ) & (NA ) & (0.0072 ) \tabularnewline
Estimates ( 5 ) & NA & NA & NA & NA & NA & NA & NA \tabularnewline
(p-val) & (NA ) & (NA ) & (NA ) & (NA ) & (NA ) & (NA ) & (NA ) \tabularnewline
Estimates ( 6 ) & NA & NA & NA & NA & NA & NA & NA \tabularnewline
(p-val) & (NA ) & (NA ) & (NA ) & (NA ) & (NA ) & (NA ) & (NA ) \tabularnewline
Estimates ( 7 ) & NA & NA & NA & NA & NA & NA & NA \tabularnewline
(p-val) & (NA ) & (NA ) & (NA ) & (NA ) & (NA ) & (NA ) & (NA ) \tabularnewline
Estimates ( 8 ) & NA & NA & NA & NA & NA & NA & NA \tabularnewline
(p-val) & (NA ) & (NA ) & (NA ) & (NA ) & (NA ) & (NA ) & (NA ) \tabularnewline
Estimates ( 9 ) & NA & NA & NA & NA & NA & NA & NA \tabularnewline
(p-val) & (NA ) & (NA ) & (NA ) & (NA ) & (NA ) & (NA ) & (NA ) \tabularnewline
Estimates ( 10 ) & NA & NA & NA & NA & NA & NA & NA \tabularnewline
(p-val) & (NA ) & (NA ) & (NA ) & (NA ) & (NA ) & (NA ) & (NA ) \tabularnewline
Estimates ( 11 ) & NA & NA & NA & NA & NA & NA & NA \tabularnewline
(p-val) & (NA ) & (NA ) & (NA ) & (NA ) & (NA ) & (NA ) & (NA ) \tabularnewline
Estimates ( 12 ) & NA & NA & NA & NA & NA & NA & NA \tabularnewline
(p-val) & (NA ) & (NA ) & (NA ) & (NA ) & (NA ) & (NA ) & (NA ) \tabularnewline
Estimates ( 13 ) & NA & NA & NA & NA & NA & NA & NA \tabularnewline
(p-val) & (NA ) & (NA ) & (NA ) & (NA ) & (NA ) & (NA ) & (NA ) \tabularnewline
\hline
\end{tabular}
%Source: https://freestatistics.org/blog/index.php?pk=115654&T=1

[TABLE]
[ROW][C]ARIMA Parameter Estimation and Backward Selection[/C][/ROW]
[ROW][C]Iteration[/C][C]ar1[/C][C]ar2[/C][C]ar3[/C][C]ma1[/C][C]sar1[/C][C]sar2[/C][C]sma1[/C][/ROW]
[ROW][C]Estimates ( 1 )[/C][C]0.3176[/C][C]0.3507[/C][C]0.1995[/C][C]-0.3217[/C][C]0.2429[/C][C]-0.1407[/C][C]-0.6005[/C][/ROW]
[ROW][C](p-val)[/C][C](0.1979 )[/C][C](0.0033 )[/C][C](0.2204 )[/C][C](0.1626 )[/C][C](0.427 )[/C][C](0.4369 )[/C][C](0.0719 )[/C][/ROW]
[ROW][C]Estimates ( 2 )[/C][C]0.3213[/C][C]0.3554[/C][C]0.1917[/C][C]-0.337[/C][C]0.3624[/C][C]0[/C][C]-0.7643[/C][/ROW]
[ROW][C](p-val)[/C][C](0.1835 )[/C][C](0.0025 )[/C][C](0.2343 )[/C][C](0.1303 )[/C][C](0.1494 )[/C][C](NA )[/C][C](0.0026 )[/C][/ROW]
[ROW][C]Estimates ( 3 )[/C][C]0.5369[/C][C]0.367[/C][C]0[/C][C]-0.5149[/C][C]0.3749[/C][C]0[/C][C]-0.7452[/C][/ROW]
[ROW][C](p-val)[/C][C](4e-04 )[/C][C](0.0031 )[/C][C](NA )[/C][C](1e-04 )[/C][C](0.1568 )[/C][C](NA )[/C][C](0.0038 )[/C][/ROW]
[ROW][C]Estimates ( 4 )[/C][C]0.5298[/C][C]0.3773[/C][C]0[/C][C]-0.5188[/C][C]0[/C][C]0[/C][C]-0.4001[/C][/ROW]
[ROW][C](p-val)[/C][C](3e-04 )[/C][C](0.0022 )[/C][C](NA )[/C][C](1e-04 )[/C][C](NA )[/C][C](NA )[/C][C](0.0072 )[/C][/ROW]
[ROW][C]Estimates ( 5 )[/C][C]NA[/C][C]NA[/C][C]NA[/C][C]NA[/C][C]NA[/C][C]NA[/C][C]NA[/C][/ROW]
[ROW][C](p-val)[/C][C](NA )[/C][C](NA )[/C][C](NA )[/C][C](NA )[/C][C](NA )[/C][C](NA )[/C][C](NA )[/C][/ROW]
[ROW][C]Estimates ( 6 )[/C][C]NA[/C][C]NA[/C][C]NA[/C][C]NA[/C][C]NA[/C][C]NA[/C][C]NA[/C][/ROW]
[ROW][C](p-val)[/C][C](NA )[/C][C](NA )[/C][C](NA )[/C][C](NA )[/C][C](NA )[/C][C](NA )[/C][C](NA )[/C][/ROW]
[ROW][C]Estimates ( 7 )[/C][C]NA[/C][C]NA[/C][C]NA[/C][C]NA[/C][C]NA[/C][C]NA[/C][C]NA[/C][/ROW]
[ROW][C](p-val)[/C][C](NA )[/C][C](NA )[/C][C](NA )[/C][C](NA )[/C][C](NA )[/C][C](NA )[/C][C](NA )[/C][/ROW]
[ROW][C]Estimates ( 8 )[/C][C]NA[/C][C]NA[/C][C]NA[/C][C]NA[/C][C]NA[/C][C]NA[/C][C]NA[/C][/ROW]
[ROW][C](p-val)[/C][C](NA )[/C][C](NA )[/C][C](NA )[/C][C](NA )[/C][C](NA )[/C][C](NA )[/C][C](NA )[/C][/ROW]
[ROW][C]Estimates ( 9 )[/C][C]NA[/C][C]NA[/C][C]NA[/C][C]NA[/C][C]NA[/C][C]NA[/C][C]NA[/C][/ROW]
[ROW][C](p-val)[/C][C](NA )[/C][C](NA )[/C][C](NA )[/C][C](NA )[/C][C](NA )[/C][C](NA )[/C][C](NA )[/C][/ROW]
[ROW][C]Estimates ( 10 )[/C][C]NA[/C][C]NA[/C][C]NA[/C][C]NA[/C][C]NA[/C][C]NA[/C][C]NA[/C][/ROW]
[ROW][C](p-val)[/C][C](NA )[/C][C](NA )[/C][C](NA )[/C][C](NA )[/C][C](NA )[/C][C](NA )[/C][C](NA )[/C][/ROW]
[ROW][C]Estimates ( 11 )[/C][C]NA[/C][C]NA[/C][C]NA[/C][C]NA[/C][C]NA[/C][C]NA[/C][C]NA[/C][/ROW]
[ROW][C](p-val)[/C][C](NA )[/C][C](NA )[/C][C](NA )[/C][C](NA )[/C][C](NA )[/C][C](NA )[/C][C](NA )[/C][/ROW]
[ROW][C]Estimates ( 12 )[/C][C]NA[/C][C]NA[/C][C]NA[/C][C]NA[/C][C]NA[/C][C]NA[/C][C]NA[/C][/ROW]
[ROW][C](p-val)[/C][C](NA )[/C][C](NA )[/C][C](NA )[/C][C](NA )[/C][C](NA )[/C][C](NA )[/C][C](NA )[/C][/ROW]
[ROW][C]Estimates ( 13 )[/C][C]NA[/C][C]NA[/C][C]NA[/C][C]NA[/C][C]NA[/C][C]NA[/C][C]NA[/C][/ROW]
[ROW][C](p-val)[/C][C](NA )[/C][C](NA )[/C][C](NA )[/C][C](NA )[/C][C](NA )[/C][C](NA )[/C][C](NA )[/C][/ROW]
[/TABLE]
Source: https://freestatistics.org/blog/index.php?pk=115654&T=1

Globally Unique Identifier (entire table): ba.freestatistics.org/blog/index.php?pk=115654&T=1

As an alternative you can also use a QR Code:  

The GUIDs for individual cells are displayed in the table below:

ARIMA Parameter Estimation and Backward Selection
Iterationar1ar2ar3ma1sar1sar2sma1
Estimates ( 1 )0.31760.35070.1995-0.32170.2429-0.1407-0.6005
(p-val)(0.1979 )(0.0033 )(0.2204 )(0.1626 )(0.427 )(0.4369 )(0.0719 )
Estimates ( 2 )0.32130.35540.1917-0.3370.36240-0.7643
(p-val)(0.1835 )(0.0025 )(0.2343 )(0.1303 )(0.1494 )(NA )(0.0026 )
Estimates ( 3 )0.53690.3670-0.51490.37490-0.7452
(p-val)(4e-04 )(0.0031 )(NA )(1e-04 )(0.1568 )(NA )(0.0038 )
Estimates ( 4 )0.52980.37730-0.518800-0.4001
(p-val)(3e-04 )(0.0022 )(NA )(1e-04 )(NA )(NA )(0.0072 )
Estimates ( 5 )NANANANANANANA
(p-val)(NA )(NA )(NA )(NA )(NA )(NA )(NA )
Estimates ( 6 )NANANANANANANA
(p-val)(NA )(NA )(NA )(NA )(NA )(NA )(NA )
Estimates ( 7 )NANANANANANANA
(p-val)(NA )(NA )(NA )(NA )(NA )(NA )(NA )
Estimates ( 8 )NANANANANANANA
(p-val)(NA )(NA )(NA )(NA )(NA )(NA )(NA )
Estimates ( 9 )NANANANANANANA
(p-val)(NA )(NA )(NA )(NA )(NA )(NA )(NA )
Estimates ( 10 )NANANANANANANA
(p-val)(NA )(NA )(NA )(NA )(NA )(NA )(NA )
Estimates ( 11 )NANANANANANANA
(p-val)(NA )(NA )(NA )(NA )(NA )(NA )(NA )
Estimates ( 12 )NANANANANANANA
(p-val)(NA )(NA )(NA )(NA )(NA )(NA )(NA )
Estimates ( 13 )NANANANANANANA
(p-val)(NA )(NA )(NA )(NA )(NA )(NA )(NA )


Estimated ARIMA Residuals
Value
-0.842598148109373
-12.687471279854
1.33529062098407
-1.52608756783104
-9.8038236607025
-7.88341636835107
-4.48564744587875
-4.55938665638165
-10.0544915117902
21.0549614608075
4.3143825841693
-1.46618453593632
-12.1171383567165
-0.302918595087467
2.34898568223244
-8.54209702035785
4.73770551614108
-7.92344086062286
11.0224203536725
4.39720432127751
-6.39305817944893
-6.17962259215388
-2.69522327651269
-13.2837841606451
-8.51511808037518
-0.965486061294074
-7.37551346853937
-6.76183087102348
8.96651068220005
-18.2089994253856
20.1018071051672
-5.76640632360045
8.25373279830115
21.9028815398419
-6.75966326139616
-11.1235135111605
4.96218121684402
3.92984179944801
-11.9864034348185
-11.0981042084894
12.5007739777215
0.738839013015838
9.31218720199166
-7.71204661597688
-12.8003118771947
7.68940077568577
-3.03900362632629
7.77132726575262
-2.9079775013126
-8.0948646473359
0.15984712205514
18.8326246091762
-0.458748358729377
-4.16903804331284
-3.33175733969698
0.751772346352357
8.38331819128863
-2.35064683043181
1.08971228053348
17.1907670263024
1.59956481796891
6.46135958019724
-0.459908514760568
25.0825289216983
-1.51169120626917
-8.85901235107108
13.2909557546675
-1.7497027424119
-7.06926554613498
-3.16782538359738
5.27907108107028
-4.73165576053109
-0.660288376601008
-8.93370202925029
-14.4570903584836
-24.6350299753082
-2.6645151230629
-0.785430978389326
-2.01641515297207
-10.8130751276736
2.17498939644703
5.98730409408423

\begin{tabular}{lllllllll}
\hline
Estimated ARIMA Residuals \tabularnewline
Value \tabularnewline
-0.842598148109373 \tabularnewline
-12.687471279854 \tabularnewline
1.33529062098407 \tabularnewline
-1.52608756783104 \tabularnewline
-9.8038236607025 \tabularnewline
-7.88341636835107 \tabularnewline
-4.48564744587875 \tabularnewline
-4.55938665638165 \tabularnewline
-10.0544915117902 \tabularnewline
21.0549614608075 \tabularnewline
4.3143825841693 \tabularnewline
-1.46618453593632 \tabularnewline
-12.1171383567165 \tabularnewline
-0.302918595087467 \tabularnewline
2.34898568223244 \tabularnewline
-8.54209702035785 \tabularnewline
4.73770551614108 \tabularnewline
-7.92344086062286 \tabularnewline
11.0224203536725 \tabularnewline
4.39720432127751 \tabularnewline
-6.39305817944893 \tabularnewline
-6.17962259215388 \tabularnewline
-2.69522327651269 \tabularnewline
-13.2837841606451 \tabularnewline
-8.51511808037518 \tabularnewline
-0.965486061294074 \tabularnewline
-7.37551346853937 \tabularnewline
-6.76183087102348 \tabularnewline
8.96651068220005 \tabularnewline
-18.2089994253856 \tabularnewline
20.1018071051672 \tabularnewline
-5.76640632360045 \tabularnewline
8.25373279830115 \tabularnewline
21.9028815398419 \tabularnewline
-6.75966326139616 \tabularnewline
-11.1235135111605 \tabularnewline
4.96218121684402 \tabularnewline
3.92984179944801 \tabularnewline
-11.9864034348185 \tabularnewline
-11.0981042084894 \tabularnewline
12.5007739777215 \tabularnewline
0.738839013015838 \tabularnewline
9.31218720199166 \tabularnewline
-7.71204661597688 \tabularnewline
-12.8003118771947 \tabularnewline
7.68940077568577 \tabularnewline
-3.03900362632629 \tabularnewline
7.77132726575262 \tabularnewline
-2.9079775013126 \tabularnewline
-8.0948646473359 \tabularnewline
0.15984712205514 \tabularnewline
18.8326246091762 \tabularnewline
-0.458748358729377 \tabularnewline
-4.16903804331284 \tabularnewline
-3.33175733969698 \tabularnewline
0.751772346352357 \tabularnewline
8.38331819128863 \tabularnewline
-2.35064683043181 \tabularnewline
1.08971228053348 \tabularnewline
17.1907670263024 \tabularnewline
1.59956481796891 \tabularnewline
6.46135958019724 \tabularnewline
-0.459908514760568 \tabularnewline
25.0825289216983 \tabularnewline
-1.51169120626917 \tabularnewline
-8.85901235107108 \tabularnewline
13.2909557546675 \tabularnewline
-1.7497027424119 \tabularnewline
-7.06926554613498 \tabularnewline
-3.16782538359738 \tabularnewline
5.27907108107028 \tabularnewline
-4.73165576053109 \tabularnewline
-0.660288376601008 \tabularnewline
-8.93370202925029 \tabularnewline
-14.4570903584836 \tabularnewline
-24.6350299753082 \tabularnewline
-2.6645151230629 \tabularnewline
-0.785430978389326 \tabularnewline
-2.01641515297207 \tabularnewline
-10.8130751276736 \tabularnewline
2.17498939644703 \tabularnewline
5.98730409408423 \tabularnewline
\hline
\end{tabular}
%Source: https://freestatistics.org/blog/index.php?pk=115654&T=2

[TABLE]
[ROW][C]Estimated ARIMA Residuals[/C][/ROW]
[ROW][C]Value[/C][/ROW]
[ROW][C]-0.842598148109373[/C][/ROW]
[ROW][C]-12.687471279854[/C][/ROW]
[ROW][C]1.33529062098407[/C][/ROW]
[ROW][C]-1.52608756783104[/C][/ROW]
[ROW][C]-9.8038236607025[/C][/ROW]
[ROW][C]-7.88341636835107[/C][/ROW]
[ROW][C]-4.48564744587875[/C][/ROW]
[ROW][C]-4.55938665638165[/C][/ROW]
[ROW][C]-10.0544915117902[/C][/ROW]
[ROW][C]21.0549614608075[/C][/ROW]
[ROW][C]4.3143825841693[/C][/ROW]
[ROW][C]-1.46618453593632[/C][/ROW]
[ROW][C]-12.1171383567165[/C][/ROW]
[ROW][C]-0.302918595087467[/C][/ROW]
[ROW][C]2.34898568223244[/C][/ROW]
[ROW][C]-8.54209702035785[/C][/ROW]
[ROW][C]4.73770551614108[/C][/ROW]
[ROW][C]-7.92344086062286[/C][/ROW]
[ROW][C]11.0224203536725[/C][/ROW]
[ROW][C]4.39720432127751[/C][/ROW]
[ROW][C]-6.39305817944893[/C][/ROW]
[ROW][C]-6.17962259215388[/C][/ROW]
[ROW][C]-2.69522327651269[/C][/ROW]
[ROW][C]-13.2837841606451[/C][/ROW]
[ROW][C]-8.51511808037518[/C][/ROW]
[ROW][C]-0.965486061294074[/C][/ROW]
[ROW][C]-7.37551346853937[/C][/ROW]
[ROW][C]-6.76183087102348[/C][/ROW]
[ROW][C]8.96651068220005[/C][/ROW]
[ROW][C]-18.2089994253856[/C][/ROW]
[ROW][C]20.1018071051672[/C][/ROW]
[ROW][C]-5.76640632360045[/C][/ROW]
[ROW][C]8.25373279830115[/C][/ROW]
[ROW][C]21.9028815398419[/C][/ROW]
[ROW][C]-6.75966326139616[/C][/ROW]
[ROW][C]-11.1235135111605[/C][/ROW]
[ROW][C]4.96218121684402[/C][/ROW]
[ROW][C]3.92984179944801[/C][/ROW]
[ROW][C]-11.9864034348185[/C][/ROW]
[ROW][C]-11.0981042084894[/C][/ROW]
[ROW][C]12.5007739777215[/C][/ROW]
[ROW][C]0.738839013015838[/C][/ROW]
[ROW][C]9.31218720199166[/C][/ROW]
[ROW][C]-7.71204661597688[/C][/ROW]
[ROW][C]-12.8003118771947[/C][/ROW]
[ROW][C]7.68940077568577[/C][/ROW]
[ROW][C]-3.03900362632629[/C][/ROW]
[ROW][C]7.77132726575262[/C][/ROW]
[ROW][C]-2.9079775013126[/C][/ROW]
[ROW][C]-8.0948646473359[/C][/ROW]
[ROW][C]0.15984712205514[/C][/ROW]
[ROW][C]18.8326246091762[/C][/ROW]
[ROW][C]-0.458748358729377[/C][/ROW]
[ROW][C]-4.16903804331284[/C][/ROW]
[ROW][C]-3.33175733969698[/C][/ROW]
[ROW][C]0.751772346352357[/C][/ROW]
[ROW][C]8.38331819128863[/C][/ROW]
[ROW][C]-2.35064683043181[/C][/ROW]
[ROW][C]1.08971228053348[/C][/ROW]
[ROW][C]17.1907670263024[/C][/ROW]
[ROW][C]1.59956481796891[/C][/ROW]
[ROW][C]6.46135958019724[/C][/ROW]
[ROW][C]-0.459908514760568[/C][/ROW]
[ROW][C]25.0825289216983[/C][/ROW]
[ROW][C]-1.51169120626917[/C][/ROW]
[ROW][C]-8.85901235107108[/C][/ROW]
[ROW][C]13.2909557546675[/C][/ROW]
[ROW][C]-1.7497027424119[/C][/ROW]
[ROW][C]-7.06926554613498[/C][/ROW]
[ROW][C]-3.16782538359738[/C][/ROW]
[ROW][C]5.27907108107028[/C][/ROW]
[ROW][C]-4.73165576053109[/C][/ROW]
[ROW][C]-0.660288376601008[/C][/ROW]
[ROW][C]-8.93370202925029[/C][/ROW]
[ROW][C]-14.4570903584836[/C][/ROW]
[ROW][C]-24.6350299753082[/C][/ROW]
[ROW][C]-2.6645151230629[/C][/ROW]
[ROW][C]-0.785430978389326[/C][/ROW]
[ROW][C]-2.01641515297207[/C][/ROW]
[ROW][C]-10.8130751276736[/C][/ROW]
[ROW][C]2.17498939644703[/C][/ROW]
[ROW][C]5.98730409408423[/C][/ROW]
[/TABLE]
Source: https://freestatistics.org/blog/index.php?pk=115654&T=2

Globally Unique Identifier (entire table): ba.freestatistics.org/blog/index.php?pk=115654&T=2

As an alternative you can also use a QR Code:  

The GUIDs for individual cells are displayed in the table below:

Estimated ARIMA Residuals
Value
-0.842598148109373
-12.687471279854
1.33529062098407
-1.52608756783104
-9.8038236607025
-7.88341636835107
-4.48564744587875
-4.55938665638165
-10.0544915117902
21.0549614608075
4.3143825841693
-1.46618453593632
-12.1171383567165
-0.302918595087467
2.34898568223244
-8.54209702035785
4.73770551614108
-7.92344086062286
11.0224203536725
4.39720432127751
-6.39305817944893
-6.17962259215388
-2.69522327651269
-13.2837841606451
-8.51511808037518
-0.965486061294074
-7.37551346853937
-6.76183087102348
8.96651068220005
-18.2089994253856
20.1018071051672
-5.76640632360045
8.25373279830115
21.9028815398419
-6.75966326139616
-11.1235135111605
4.96218121684402
3.92984179944801
-11.9864034348185
-11.0981042084894
12.5007739777215
0.738839013015838
9.31218720199166
-7.71204661597688
-12.8003118771947
7.68940077568577
-3.03900362632629
7.77132726575262
-2.9079775013126
-8.0948646473359
0.15984712205514
18.8326246091762
-0.458748358729377
-4.16903804331284
-3.33175733969698
0.751772346352357
8.38331819128863
-2.35064683043181
1.08971228053348
17.1907670263024
1.59956481796891
6.46135958019724
-0.459908514760568
25.0825289216983
-1.51169120626917
-8.85901235107108
13.2909557546675
-1.7497027424119
-7.06926554613498
-3.16782538359738
5.27907108107028
-4.73165576053109
-0.660288376601008
-8.93370202925029
-14.4570903584836
-24.6350299753082
-2.6645151230629
-0.785430978389326
-2.01641515297207
-10.8130751276736
2.17498939644703
5.98730409408423


Parameters (Session):
Parameters (R input):
par1 = FALSE ; par2 = 1 ; par3 = 1 ; par4 = 1 ; par5 = 12 ; par6 = 3 ; par7 = 1 ; par8 = 2 ; par9 = 1 ;
R code (references can be found in the software module):
library(lattice)
if (par1 == 'TRUE') par1 <- TRUE
if (par1 == 'FALSE') par1 <- FALSE
par2 <- as.numeric(par2) #Box-Cox lambda transformation parameter
par3 <- as.numeric(par3) #degree of non-seasonal differencing
par4 <- as.numeric(par4) #degree of seasonal differencing
par5 <- as.numeric(par5) #seasonal period
par6 <- as.numeric(par6) #degree (p) of the non-seasonal AR(p) polynomial
par7 <- as.numeric(par7) #degree (q) of the non-seasonal MA(q) polynomial
par8 <- as.numeric(par8) #degree (P) of the seasonal AR(P) polynomial
par9 <- as.numeric(par9) #degree (Q) of the seasonal MA(Q) polynomial
armaGR <- function(arima.out, names, n){
try1 <- arima.out$coef
try2 <- sqrt(diag(arima.out$var.coef))
try.data.frame <- data.frame(matrix(NA,ncol=4,nrow=length(names)))
dimnames(try.data.frame) <- list(names,c('coef','std','tstat','pv'))
try.data.frame[,1] <- try1
for(i in 1:length(try2)) try.data.frame[which(rownames(try.data.frame)==names(try2)[i]),2] <- try2[i]
try.data.frame[,3] <- try.data.frame[,1] / try.data.frame[,2]
try.data.frame[,4] <- round((1-pt(abs(try.data.frame[,3]),df=n-(length(try2)+1)))*2,5)
vector <- rep(NA,length(names))
vector[is.na(try.data.frame[,4])] <- 0
maxi <- which.max(try.data.frame[,4])
continue <- max(try.data.frame[,4],na.rm=TRUE) > .05
vector[maxi] <- 0
list(summary=try.data.frame,next.vector=vector,continue=continue)
}
arimaSelect <- function(series, order=c(13,0,0), seasonal=list(order=c(2,0,0),period=12), include.mean=F){
nrc <- order[1]+order[3]+seasonal$order[1]+seasonal$order[3]
coeff <- matrix(NA, nrow=nrc*2, ncol=nrc)
pval <- matrix(NA, nrow=nrc*2, ncol=nrc)
mylist <- rep(list(NULL), nrc)
names <- NULL
if(order[1] > 0) names <- paste('ar',1:order[1],sep='')
if(order[3] > 0) names <- c( names , paste('ma',1:order[3],sep='') )
if(seasonal$order[1] > 0) names <- c(names, paste('sar',1:seasonal$order[1],sep=''))
if(seasonal$order[3] > 0) names <- c(names, paste('sma',1:seasonal$order[3],sep=''))
arima.out <- arima(series, order=order, seasonal=seasonal, include.mean=include.mean, method='ML')
mylist[[1]] <- arima.out
last.arma <- armaGR(arima.out, names, length(series))
mystop <- FALSE
i <- 1
coeff[i,] <- last.arma[[1]][,1]
pval [i,] <- last.arma[[1]][,4]
i <- 2
aic <- arima.out$aic
while(!mystop){
mylist[[i]] <- arima.out
arima.out <- arima(series, order=order, seasonal=seasonal, include.mean=include.mean, method='ML', fixed=last.arma$next.vector)
aic <- c(aic, arima.out$aic)
last.arma <- armaGR(arima.out, names, length(series))
mystop <- !last.arma$continue
coeff[i,] <- last.arma[[1]][,1]
pval [i,] <- last.arma[[1]][,4]
i <- i+1
}
list(coeff, pval, mylist, aic=aic)
}
arimaSelectplot <- function(arimaSelect.out,noms,choix){
noms <- names(arimaSelect.out[[3]][[1]]$coef)
coeff <- arimaSelect.out[[1]]
k <- min(which(is.na(coeff[,1])))-1
coeff <- coeff[1:k,]
pval <- arimaSelect.out[[2]][1:k,]
aic <- arimaSelect.out$aic[1:k]
coeff[coeff==0] <- NA
n <- ncol(coeff)
if(missing(choix)) choix <- k
layout(matrix(c(1,1,1,2,
3,3,3,2,
3,3,3,4,
5,6,7,7),nr=4),
widths=c(10,35,45,15),
heights=c(30,30,15,15))
couleurs <- rainbow(75)[1:50]#(50)
ticks <- pretty(coeff)
par(mar=c(1,1,3,1))
plot(aic,k:1-.5,type='o',pch=21,bg='blue',cex=2,axes=F,lty=2,xpd=NA)
points(aic[choix],k-choix+.5,pch=21,cex=4,bg=2,xpd=NA)
title('aic',line=2)
par(mar=c(3,0,0,0))
plot(0,axes=F,xlab='',ylab='',xlim=range(ticks),ylim=c(.1,1))
rect(xleft = min(ticks) + (0:49)/50*(max(ticks)-min(ticks)),
xright = min(ticks) + (1:50)/50*(max(ticks)-min(ticks)),
ytop = rep(1,50),
ybottom= rep(0,50),col=couleurs,border=NA)
axis(1,ticks)
rect(xleft=min(ticks),xright=max(ticks),ytop=1,ybottom=0)
text(mean(coeff,na.rm=T),.5,'coefficients',cex=2,font=2)
par(mar=c(1,1,3,1))
image(1:n,1:k,t(coeff[k:1,]),axes=F,col=couleurs,zlim=range(ticks))
for(i in 1:n) for(j in 1:k) if(!is.na(coeff[j,i])) {
if(pval[j,i]<.01) symb = 'green'
else if( (pval[j,i]<.05) & (pval[j,i]>=.01)) symb = 'orange'
else if( (pval[j,i]<.1) & (pval[j,i]>=.05)) symb = 'red'
else symb = 'black'
polygon(c(i+.5 ,i+.2 ,i+.5 ,i+.5),
c(k-j+0.5,k-j+0.5,k-j+0.8,k-j+0.5),
col=symb)
if(j==choix) {
rect(xleft=i-.5,
xright=i+.5,
ybottom=k-j+1.5,
ytop=k-j+.5,
lwd=4)
text(i,
k-j+1,
round(coeff[j,i],2),
cex=1.2,
font=2)
}
else{
rect(xleft=i-.5,xright=i+.5,ybottom=k-j+1.5,ytop=k-j+.5)
text(i,k-j+1,round(coeff[j,i],2),cex=1.2,font=1)
}
}
axis(3,1:n,noms)
par(mar=c(0.5,0,0,0.5))
plot(0,axes=F,xlab='',ylab='',type='n',xlim=c(0,8),ylim=c(-.2,.8))
cols <- c('green','orange','red','black')
niv <- c('0','0.01','0.05','0.1')
for(i in 0:3){
polygon(c(1+2*i ,1+2*i ,1+2*i-.5 ,1+2*i),
c(.4 ,.7 , .4 , .4),
col=cols[i+1])
text(2*i,0.5,niv[i+1],cex=1.5)
}
text(8,.5,1,cex=1.5)
text(4,0,'p-value',cex=2)
box()
residus <- arimaSelect.out[[3]][[choix]]$res
par(mar=c(1,2,4,1))
acf(residus,main='')
title('acf',line=.5)
par(mar=c(1,2,4,1))
pacf(residus,main='')
title('pacf',line=.5)
par(mar=c(2,2,4,1))
qqnorm(residus,main='')
title('qq-norm',line=.5)
qqline(residus)
residus
}
if (par2 == 0) x <- log(x)
if (par2 != 0) x <- x^par2
(selection <- arimaSelect(x, order=c(par6,par3,par7), seasonal=list(order=c(par8,par4,par9), period=par5)))
bitmap(file='test1.png')
resid <- arimaSelectplot(selection)
dev.off()
resid
bitmap(file='test2.png')
acf(resid,length(resid)/2, main='Residual Autocorrelation Function')
dev.off()
bitmap(file='test3.png')
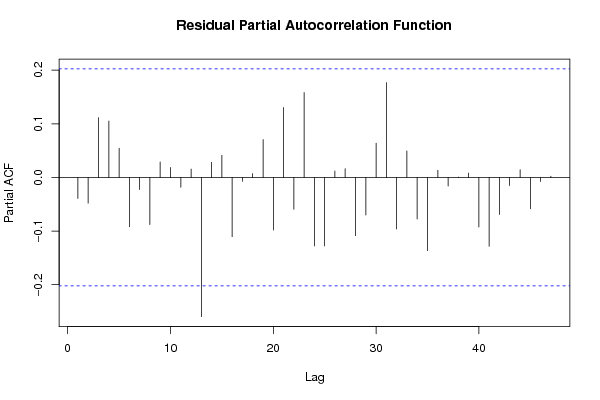
pacf(resid,length(resid)/2, main='Residual Partial Autocorrelation Function')
dev.off()
bitmap(file='test4.png')
cpgram(resid, main='Residual Cumulative Periodogram')
dev.off()
bitmap(file='test5.png')
hist(resid, main='Residual Histogram', xlab='values of Residuals')
dev.off()
bitmap(file='test6.png')
densityplot(~resid,col='black',main='Residual Density Plot', xlab='values of Residuals')
dev.off()
bitmap(file='test7.png')
qqnorm(resid, main='Residual Normal Q-Q Plot')
qqline(resid)
dev.off()
ncols <- length(selection[[1]][1,])
nrows <- length(selection[[2]][,1])-1
load(file='createtable')
a<-table.start()
a<-table.row.start(a)
a<-table.element(a,'ARIMA Parameter Estimation and Backward Selection', ncols+1,TRUE)
a<-table.row.end(a)
a<-table.row.start(a)
a<-table.element(a,'Iteration', header=TRUE)
for (i in 1:ncols) {
a<-table.element(a,names(selection[[3]][[1]]$coef)[i],header=TRUE)
}
a<-table.row.end(a)
for (j in 1:nrows) {
a<-table.row.start(a)
mydum <- 'Estimates ('
mydum <- paste(mydum,j)
mydum <- paste(mydum,')')
a<-table.element(a,mydum, header=TRUE)
for (i in 1:ncols) {
a<-table.element(a,round(selection[[1]][j,i],4))
}
a<-table.row.end(a)
a<-table.row.start(a)
a<-table.element(a,'(p-val)', header=TRUE)
for (i in 1:ncols) {
mydum <- '('
mydum <- paste(mydum,round(selection[[2]][j,i],4),sep='')
mydum <- paste(mydum,')')
a<-table.element(a,mydum)
}
a<-table.row.end(a)
}
a<-table.end(a)
table.save(a,file='mytable.tab')
a<-table.start()
a<-table.row.start(a)
a<-table.element(a,'Estimated ARIMA Residuals', 1,TRUE)
a<-table.row.end(a)
a<-table.row.start(a)
a<-table.element(a,'Value', 1,TRUE)
a<-table.row.end(a)
for (i in (par4*par5+par3):length(resid)) {
a<-table.row.start(a)
a<-table.element(a,resid[i])
a<-table.row.end(a)
}
a<-table.end(a)
table.save(a,file='mytable1.tab')