| Multiple Linear Regression - Estimated Regression Equation |
| 2JAAR[t] = + 11.6109108530227 + 23.9376081304436Eonia[t] + 1.06465328450808deposits[t] -0.00867124946976638DowJones[t] + e[t] |
| Multiple Linear Regression - Ordinary Least Squares | |||||
| Variable | Parameter | S.D. | T-STAT H0: parameter = 0 | 2-tail p-value | 1-tail p-value |
| (Intercept) | 11.6109108530227 | 20.80869 | 0.558 | 0.579041 | 0.28952 |
| Eonia | 23.9376081304436 | 1.533361 | 15.6112 | 0 | 0 |
| deposits | 1.06465328450808 | 0.170415 | 6.2474 | 0 | 0 |
| DowJones | -0.00867124946976638 | 0.001197 | -7.2428 | 0 | 0 |
| Multiple Linear Regression - Regression Statistics | |
| Multiple R | 0.914476528233309 |
| R-squared | 0.836267320689645 |
| Adjusted R-squared | 0.827649811252258 |
| F-TEST (value) | 97.0428088029121 |
| F-TEST (DF numerator) | 3 |
| F-TEST (DF denominator) | 57 |
| p-value | 0 |
| Multiple Linear Regression - Residual Statistics | |
| Residual Standard Deviation | 10.0618089935600 |
| Sum Squared Residuals | 5770.68001270445 |
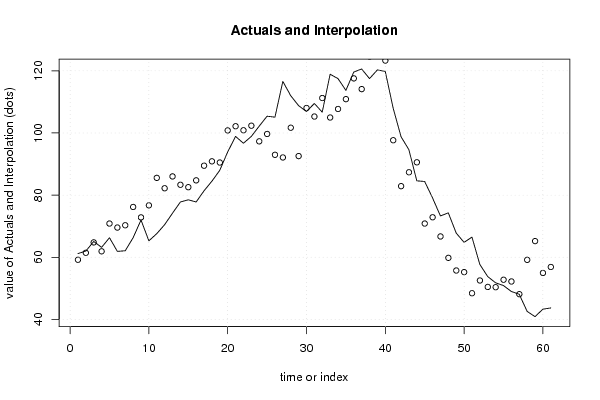
| Multiple Linear Regression - Actuals, Interpolation, and Residuals | |||
| Time or Index | Actuals | Interpolation Forecast | Residuals Prediction Error |
| 1 | 61.2 | 59.206838193302 | 1.99316180669800 |
| 2 | 62 | 61.4445511092479 | 0.555448890752112 |
| 3 | 65.1 | 64.7942544642938 | 0.30574553570624 |
| 4 | 63.2 | 61.9242662265735 | 1.27573377342653 |
| 5 | 66.3 | 70.8570971285689 | -4.5570971285689 |
| 6 | 61.9 | 69.5651389383423 | -7.66513893834233 |
| 7 | 62.1 | 70.3054961991043 | -8.20549619910427 |
| 8 | 66.3 | 76.1882903743226 | -9.88829037432258 |
| 9 | 72 | 72.8339920959675 | -0.83399209596754 |
| 10 | 65.3 | 76.7118530800474 | -11.4118530800474 |
| 11 | 67.6 | 85.5561236732419 | -17.9561236732419 |
| 12 | 70.5 | 82.2118476536927 | -11.7118476536927 |
| 13 | 74.2 | 86.0187645224916 | -11.8187645224916 |
| 14 | 77.8 | 83.3297843771742 | -5.52978437717424 |
| 15 | 78.5 | 82.5550209487686 | -4.05502094876860 |
| 16 | 77.8 | 84.755445814175 | -6.95544581417505 |
| 17 | 81.4 | 89.4696247199009 | -8.06962471990089 |
| 18 | 84.5 | 90.8789617421873 | -6.37896174218732 |
| 19 | 88 | 90.4894302382726 | -2.48943023827258 |
| 20 | 93.9 | 100.818626303297 | -6.91862630329687 |
| 21 | 98.9 | 102.164700327478 | -3.2647003274784 |
| 22 | 96.7 | 100.868570083517 | -4.16857008351707 |
| 23 | 98.9 | 102.338327075674 | -3.43832707567448 |
| 24 | 102.2 | 97.310852909766 | 4.88914709023401 |
| 25 | 105.4 | 99.6772798549302 | 5.72272014506978 |
| 26 | 105.1 | 92.9718845757755 | 12.1281154242245 |
| 27 | 116.6 | 92.1209262015494 | 24.4790737984506 |
| 28 | 112 | 101.693355460824 | 10.3066445391758 |
| 29 | 108.8 | 92.5660224063958 | 16.2339775936042 |
| 30 | 106.9 | 108.047323407510 | -1.14732340750953 |
| 31 | 109.5 | 105.284267237044 | 4.21573276295591 |
| 32 | 106.7 | 111.244104427290 | -4.54410442729023 |
| 33 | 118.9 | 104.976106231264 | 13.9238937687364 |
| 34 | 117.5 | 107.718933329632 | 9.78106667036834 |
| 35 | 113.7 | 110.889340565327 | 2.81065943467342 |
| 36 | 119.6 | 117.561588566621 | 2.03841143337862 |
| 37 | 120.6 | 114.112412987856 | 6.48758701214446 |
| 38 | 117.5 | 124.628837770658 | -7.12883777065846 |
| 39 | 120.3 | 132.940903691071 | -12.6409036910707 |
| 40 | 119.8 | 123.298614327799 | -3.49861432779925 |
| 41 | 108 | 97.6656098252576 | 10.3343901747424 |
| 42 | 98.8 | 82.8828295562603 | 15.9171704437396 |
| 43 | 94.6 | 87.3534000861 | 7.24659991389993 |
| 44 | 84.6 | 90.5592904798884 | -5.9592904798884 |
| 45 | 84.4 | 70.8575832595695 | 13.5424167404305 |
| 46 | 79.1 | 72.8758741673779 | 6.2241258326221 |
| 47 | 73.3 | 66.7038757901134 | 6.59612420988661 |
| 48 | 74.3 | 59.8245310647252 | 14.4754689352748 |
| 49 | 67.8 | 55.7475738330756 | 12.0524261669244 |
| 50 | 64.8 | 55.2307063216614 | 9.56929367833862 |
| 51 | 66.5 | 48.4372201561194 | 18.0627798438806 |
| 52 | 57.7 | 52.5389386037386 | 5.16106139626141 |
| 53 | 53.8 | 50.4602179346836 | 3.33978206531639 |
| 54 | 51.8 | 50.3750122331428 | 1.42498776685721 |
| 55 | 50.9 | 52.7769524460857 | -1.87695244608566 |
| 56 | 49 | 52.2193507720482 | -3.21935077204824 |
| 57 | 48.1 | 48.134848484057 | -0.0348484840569988 |
| 58 | 42.6 | 59.1760402955841 | -16.5760402955841 |
| 59 | 40.9 | 65.2144948502598 | -24.3144948502598 |
| 60 | 43.3 | 54.9575510356737 | -11.6575510356737 |
| 61 | 43.7 | 56.8783395636238 | -13.1783395636238 |
| Goldfeld-Quandt test for Heteroskedasticity | |||
| p-values | Alternative Hypothesis | ||
| breakpoint index | greater | 2-sided | less |
| 7 | 0.0053174920420485 | 0.010634984084097 | 0.994682507957952 |
| 8 | 0.00150109020981988 | 0.00300218041963976 | 0.99849890979018 |
| 9 | 0.0050088476851756 | 0.0100176953703512 | 0.994991152314824 |
| 10 | 0.00140058192420542 | 0.00280116384841084 | 0.998599418075795 |
| 11 | 0.000633519383897079 | 0.00126703876779416 | 0.999366480616103 |
| 12 | 0.000224050896460446 | 0.000448101792920893 | 0.99977594910354 |
| 13 | 8.5561780103095e-05 | 0.00017112356020619 | 0.999914438219897 |
| 14 | 4.15573216643668e-05 | 8.31146433287336e-05 | 0.999958442678336 |
| 15 | 2.89186196098268e-05 | 5.78372392196536e-05 | 0.99997108138039 |
| 16 | 1.47929578640985e-05 | 2.95859157281969e-05 | 0.999985207042136 |
| 17 | 1.28788621370312e-05 | 2.57577242740624e-05 | 0.999987121137863 |
| 18 | 3.49659105217438e-05 | 6.99318210434875e-05 | 0.999965034089478 |
| 19 | 0.000212121797719233 | 0.000424243595438465 | 0.99978787820228 |
| 20 | 0.00274720392698551 | 0.00549440785397101 | 0.997252796073014 |
| 21 | 0.0169085671918246 | 0.0338171343836492 | 0.983091432808175 |
| 22 | 0.0106973229626601 | 0.0213946459253202 | 0.98930267703734 |
| 23 | 0.00628228655533414 | 0.0125645731106683 | 0.993717713444666 |
| 24 | 0.00461909438653162 | 0.00923818877306323 | 0.995380905613468 |
| 25 | 0.0107139624324245 | 0.0214279248648491 | 0.989286037567575 |
| 26 | 0.0143660383847868 | 0.0287320767695735 | 0.985633961615213 |
| 27 | 0.0611034176618914 | 0.122206835323783 | 0.938896582338109 |
| 28 | 0.207487690571553 | 0.414975381143106 | 0.792512309428447 |
| 29 | 0.272824832694333 | 0.545649665388665 | 0.727175167305667 |
| 30 | 0.372528241159759 | 0.745056482319517 | 0.627471758840241 |
| 31 | 0.488483002880721 | 0.976966005761442 | 0.511516997119279 |
| 32 | 0.503075584759317 | 0.993848830481366 | 0.496924415240683 |
| 33 | 0.693899600581178 | 0.612200798837643 | 0.306100399418822 |
| 34 | 0.903057652131056 | 0.193884695737887 | 0.0969423478689436 |
| 35 | 0.949872792092302 | 0.100254415815395 | 0.0501272079076976 |
| 36 | 0.946631043198835 | 0.106737913602329 | 0.0533689568011647 |
| 37 | 0.947252267232371 | 0.105495465535258 | 0.0527477327676289 |
| 38 | 0.93902061500199 | 0.121958769996020 | 0.0609793849980098 |
| 39 | 0.930893452740537 | 0.138213094518925 | 0.0691065472594625 |
| 40 | 0.973270007399793 | 0.0534599852004139 | 0.0267299926002069 |
| 41 | 0.984494676877385 | 0.0310106462452289 | 0.0155053231226145 |
| 42 | 0.99931560549113 | 0.00136878901774008 | 0.000684394508870038 |
| 43 | 0.998965617090373 | 0.00206876581925490 | 0.00103438290962745 |
| 44 | 0.99778723566702 | 0.00442552866596025 | 0.00221276433298013 |
| 45 | 0.996053816507514 | 0.00789236698497185 | 0.00394618349248593 |
| 46 | 0.99878574062184 | 0.00242851875632043 | 0.00121425937816022 |
| 47 | 0.99787045854675 | 0.00425908290650161 | 0.00212954145325081 |
| 48 | 0.994821704053616 | 0.0103565918927676 | 0.00517829594638379 |
| 49 | 0.988298350181829 | 0.0234032996363427 | 0.0117016498181713 |
| 50 | 0.983789388683356 | 0.0324212226332876 | 0.0162106113166438 |
| 51 | 0.976492679396969 | 0.0470146412060616 | 0.0235073206030308 |
| 52 | 0.98923857383121 | 0.0215228523375784 | 0.0107614261687892 |
| 53 | 0.984475148134572 | 0.0310497037308569 | 0.0155248518654284 |
| 54 | 0.960682090022055 | 0.0786358199558895 | 0.0393179099779447 |
| Meta Analysis of Goldfeld-Quandt test for Heteroskedasticity | |||
| Description | # significant tests | % significant tests | OK/NOK |
| 1% type I error level | 19 | 0.395833333333333 | NOK |
| 5% type I error level | 33 | 0.6875 | NOK |
| 10% type I error level | 35 | 0.729166666666667 | NOK |