Free Statistics

of Irreproducible Research!

Author's title

Author*The author of this computation has been verified*
R Software Modulerwasp_autocorrelation.wasp
Title produced by software(Partial) Autocorrelation Function
Date of computationSun, 26 Dec 2010 13:22:00 +0000
Cite this page as followsStatistical Computations at FreeStatistics.org, Office for Research Development and Education, URL https://freestatistics.org/blog/index.php?v=date/2010/Dec/26/t1293369575a9w563go6kj2tu5.htm/, Retrieved Mon, 06 May 2024 18:45:53 +0000
Statistical Computations at FreeStatistics.org, Office for Research Development and Education, URL https://freestatistics.org/blog/index.php?pk=115593, Retrieved Mon, 06 May 2024 18:45:53 +0000
QR Codes:

Original text written by user:
IsPrivate?No (this computation is public)
User-defined keywords
Estimated Impact135
Family? (F = Feedback message, R = changed R code, M = changed R Module, P = changed Parameters, D = changed Data)
-     [Univariate Data Series] [tijdreeks bevolki...] [2010-12-26 10:20:42] [efd13e24149aec704f3383e33c1e842a]
- RMPD    [(Partial) Autocorrelation Function] [tijdreeks werkloo...] [2010-12-26 13:22:00] [531024149246456e4f6d79ace2e85c12] [Current]
Feedback Forum

Post a new message
Dataseries X:
332
369
384
373
378
426
423
397
422
409
430
412
396
470
491
504
484
474
508
492
452
457
457
471
451
476
493
514
522
490
484
506
501
462
465
454
464
427
482
460
473
465
422
415
413
420
363
376
380
384
346
410
389
407
393
346
348
353
364
305
307
312
312
286
344
324
336
327
302
299
311
315
264
278
278
287
279
300
324
354
354
360
363
385
412
370
389
395
417
404
377
456
478
468
437
432
441
449
386
396
394


Summary of computational transaction
Raw Inputview raw input (R code)
Raw Outputview raw output of R engine
Computing time2 seconds
R Server'RServer@AstonUniversity' @ vre.aston.ac.uk

\begin{tabular}{lllllllll}
\hline
Summary of computational transaction \tabularnewline
Raw Input & view raw input (R code)  \tabularnewline
Raw Output & view raw output of R engine  \tabularnewline
Computing time & 2 seconds \tabularnewline
R Server & 'RServer@AstonUniversity' @ vre.aston.ac.uk \tabularnewline
\hline
\end{tabular}
%Source: https://freestatistics.org/blog/index.php?pk=115593&T=0

[TABLE]
[ROW][C]Summary of computational transaction[/C][/ROW]
[ROW][C]Raw Input[/C][C]view raw input (R code) [/C][/ROW]
[ROW][C]Raw Output[/C][C]view raw output of R engine [/C][/ROW]
[ROW][C]Computing time[/C][C]2 seconds[/C][/ROW]
[ROW][C]R Server[/C][C]'RServer@AstonUniversity' @ vre.aston.ac.uk[/C][/ROW]
[/TABLE]
Source: https://freestatistics.org/blog/index.php?pk=115593&T=0

Globally Unique Identifier (entire table): ba.freestatistics.org/blog/index.php?pk=115593&T=0

As an alternative you can also use a QR Code:  

The GUIDs for individual cells are displayed in the table below:

Summary of computational transaction
Raw Inputview raw input (R code)
Raw Outputview raw output of R engine
Computing time2 seconds
R Server'RServer@AstonUniversity' @ vre.aston.ac.uk


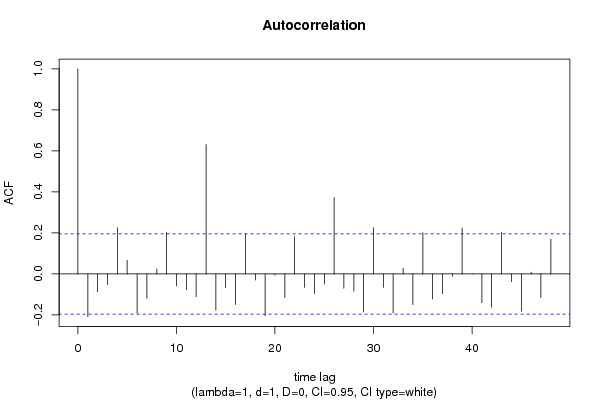
Autocorrelation Function
Time lag kACF(k)T-STATP-value
1-0.208188-2.08190.019953
2-0.086344-0.86340.194982
3-0.051841-0.51840.30266
40.2255222.25520.013149
50.0655770.65580.256738
6-0.191458-1.91460.029202
7-0.119321-1.19320.117804
80.0242710.24270.404364
90.2024012.0240.022818
10-0.058732-0.58730.279155
11-0.07692-0.76920.221794
12-0.111683-1.11680.133371
130.6310996.3110
14-0.176493-1.76490.040314
15-0.066519-0.66520.25373
16-0.149097-1.4910.069558
170.196461.96460.026118
18-0.029919-0.29920.382708
19-0.203577-2.03580.022209
20-0.005846-0.05850.476751
21-0.115216-1.15220.126001
220.1820721.82070.03582
23-0.065388-0.65390.257345
24-0.095499-0.9550.170942
25-0.049451-0.49450.311015
260.3725693.72570.000161
27-0.069406-0.69410.244628
28-0.084606-0.84610.199769
29-0.18583-1.85830.033034
300.2252052.25210.013253
31-0.064643-0.64640.25974
32-0.190156-1.90160.030054
330.0277090.27710.391141
34-0.149176-1.49180.069456
350.2015872.01590.023248
36-0.121625-1.21630.113375
37-0.09595-0.95950.169811
38-0.010815-0.10820.457046
390.2246182.24620.013446
40-0.000496-0.0050.498026
41-0.139881-1.39880.082483
42-0.161947-1.61950.054248
430.2036392.03640.022177
44-0.037397-0.3740.354611
45-0.182316-1.82320.035633
460.008430.08430.466492
47-0.115077-1.15080.126285
480.1695671.69570.04653

\begin{tabular}{lllllllll}
\hline
Autocorrelation Function \tabularnewline
Time lag k & ACF(k) & T-STAT & P-value \tabularnewline
1 & -0.208188 & -2.0819 & 0.019953 \tabularnewline
2 & -0.086344 & -0.8634 & 0.194982 \tabularnewline
3 & -0.051841 & -0.5184 & 0.30266 \tabularnewline
4 & 0.225522 & 2.2552 & 0.013149 \tabularnewline
5 & 0.065577 & 0.6558 & 0.256738 \tabularnewline
6 & -0.191458 & -1.9146 & 0.029202 \tabularnewline
7 & -0.119321 & -1.1932 & 0.117804 \tabularnewline
8 & 0.024271 & 0.2427 & 0.404364 \tabularnewline
9 & 0.202401 & 2.024 & 0.022818 \tabularnewline
10 & -0.058732 & -0.5873 & 0.279155 \tabularnewline
11 & -0.07692 & -0.7692 & 0.221794 \tabularnewline
12 & -0.111683 & -1.1168 & 0.133371 \tabularnewline
13 & 0.631099 & 6.311 & 0 \tabularnewline
14 & -0.176493 & -1.7649 & 0.040314 \tabularnewline
15 & -0.066519 & -0.6652 & 0.25373 \tabularnewline
16 & -0.149097 & -1.491 & 0.069558 \tabularnewline
17 & 0.19646 & 1.9646 & 0.026118 \tabularnewline
18 & -0.029919 & -0.2992 & 0.382708 \tabularnewline
19 & -0.203577 & -2.0358 & 0.022209 \tabularnewline
20 & -0.005846 & -0.0585 & 0.476751 \tabularnewline
21 & -0.115216 & -1.1522 & 0.126001 \tabularnewline
22 & 0.182072 & 1.8207 & 0.03582 \tabularnewline
23 & -0.065388 & -0.6539 & 0.257345 \tabularnewline
24 & -0.095499 & -0.955 & 0.170942 \tabularnewline
25 & -0.049451 & -0.4945 & 0.311015 \tabularnewline
26 & 0.372569 & 3.7257 & 0.000161 \tabularnewline
27 & -0.069406 & -0.6941 & 0.244628 \tabularnewline
28 & -0.084606 & -0.8461 & 0.199769 \tabularnewline
29 & -0.18583 & -1.8583 & 0.033034 \tabularnewline
30 & 0.225205 & 2.2521 & 0.013253 \tabularnewline
31 & -0.064643 & -0.6464 & 0.25974 \tabularnewline
32 & -0.190156 & -1.9016 & 0.030054 \tabularnewline
33 & 0.027709 & 0.2771 & 0.391141 \tabularnewline
34 & -0.149176 & -1.4918 & 0.069456 \tabularnewline
35 & 0.201587 & 2.0159 & 0.023248 \tabularnewline
36 & -0.121625 & -1.2163 & 0.113375 \tabularnewline
37 & -0.09595 & -0.9595 & 0.169811 \tabularnewline
38 & -0.010815 & -0.1082 & 0.457046 \tabularnewline
39 & 0.224618 & 2.2462 & 0.013446 \tabularnewline
40 & -0.000496 & -0.005 & 0.498026 \tabularnewline
41 & -0.139881 & -1.3988 & 0.082483 \tabularnewline
42 & -0.161947 & -1.6195 & 0.054248 \tabularnewline
43 & 0.203639 & 2.0364 & 0.022177 \tabularnewline
44 & -0.037397 & -0.374 & 0.354611 \tabularnewline
45 & -0.182316 & -1.8232 & 0.035633 \tabularnewline
46 & 0.00843 & 0.0843 & 0.466492 \tabularnewline
47 & -0.115077 & -1.1508 & 0.126285 \tabularnewline
48 & 0.169567 & 1.6957 & 0.04653 \tabularnewline
\hline
\end{tabular}
%Source: https://freestatistics.org/blog/index.php?pk=115593&T=1

[TABLE]
[ROW][C]Autocorrelation Function[/C][/ROW]
[ROW][C]Time lag k[/C][C]ACF(k)[/C][C]T-STAT[/C][C]P-value[/C][/ROW]
[ROW][C]1[/C][C]-0.208188[/C][C]-2.0819[/C][C]0.019953[/C][/ROW]
[ROW][C]2[/C][C]-0.086344[/C][C]-0.8634[/C][C]0.194982[/C][/ROW]
[ROW][C]3[/C][C]-0.051841[/C][C]-0.5184[/C][C]0.30266[/C][/ROW]
[ROW][C]4[/C][C]0.225522[/C][C]2.2552[/C][C]0.013149[/C][/ROW]
[ROW][C]5[/C][C]0.065577[/C][C]0.6558[/C][C]0.256738[/C][/ROW]
[ROW][C]6[/C][C]-0.191458[/C][C]-1.9146[/C][C]0.029202[/C][/ROW]
[ROW][C]7[/C][C]-0.119321[/C][C]-1.1932[/C][C]0.117804[/C][/ROW]
[ROW][C]8[/C][C]0.024271[/C][C]0.2427[/C][C]0.404364[/C][/ROW]
[ROW][C]9[/C][C]0.202401[/C][C]2.024[/C][C]0.022818[/C][/ROW]
[ROW][C]10[/C][C]-0.058732[/C][C]-0.5873[/C][C]0.279155[/C][/ROW]
[ROW][C]11[/C][C]-0.07692[/C][C]-0.7692[/C][C]0.221794[/C][/ROW]
[ROW][C]12[/C][C]-0.111683[/C][C]-1.1168[/C][C]0.133371[/C][/ROW]
[ROW][C]13[/C][C]0.631099[/C][C]6.311[/C][C]0[/C][/ROW]
[ROW][C]14[/C][C]-0.176493[/C][C]-1.7649[/C][C]0.040314[/C][/ROW]
[ROW][C]15[/C][C]-0.066519[/C][C]-0.6652[/C][C]0.25373[/C][/ROW]
[ROW][C]16[/C][C]-0.149097[/C][C]-1.491[/C][C]0.069558[/C][/ROW]
[ROW][C]17[/C][C]0.19646[/C][C]1.9646[/C][C]0.026118[/C][/ROW]
[ROW][C]18[/C][C]-0.029919[/C][C]-0.2992[/C][C]0.382708[/C][/ROW]
[ROW][C]19[/C][C]-0.203577[/C][C]-2.0358[/C][C]0.022209[/C][/ROW]
[ROW][C]20[/C][C]-0.005846[/C][C]-0.0585[/C][C]0.476751[/C][/ROW]
[ROW][C]21[/C][C]-0.115216[/C][C]-1.1522[/C][C]0.126001[/C][/ROW]
[ROW][C]22[/C][C]0.182072[/C][C]1.8207[/C][C]0.03582[/C][/ROW]
[ROW][C]23[/C][C]-0.065388[/C][C]-0.6539[/C][C]0.257345[/C][/ROW]
[ROW][C]24[/C][C]-0.095499[/C][C]-0.955[/C][C]0.170942[/C][/ROW]
[ROW][C]25[/C][C]-0.049451[/C][C]-0.4945[/C][C]0.311015[/C][/ROW]
[ROW][C]26[/C][C]0.372569[/C][C]3.7257[/C][C]0.000161[/C][/ROW]
[ROW][C]27[/C][C]-0.069406[/C][C]-0.6941[/C][C]0.244628[/C][/ROW]
[ROW][C]28[/C][C]-0.084606[/C][C]-0.8461[/C][C]0.199769[/C][/ROW]
[ROW][C]29[/C][C]-0.18583[/C][C]-1.8583[/C][C]0.033034[/C][/ROW]
[ROW][C]30[/C][C]0.225205[/C][C]2.2521[/C][C]0.013253[/C][/ROW]
[ROW][C]31[/C][C]-0.064643[/C][C]-0.6464[/C][C]0.25974[/C][/ROW]
[ROW][C]32[/C][C]-0.190156[/C][C]-1.9016[/C][C]0.030054[/C][/ROW]
[ROW][C]33[/C][C]0.027709[/C][C]0.2771[/C][C]0.391141[/C][/ROW]
[ROW][C]34[/C][C]-0.149176[/C][C]-1.4918[/C][C]0.069456[/C][/ROW]
[ROW][C]35[/C][C]0.201587[/C][C]2.0159[/C][C]0.023248[/C][/ROW]
[ROW][C]36[/C][C]-0.121625[/C][C]-1.2163[/C][C]0.113375[/C][/ROW]
[ROW][C]37[/C][C]-0.09595[/C][C]-0.9595[/C][C]0.169811[/C][/ROW]
[ROW][C]38[/C][C]-0.010815[/C][C]-0.1082[/C][C]0.457046[/C][/ROW]
[ROW][C]39[/C][C]0.224618[/C][C]2.2462[/C][C]0.013446[/C][/ROW]
[ROW][C]40[/C][C]-0.000496[/C][C]-0.005[/C][C]0.498026[/C][/ROW]
[ROW][C]41[/C][C]-0.139881[/C][C]-1.3988[/C][C]0.082483[/C][/ROW]
[ROW][C]42[/C][C]-0.161947[/C][C]-1.6195[/C][C]0.054248[/C][/ROW]
[ROW][C]43[/C][C]0.203639[/C][C]2.0364[/C][C]0.022177[/C][/ROW]
[ROW][C]44[/C][C]-0.037397[/C][C]-0.374[/C][C]0.354611[/C][/ROW]
[ROW][C]45[/C][C]-0.182316[/C][C]-1.8232[/C][C]0.035633[/C][/ROW]
[ROW][C]46[/C][C]0.00843[/C][C]0.0843[/C][C]0.466492[/C][/ROW]
[ROW][C]47[/C][C]-0.115077[/C][C]-1.1508[/C][C]0.126285[/C][/ROW]
[ROW][C]48[/C][C]0.169567[/C][C]1.6957[/C][C]0.04653[/C][/ROW]
[/TABLE]
Source: https://freestatistics.org/blog/index.php?pk=115593&T=1

Globally Unique Identifier (entire table): ba.freestatistics.org/blog/index.php?pk=115593&T=1

As an alternative you can also use a QR Code:  

The GUIDs for individual cells are displayed in the table below:

Autocorrelation Function
Time lag kACF(k)T-STATP-value
1-0.208188-2.08190.019953
2-0.086344-0.86340.194982
3-0.051841-0.51840.30266
40.2255222.25520.013149
50.0655770.65580.256738
6-0.191458-1.91460.029202
7-0.119321-1.19320.117804
80.0242710.24270.404364
90.2024012.0240.022818
10-0.058732-0.58730.279155
11-0.07692-0.76920.221794
12-0.111683-1.11680.133371
130.6310996.3110
14-0.176493-1.76490.040314
15-0.066519-0.66520.25373
16-0.149097-1.4910.069558
170.196461.96460.026118
18-0.029919-0.29920.382708
19-0.203577-2.03580.022209
20-0.005846-0.05850.476751
21-0.115216-1.15220.126001
220.1820721.82070.03582
23-0.065388-0.65390.257345
24-0.095499-0.9550.170942
25-0.049451-0.49450.311015
260.3725693.72570.000161
27-0.069406-0.69410.244628
28-0.084606-0.84610.199769
29-0.18583-1.85830.033034
300.2252052.25210.013253
31-0.064643-0.64640.25974
32-0.190156-1.90160.030054
330.0277090.27710.391141
34-0.149176-1.49180.069456
350.2015872.01590.023248
36-0.121625-1.21630.113375
37-0.09595-0.95950.169811
38-0.010815-0.10820.457046
390.2246182.24620.013446
40-0.000496-0.0050.498026
41-0.139881-1.39880.082483
42-0.161947-1.61950.054248
430.2036392.03640.022177
44-0.037397-0.3740.354611
45-0.182316-1.82320.035633
460.008430.08430.466492
47-0.115077-1.15080.126285
480.1695671.69570.04653


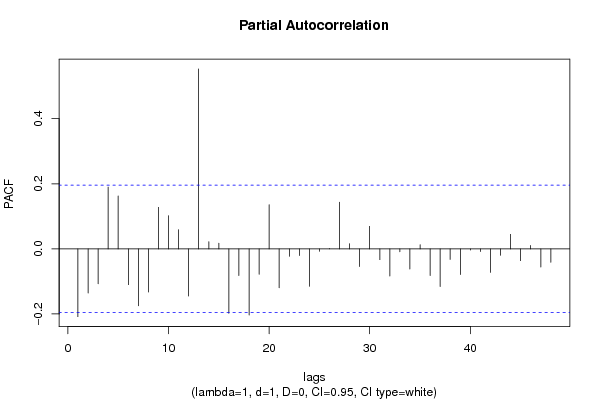
Partial Autocorrelation Function
Time lag kPACF(k)T-STATP-value
1-0.208188-2.08190.019953
2-0.135562-1.35560.089138
3-0.106994-1.06990.143611
40.1899671.89970.030179
50.1623241.62320.053843
6-0.109787-1.09790.137449
7-0.174671-1.74670.041879
8-0.132653-1.32650.093842
90.1276391.27640.102387
100.1019481.01950.155219
110.0589820.58980.278321
12-0.145024-1.45020.075061
130.5528945.52890
140.0218510.21850.41374
150.0175730.17570.430433
16-0.197602-1.9760.025454
17-0.081974-0.81970.207157
18-0.203294-2.03290.022354
19-0.07795-0.77950.218764
200.1354751.35480.089275
21-0.119419-1.19420.117614
22-0.02244-0.22440.411451
23-0.020344-0.20340.419601
24-0.114771-1.14770.126913
25-0.007381-0.07380.470654
260.0004710.00470.498127
270.1435921.43590.077073
280.0157090.15710.437745
29-0.05401-0.54010.295165
300.0692490.69250.245117
31-0.033019-0.33020.370972
32-0.083437-0.83440.203031
33-0.008909-0.08910.464595
34-0.061611-0.61610.269611
350.0125820.12580.450062
36-0.082114-0.82110.206759
37-0.115622-1.15620.125174
38-0.032233-0.32230.373936
39-0.079035-0.79040.215596
40-0.003563-0.03560.485826
41-0.007923-0.07920.468506
42-0.072288-0.72290.235722
43-0.019468-0.19470.423019
440.0447530.44750.327732
45-0.036175-0.36170.359152
460.0104190.10420.458615
47-0.05573-0.55730.289283
48-0.041193-0.41190.340635

\begin{tabular}{lllllllll}
\hline
Partial Autocorrelation Function \tabularnewline
Time lag k & PACF(k) & T-STAT & P-value \tabularnewline
1 & -0.208188 & -2.0819 & 0.019953 \tabularnewline
2 & -0.135562 & -1.3556 & 0.089138 \tabularnewline
3 & -0.106994 & -1.0699 & 0.143611 \tabularnewline
4 & 0.189967 & 1.8997 & 0.030179 \tabularnewline
5 & 0.162324 & 1.6232 & 0.053843 \tabularnewline
6 & -0.109787 & -1.0979 & 0.137449 \tabularnewline
7 & -0.174671 & -1.7467 & 0.041879 \tabularnewline
8 & -0.132653 & -1.3265 & 0.093842 \tabularnewline
9 & 0.127639 & 1.2764 & 0.102387 \tabularnewline
10 & 0.101948 & 1.0195 & 0.155219 \tabularnewline
11 & 0.058982 & 0.5898 & 0.278321 \tabularnewline
12 & -0.145024 & -1.4502 & 0.075061 \tabularnewline
13 & 0.552894 & 5.5289 & 0 \tabularnewline
14 & 0.021851 & 0.2185 & 0.41374 \tabularnewline
15 & 0.017573 & 0.1757 & 0.430433 \tabularnewline
16 & -0.197602 & -1.976 & 0.025454 \tabularnewline
17 & -0.081974 & -0.8197 & 0.207157 \tabularnewline
18 & -0.203294 & -2.0329 & 0.022354 \tabularnewline
19 & -0.07795 & -0.7795 & 0.218764 \tabularnewline
20 & 0.135475 & 1.3548 & 0.089275 \tabularnewline
21 & -0.119419 & -1.1942 & 0.117614 \tabularnewline
22 & -0.02244 & -0.2244 & 0.411451 \tabularnewline
23 & -0.020344 & -0.2034 & 0.419601 \tabularnewline
24 & -0.114771 & -1.1477 & 0.126913 \tabularnewline
25 & -0.007381 & -0.0738 & 0.470654 \tabularnewline
26 & 0.000471 & 0.0047 & 0.498127 \tabularnewline
27 & 0.143592 & 1.4359 & 0.077073 \tabularnewline
28 & 0.015709 & 0.1571 & 0.437745 \tabularnewline
29 & -0.05401 & -0.5401 & 0.295165 \tabularnewline
30 & 0.069249 & 0.6925 & 0.245117 \tabularnewline
31 & -0.033019 & -0.3302 & 0.370972 \tabularnewline
32 & -0.083437 & -0.8344 & 0.203031 \tabularnewline
33 & -0.008909 & -0.0891 & 0.464595 \tabularnewline
34 & -0.061611 & -0.6161 & 0.269611 \tabularnewline
35 & 0.012582 & 0.1258 & 0.450062 \tabularnewline
36 & -0.082114 & -0.8211 & 0.206759 \tabularnewline
37 & -0.115622 & -1.1562 & 0.125174 \tabularnewline
38 & -0.032233 & -0.3223 & 0.373936 \tabularnewline
39 & -0.079035 & -0.7904 & 0.215596 \tabularnewline
40 & -0.003563 & -0.0356 & 0.485826 \tabularnewline
41 & -0.007923 & -0.0792 & 0.468506 \tabularnewline
42 & -0.072288 & -0.7229 & 0.235722 \tabularnewline
43 & -0.019468 & -0.1947 & 0.423019 \tabularnewline
44 & 0.044753 & 0.4475 & 0.327732 \tabularnewline
45 & -0.036175 & -0.3617 & 0.359152 \tabularnewline
46 & 0.010419 & 0.1042 & 0.458615 \tabularnewline
47 & -0.05573 & -0.5573 & 0.289283 \tabularnewline
48 & -0.041193 & -0.4119 & 0.340635 \tabularnewline
\hline
\end{tabular}
%Source: https://freestatistics.org/blog/index.php?pk=115593&T=2

[TABLE]
[ROW][C]Partial Autocorrelation Function[/C][/ROW]
[ROW][C]Time lag k[/C][C]PACF(k)[/C][C]T-STAT[/C][C]P-value[/C][/ROW]
[ROW][C]1[/C][C]-0.208188[/C][C]-2.0819[/C][C]0.019953[/C][/ROW]
[ROW][C]2[/C][C]-0.135562[/C][C]-1.3556[/C][C]0.089138[/C][/ROW]
[ROW][C]3[/C][C]-0.106994[/C][C]-1.0699[/C][C]0.143611[/C][/ROW]
[ROW][C]4[/C][C]0.189967[/C][C]1.8997[/C][C]0.030179[/C][/ROW]
[ROW][C]5[/C][C]0.162324[/C][C]1.6232[/C][C]0.053843[/C][/ROW]
[ROW][C]6[/C][C]-0.109787[/C][C]-1.0979[/C][C]0.137449[/C][/ROW]
[ROW][C]7[/C][C]-0.174671[/C][C]-1.7467[/C][C]0.041879[/C][/ROW]
[ROW][C]8[/C][C]-0.132653[/C][C]-1.3265[/C][C]0.093842[/C][/ROW]
[ROW][C]9[/C][C]0.127639[/C][C]1.2764[/C][C]0.102387[/C][/ROW]
[ROW][C]10[/C][C]0.101948[/C][C]1.0195[/C][C]0.155219[/C][/ROW]
[ROW][C]11[/C][C]0.058982[/C][C]0.5898[/C][C]0.278321[/C][/ROW]
[ROW][C]12[/C][C]-0.145024[/C][C]-1.4502[/C][C]0.075061[/C][/ROW]
[ROW][C]13[/C][C]0.552894[/C][C]5.5289[/C][C]0[/C][/ROW]
[ROW][C]14[/C][C]0.021851[/C][C]0.2185[/C][C]0.41374[/C][/ROW]
[ROW][C]15[/C][C]0.017573[/C][C]0.1757[/C][C]0.430433[/C][/ROW]
[ROW][C]16[/C][C]-0.197602[/C][C]-1.976[/C][C]0.025454[/C][/ROW]
[ROW][C]17[/C][C]-0.081974[/C][C]-0.8197[/C][C]0.207157[/C][/ROW]
[ROW][C]18[/C][C]-0.203294[/C][C]-2.0329[/C][C]0.022354[/C][/ROW]
[ROW][C]19[/C][C]-0.07795[/C][C]-0.7795[/C][C]0.218764[/C][/ROW]
[ROW][C]20[/C][C]0.135475[/C][C]1.3548[/C][C]0.089275[/C][/ROW]
[ROW][C]21[/C][C]-0.119419[/C][C]-1.1942[/C][C]0.117614[/C][/ROW]
[ROW][C]22[/C][C]-0.02244[/C][C]-0.2244[/C][C]0.411451[/C][/ROW]
[ROW][C]23[/C][C]-0.020344[/C][C]-0.2034[/C][C]0.419601[/C][/ROW]
[ROW][C]24[/C][C]-0.114771[/C][C]-1.1477[/C][C]0.126913[/C][/ROW]
[ROW][C]25[/C][C]-0.007381[/C][C]-0.0738[/C][C]0.470654[/C][/ROW]
[ROW][C]26[/C][C]0.000471[/C][C]0.0047[/C][C]0.498127[/C][/ROW]
[ROW][C]27[/C][C]0.143592[/C][C]1.4359[/C][C]0.077073[/C][/ROW]
[ROW][C]28[/C][C]0.015709[/C][C]0.1571[/C][C]0.437745[/C][/ROW]
[ROW][C]29[/C][C]-0.05401[/C][C]-0.5401[/C][C]0.295165[/C][/ROW]
[ROW][C]30[/C][C]0.069249[/C][C]0.6925[/C][C]0.245117[/C][/ROW]
[ROW][C]31[/C][C]-0.033019[/C][C]-0.3302[/C][C]0.370972[/C][/ROW]
[ROW][C]32[/C][C]-0.083437[/C][C]-0.8344[/C][C]0.203031[/C][/ROW]
[ROW][C]33[/C][C]-0.008909[/C][C]-0.0891[/C][C]0.464595[/C][/ROW]
[ROW][C]34[/C][C]-0.061611[/C][C]-0.6161[/C][C]0.269611[/C][/ROW]
[ROW][C]35[/C][C]0.012582[/C][C]0.1258[/C][C]0.450062[/C][/ROW]
[ROW][C]36[/C][C]-0.082114[/C][C]-0.8211[/C][C]0.206759[/C][/ROW]
[ROW][C]37[/C][C]-0.115622[/C][C]-1.1562[/C][C]0.125174[/C][/ROW]
[ROW][C]38[/C][C]-0.032233[/C][C]-0.3223[/C][C]0.373936[/C][/ROW]
[ROW][C]39[/C][C]-0.079035[/C][C]-0.7904[/C][C]0.215596[/C][/ROW]
[ROW][C]40[/C][C]-0.003563[/C][C]-0.0356[/C][C]0.485826[/C][/ROW]
[ROW][C]41[/C][C]-0.007923[/C][C]-0.0792[/C][C]0.468506[/C][/ROW]
[ROW][C]42[/C][C]-0.072288[/C][C]-0.7229[/C][C]0.235722[/C][/ROW]
[ROW][C]43[/C][C]-0.019468[/C][C]-0.1947[/C][C]0.423019[/C][/ROW]
[ROW][C]44[/C][C]0.044753[/C][C]0.4475[/C][C]0.327732[/C][/ROW]
[ROW][C]45[/C][C]-0.036175[/C][C]-0.3617[/C][C]0.359152[/C][/ROW]
[ROW][C]46[/C][C]0.010419[/C][C]0.1042[/C][C]0.458615[/C][/ROW]
[ROW][C]47[/C][C]-0.05573[/C][C]-0.5573[/C][C]0.289283[/C][/ROW]
[ROW][C]48[/C][C]-0.041193[/C][C]-0.4119[/C][C]0.340635[/C][/ROW]
[/TABLE]
Source: https://freestatistics.org/blog/index.php?pk=115593&T=2

Globally Unique Identifier (entire table): ba.freestatistics.org/blog/index.php?pk=115593&T=2

As an alternative you can also use a QR Code:  

The GUIDs for individual cells are displayed in the table below:

Partial Autocorrelation Function
Time lag kPACF(k)T-STATP-value
1-0.208188-2.08190.019953
2-0.135562-1.35560.089138
3-0.106994-1.06990.143611
40.1899671.89970.030179
50.1623241.62320.053843
6-0.109787-1.09790.137449
7-0.174671-1.74670.041879
8-0.132653-1.32650.093842
90.1276391.27640.102387
100.1019481.01950.155219
110.0589820.58980.278321
12-0.145024-1.45020.075061
130.5528945.52890
140.0218510.21850.41374
150.0175730.17570.430433
16-0.197602-1.9760.025454
17-0.081974-0.81970.207157
18-0.203294-2.03290.022354
19-0.07795-0.77950.218764
200.1354751.35480.089275
21-0.119419-1.19420.117614
22-0.02244-0.22440.411451
23-0.020344-0.20340.419601
24-0.114771-1.14770.126913
25-0.007381-0.07380.470654
260.0004710.00470.498127
270.1435921.43590.077073
280.0157090.15710.437745
29-0.05401-0.54010.295165
300.0692490.69250.245117
31-0.033019-0.33020.370972
32-0.083437-0.83440.203031
33-0.008909-0.08910.464595
34-0.061611-0.61610.269611
350.0125820.12580.450062
36-0.082114-0.82110.206759
37-0.115622-1.15620.125174
38-0.032233-0.32230.373936
39-0.079035-0.79040.215596
40-0.003563-0.03560.485826
41-0.007923-0.07920.468506
42-0.072288-0.72290.235722
43-0.019468-0.19470.423019
440.0447530.44750.327732
45-0.036175-0.36170.359152
460.0104190.10420.458615
47-0.05573-0.55730.289283
48-0.041193-0.41190.340635


Parameters (Session):
par1 = 48 ; par2 = 1 ; par3 = 1 ; par4 = 0 ; par5 = 12 ; par6 = White Noise ; par7 = 0.95 ;
Parameters (R input):
par1 = 48 ; par2 = 1 ; par3 = 1 ; par4 = 0 ; par5 = 12 ; par6 = White Noise ; par7 = 0.95 ; par8 = ;
R code (references can be found in the software module):
if (par1 == 'Default') {
par1 = 10*log10(length(x))
} else {
par1 <- as.numeric(par1)
}
par2 <- as.numeric(par2)
par3 <- as.numeric(par3)
par4 <- as.numeric(par4)
par5 <- as.numeric(par5)
if (par6 == 'White Noise') par6 <- 'white' else par6 <- 'ma'
par7 <- as.numeric(par7)
if (par8 != '') par8 <- as.numeric(par8)
ox <- x
if (par8 == '') {
if (par2 == 0) {
x <- log(x)
} else {
x <- (x ^ par2 - 1) / par2
}
} else {
x <- log(x,base=par8)
}
if (par3 > 0) x <- diff(x,lag=1,difference=par3)
if (par4 > 0) x <- diff(x,lag=par5,difference=par4)
bitmap(file='picts.png')
op <- par(mfrow=c(2,1))
plot(ox,type='l',main='Original Time Series',xlab='time',ylab='value')
if (par8=='') {
mytitle <- paste('Working Time Series (lambda=',par2,', d=',par3,', D=',par4,')',sep='')
mysub <- paste('(lambda=',par2,', d=',par3,', D=',par4,', CI=', par7, ', CI type=',par6,')',sep='')
} else {
mytitle <- paste('Working Time Series (base=',par8,', d=',par3,', D=',par4,')',sep='')
mysub <- paste('(base=',par8,', d=',par3,', D=',par4,', CI=', par7, ', CI type=',par6,')',sep='')
}
plot(x,type='l', main=mytitle,xlab='time',ylab='value')
par(op)
dev.off()
bitmap(file='pic1.png')
racf <- acf(x, par1, main='Autocorrelation', xlab='time lag', ylab='ACF', ci.type=par6, ci=par7, sub=mysub)
dev.off()
bitmap(file='pic2.png')
rpacf <- pacf(x,par1,main='Partial Autocorrelation',xlab='lags',ylab='PACF',sub=mysub)
dev.off()
(myacf <- c(racf$acf))
(mypacf <- c(rpacf$acf))
lengthx <- length(x)
sqrtn <- sqrt(lengthx)
load(file='createtable')
a<-table.start()
a<-table.row.start(a)
a<-table.element(a,'Autocorrelation Function',4,TRUE)
a<-table.row.end(a)
a<-table.row.start(a)
a<-table.element(a,'Time lag k',header=TRUE)
a<-table.element(a,hyperlink('basics.htm','ACF(k)','click here for more information about the Autocorrelation Function'),header=TRUE)
a<-table.element(a,'T-STAT',header=TRUE)
a<-table.element(a,'P-value',header=TRUE)
a<-table.row.end(a)
for (i in 2:(par1+1)) {
a<-table.row.start(a)
a<-table.element(a,i-1,header=TRUE)
a<-table.element(a,round(myacf[i],6))
mytstat <- myacf[i]*sqrtn
a<-table.element(a,round(mytstat,4))
a<-table.element(a,round(1-pt(abs(mytstat),lengthx),6))
a<-table.row.end(a)
}
a<-table.end(a)
table.save(a,file='mytable.tab')
a<-table.start()
a<-table.row.start(a)
a<-table.element(a,'Partial Autocorrelation Function',4,TRUE)
a<-table.row.end(a)
a<-table.row.start(a)
a<-table.element(a,'Time lag k',header=TRUE)
a<-table.element(a,hyperlink('basics.htm','PACF(k)','click here for more information about the Partial Autocorrelation Function'),header=TRUE)
a<-table.element(a,'T-STAT',header=TRUE)
a<-table.element(a,'P-value',header=TRUE)
a<-table.row.end(a)
for (i in 1:par1) {
a<-table.row.start(a)
a<-table.element(a,i,header=TRUE)
a<-table.element(a,round(mypacf[i],6))
mytstat <- mypacf[i]*sqrtn
a<-table.element(a,round(mytstat,4))
a<-table.element(a,round(1-pt(abs(mytstat),lengthx),6))
a<-table.row.end(a)
}
a<-table.end(a)
table.save(a,file='mytable1.tab')