Free Statistics

of Irreproducible Research!

Author's title

Author*The author of this computation has been verified*
R Software Modulerwasp_autocorrelation.wasp
Title produced by software(Partial) Autocorrelation Function
Date of computationSun, 26 Dec 2010 11:47:47 +0000
Cite this page as followsStatistical Computations at FreeStatistics.org, Office for Research Development and Education, URL https://freestatistics.org/blog/index.php?v=date/2010/Dec/26/t12933639508e8dzsoc7ec3o0q.htm/, Retrieved Tue, 07 May 2024 02:21:05 +0000
Statistical Computations at FreeStatistics.org, Office for Research Development and Education, URL https://freestatistics.org/blog/index.php?pk=115551, Retrieved Tue, 07 May 2024 02:21:05 +0000
QR Codes:

Original text written by user:
IsPrivate?No (this computation is public)
User-defined keywords
Estimated Impact109
Family? (F = Feedback message, R = changed R code, M = changed R Module, P = changed Parameters, D = changed Data)
-       [(Partial) Autocorrelation Function] [] [2010-12-26 11:47:47] [1e640daebbc6b5a89eef23229b5a56d5] [Current]
Feedback Forum

Post a new message
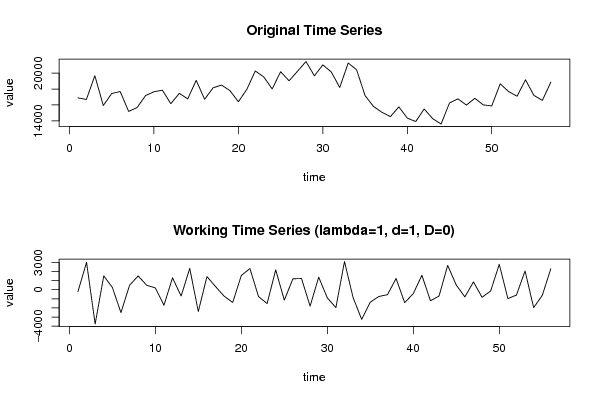
Dataseries X:
16896.2
16698
19691.6
15930.7
17444.6
17699.4
15189.8
15672.7
17180.8
17664.9
17862.9
16162.3
17463.6
16772.1
19106.9
16721.3
18161.3
18509.9
17802.7
16409.9
17967.7
20286.6
19537.3
18021.9
20194.3
19049.6
20244.7
21473.3
19673.6
21053.2
20159.5
18203.6
21289.5
20432.3
17180.4
15816.8
15076.6
14531.6
15761.3
14345.5
13916.8
15496.8
14285.6
13597.3
16263.1
16773.3
15986.9
16842.6
16014.6
15878.6
18664.9
17690.5
17107.6
19165.7
17203.6
16579
18885.1


Summary of computational transaction
Raw Inputview raw input (R code)
Raw Outputview raw output of R engine
Computing time2 seconds
R Server'RServer@AstonUniversity' @ vre.aston.ac.uk

\begin{tabular}{lllllllll}
\hline
Summary of computational transaction \tabularnewline
Raw Input & view raw input (R code)  \tabularnewline
Raw Output & view raw output of R engine  \tabularnewline
Computing time & 2 seconds \tabularnewline
R Server & 'RServer@AstonUniversity' @ vre.aston.ac.uk \tabularnewline
\hline
\end{tabular}
%Source: https://freestatistics.org/blog/index.php?pk=115551&T=0

[TABLE]
[ROW][C]Summary of computational transaction[/C][/ROW]
[ROW][C]Raw Input[/C][C]view raw input (R code) [/C][/ROW]
[ROW][C]Raw Output[/C][C]view raw output of R engine [/C][/ROW]
[ROW][C]Computing time[/C][C]2 seconds[/C][/ROW]
[ROW][C]R Server[/C][C]'RServer@AstonUniversity' @ vre.aston.ac.uk[/C][/ROW]
[/TABLE]
Source: https://freestatistics.org/blog/index.php?pk=115551&T=0

Globally Unique Identifier (entire table): ba.freestatistics.org/blog/index.php?pk=115551&T=0

As an alternative you can also use a QR Code:  

The GUIDs for individual cells are displayed in the table below:

Summary of computational transaction
Raw Inputview raw input (R code)
Raw Outputview raw output of R engine
Computing time2 seconds
R Server'RServer@AstonUniversity' @ vre.aston.ac.uk


Autocorrelation Function
Time lag kACF(k)T-STATP-value
1-0.356656-2.6690.004968
2-0.207845-1.55540.062746
30.3084932.30850.012342
4-0.144663-1.08260.141822
5-0.043731-0.32730.372349
60.2564871.91940.030019
7-0.201225-1.50580.068865
80.0735880.55070.29202
90.0635980.47590.317991
10-0.232247-1.7380.043856
11-0.15396-1.15210.127081
120.462023.45740.000524
13-0.21688-1.6230.055105
14-0.144463-1.08110.142152
150.0835170.6250.267259
16-0.059798-0.44750.328124
17-0.018946-0.14180.443881
180.0624340.46720.32108
19-0.075827-0.56740.286342
200.1199090.89730.186695
21-0.065066-0.48690.314112
22-0.128275-0.95990.170611
23-0.020927-0.15660.438059
240.2048761.53320.065435
25-0.032081-0.24010.405575
26-0.142709-1.06790.145066
270.0371480.2780.391022
280.033910.25380.400305
29-0.024027-0.17980.428978
300.0671520.50250.308635
310.0052040.03890.484537
320.0017380.0130.494834
330.0163970.12270.451389
34-0.049908-0.37350.355102
35-0.085124-0.6370.263356
360.1860091.3920.084719
370.0040520.03030.48796
38-0.153795-1.15090.127333
390.079360.59390.277494
400.0265190.19850.421705
41-0.100204-0.74990.228239
420.0698860.5230.301527
430.0413340.30930.379115
44-0.07217-0.54010.295645
450.0442060.33080.371013
460.0091490.06850.47283
47-0.123561-0.92460.179559
480.1323080.99010.163191
490.0266690.19960.421268
50-0.122058-0.91340.182475
510.0889990.6660.25407
52-0.00349-0.02610.489628
53-0.067966-0.50860.306511
540.0462090.34580.365395
55-0.003569-0.02670.489394
56NANANA
57NANANA
58NANANA
59NANANA
60NANANA

\begin{tabular}{lllllllll}
\hline
Autocorrelation Function \tabularnewline
Time lag k & ACF(k) & T-STAT & P-value \tabularnewline
1 & -0.356656 & -2.669 & 0.004968 \tabularnewline
2 & -0.207845 & -1.5554 & 0.062746 \tabularnewline
3 & 0.308493 & 2.3085 & 0.012342 \tabularnewline
4 & -0.144663 & -1.0826 & 0.141822 \tabularnewline
5 & -0.043731 & -0.3273 & 0.372349 \tabularnewline
6 & 0.256487 & 1.9194 & 0.030019 \tabularnewline
7 & -0.201225 & -1.5058 & 0.068865 \tabularnewline
8 & 0.073588 & 0.5507 & 0.29202 \tabularnewline
9 & 0.063598 & 0.4759 & 0.317991 \tabularnewline
10 & -0.232247 & -1.738 & 0.043856 \tabularnewline
11 & -0.15396 & -1.1521 & 0.127081 \tabularnewline
12 & 0.46202 & 3.4574 & 0.000524 \tabularnewline
13 & -0.21688 & -1.623 & 0.055105 \tabularnewline
14 & -0.144463 & -1.0811 & 0.142152 \tabularnewline
15 & 0.083517 & 0.625 & 0.267259 \tabularnewline
16 & -0.059798 & -0.4475 & 0.328124 \tabularnewline
17 & -0.018946 & -0.1418 & 0.443881 \tabularnewline
18 & 0.062434 & 0.4672 & 0.32108 \tabularnewline
19 & -0.075827 & -0.5674 & 0.286342 \tabularnewline
20 & 0.119909 & 0.8973 & 0.186695 \tabularnewline
21 & -0.065066 & -0.4869 & 0.314112 \tabularnewline
22 & -0.128275 & -0.9599 & 0.170611 \tabularnewline
23 & -0.020927 & -0.1566 & 0.438059 \tabularnewline
24 & 0.204876 & 1.5332 & 0.065435 \tabularnewline
25 & -0.032081 & -0.2401 & 0.405575 \tabularnewline
26 & -0.142709 & -1.0679 & 0.145066 \tabularnewline
27 & 0.037148 & 0.278 & 0.391022 \tabularnewline
28 & 0.03391 & 0.2538 & 0.400305 \tabularnewline
29 & -0.024027 & -0.1798 & 0.428978 \tabularnewline
30 & 0.067152 & 0.5025 & 0.308635 \tabularnewline
31 & 0.005204 & 0.0389 & 0.484537 \tabularnewline
32 & 0.001738 & 0.013 & 0.494834 \tabularnewline
33 & 0.016397 & 0.1227 & 0.451389 \tabularnewline
34 & -0.049908 & -0.3735 & 0.355102 \tabularnewline
35 & -0.085124 & -0.637 & 0.263356 \tabularnewline
36 & 0.186009 & 1.392 & 0.084719 \tabularnewline
37 & 0.004052 & 0.0303 & 0.48796 \tabularnewline
38 & -0.153795 & -1.1509 & 0.127333 \tabularnewline
39 & 0.07936 & 0.5939 & 0.277494 \tabularnewline
40 & 0.026519 & 0.1985 & 0.421705 \tabularnewline
41 & -0.100204 & -0.7499 & 0.228239 \tabularnewline
42 & 0.069886 & 0.523 & 0.301527 \tabularnewline
43 & 0.041334 & 0.3093 & 0.379115 \tabularnewline
44 & -0.07217 & -0.5401 & 0.295645 \tabularnewline
45 & 0.044206 & 0.3308 & 0.371013 \tabularnewline
46 & 0.009149 & 0.0685 & 0.47283 \tabularnewline
47 & -0.123561 & -0.9246 & 0.179559 \tabularnewline
48 & 0.132308 & 0.9901 & 0.163191 \tabularnewline
49 & 0.026669 & 0.1996 & 0.421268 \tabularnewline
50 & -0.122058 & -0.9134 & 0.182475 \tabularnewline
51 & 0.088999 & 0.666 & 0.25407 \tabularnewline
52 & -0.00349 & -0.0261 & 0.489628 \tabularnewline
53 & -0.067966 & -0.5086 & 0.306511 \tabularnewline
54 & 0.046209 & 0.3458 & 0.365395 \tabularnewline
55 & -0.003569 & -0.0267 & 0.489394 \tabularnewline
56 & NA & NA & NA \tabularnewline
57 & NA & NA & NA \tabularnewline
58 & NA & NA & NA \tabularnewline
59 & NA & NA & NA \tabularnewline
60 & NA & NA & NA \tabularnewline
\hline
\end{tabular}
%Source: https://freestatistics.org/blog/index.php?pk=115551&T=1

[TABLE]
[ROW][C]Autocorrelation Function[/C][/ROW]
[ROW][C]Time lag k[/C][C]ACF(k)[/C][C]T-STAT[/C][C]P-value[/C][/ROW]
[ROW][C]1[/C][C]-0.356656[/C][C]-2.669[/C][C]0.004968[/C][/ROW]
[ROW][C]2[/C][C]-0.207845[/C][C]-1.5554[/C][C]0.062746[/C][/ROW]
[ROW][C]3[/C][C]0.308493[/C][C]2.3085[/C][C]0.012342[/C][/ROW]
[ROW][C]4[/C][C]-0.144663[/C][C]-1.0826[/C][C]0.141822[/C][/ROW]
[ROW][C]5[/C][C]-0.043731[/C][C]-0.3273[/C][C]0.372349[/C][/ROW]
[ROW][C]6[/C][C]0.256487[/C][C]1.9194[/C][C]0.030019[/C][/ROW]
[ROW][C]7[/C][C]-0.201225[/C][C]-1.5058[/C][C]0.068865[/C][/ROW]
[ROW][C]8[/C][C]0.073588[/C][C]0.5507[/C][C]0.29202[/C][/ROW]
[ROW][C]9[/C][C]0.063598[/C][C]0.4759[/C][C]0.317991[/C][/ROW]
[ROW][C]10[/C][C]-0.232247[/C][C]-1.738[/C][C]0.043856[/C][/ROW]
[ROW][C]11[/C][C]-0.15396[/C][C]-1.1521[/C][C]0.127081[/C][/ROW]
[ROW][C]12[/C][C]0.46202[/C][C]3.4574[/C][C]0.000524[/C][/ROW]
[ROW][C]13[/C][C]-0.21688[/C][C]-1.623[/C][C]0.055105[/C][/ROW]
[ROW][C]14[/C][C]-0.144463[/C][C]-1.0811[/C][C]0.142152[/C][/ROW]
[ROW][C]15[/C][C]0.083517[/C][C]0.625[/C][C]0.267259[/C][/ROW]
[ROW][C]16[/C][C]-0.059798[/C][C]-0.4475[/C][C]0.328124[/C][/ROW]
[ROW][C]17[/C][C]-0.018946[/C][C]-0.1418[/C][C]0.443881[/C][/ROW]
[ROW][C]18[/C][C]0.062434[/C][C]0.4672[/C][C]0.32108[/C][/ROW]
[ROW][C]19[/C][C]-0.075827[/C][C]-0.5674[/C][C]0.286342[/C][/ROW]
[ROW][C]20[/C][C]0.119909[/C][C]0.8973[/C][C]0.186695[/C][/ROW]
[ROW][C]21[/C][C]-0.065066[/C][C]-0.4869[/C][C]0.314112[/C][/ROW]
[ROW][C]22[/C][C]-0.128275[/C][C]-0.9599[/C][C]0.170611[/C][/ROW]
[ROW][C]23[/C][C]-0.020927[/C][C]-0.1566[/C][C]0.438059[/C][/ROW]
[ROW][C]24[/C][C]0.204876[/C][C]1.5332[/C][C]0.065435[/C][/ROW]
[ROW][C]25[/C][C]-0.032081[/C][C]-0.2401[/C][C]0.405575[/C][/ROW]
[ROW][C]26[/C][C]-0.142709[/C][C]-1.0679[/C][C]0.145066[/C][/ROW]
[ROW][C]27[/C][C]0.037148[/C][C]0.278[/C][C]0.391022[/C][/ROW]
[ROW][C]28[/C][C]0.03391[/C][C]0.2538[/C][C]0.400305[/C][/ROW]
[ROW][C]29[/C][C]-0.024027[/C][C]-0.1798[/C][C]0.428978[/C][/ROW]
[ROW][C]30[/C][C]0.067152[/C][C]0.5025[/C][C]0.308635[/C][/ROW]
[ROW][C]31[/C][C]0.005204[/C][C]0.0389[/C][C]0.484537[/C][/ROW]
[ROW][C]32[/C][C]0.001738[/C][C]0.013[/C][C]0.494834[/C][/ROW]
[ROW][C]33[/C][C]0.016397[/C][C]0.1227[/C][C]0.451389[/C][/ROW]
[ROW][C]34[/C][C]-0.049908[/C][C]-0.3735[/C][C]0.355102[/C][/ROW]
[ROW][C]35[/C][C]-0.085124[/C][C]-0.637[/C][C]0.263356[/C][/ROW]
[ROW][C]36[/C][C]0.186009[/C][C]1.392[/C][C]0.084719[/C][/ROW]
[ROW][C]37[/C][C]0.004052[/C][C]0.0303[/C][C]0.48796[/C][/ROW]
[ROW][C]38[/C][C]-0.153795[/C][C]-1.1509[/C][C]0.127333[/C][/ROW]
[ROW][C]39[/C][C]0.07936[/C][C]0.5939[/C][C]0.277494[/C][/ROW]
[ROW][C]40[/C][C]0.026519[/C][C]0.1985[/C][C]0.421705[/C][/ROW]
[ROW][C]41[/C][C]-0.100204[/C][C]-0.7499[/C][C]0.228239[/C][/ROW]
[ROW][C]42[/C][C]0.069886[/C][C]0.523[/C][C]0.301527[/C][/ROW]
[ROW][C]43[/C][C]0.041334[/C][C]0.3093[/C][C]0.379115[/C][/ROW]
[ROW][C]44[/C][C]-0.07217[/C][C]-0.5401[/C][C]0.295645[/C][/ROW]
[ROW][C]45[/C][C]0.044206[/C][C]0.3308[/C][C]0.371013[/C][/ROW]
[ROW][C]46[/C][C]0.009149[/C][C]0.0685[/C][C]0.47283[/C][/ROW]
[ROW][C]47[/C][C]-0.123561[/C][C]-0.9246[/C][C]0.179559[/C][/ROW]
[ROW][C]48[/C][C]0.132308[/C][C]0.9901[/C][C]0.163191[/C][/ROW]
[ROW][C]49[/C][C]0.026669[/C][C]0.1996[/C][C]0.421268[/C][/ROW]
[ROW][C]50[/C][C]-0.122058[/C][C]-0.9134[/C][C]0.182475[/C][/ROW]
[ROW][C]51[/C][C]0.088999[/C][C]0.666[/C][C]0.25407[/C][/ROW]
[ROW][C]52[/C][C]-0.00349[/C][C]-0.0261[/C][C]0.489628[/C][/ROW]
[ROW][C]53[/C][C]-0.067966[/C][C]-0.5086[/C][C]0.306511[/C][/ROW]
[ROW][C]54[/C][C]0.046209[/C][C]0.3458[/C][C]0.365395[/C][/ROW]
[ROW][C]55[/C][C]-0.003569[/C][C]-0.0267[/C][C]0.489394[/C][/ROW]
[ROW][C]56[/C][C]NA[/C][C]NA[/C][C]NA[/C][/ROW]
[ROW][C]57[/C][C]NA[/C][C]NA[/C][C]NA[/C][/ROW]
[ROW][C]58[/C][C]NA[/C][C]NA[/C][C]NA[/C][/ROW]
[ROW][C]59[/C][C]NA[/C][C]NA[/C][C]NA[/C][/ROW]
[ROW][C]60[/C][C]NA[/C][C]NA[/C][C]NA[/C][/ROW]
[/TABLE]
Source: https://freestatistics.org/blog/index.php?pk=115551&T=1

Globally Unique Identifier (entire table): ba.freestatistics.org/blog/index.php?pk=115551&T=1

As an alternative you can also use a QR Code:  

The GUIDs for individual cells are displayed in the table below:

Autocorrelation Function
Time lag kACF(k)T-STATP-value
1-0.356656-2.6690.004968
2-0.207845-1.55540.062746
30.3084932.30850.012342
4-0.144663-1.08260.141822
5-0.043731-0.32730.372349
60.2564871.91940.030019
7-0.201225-1.50580.068865
80.0735880.55070.29202
90.0635980.47590.317991
10-0.232247-1.7380.043856
11-0.15396-1.15210.127081
120.462023.45740.000524
13-0.21688-1.6230.055105
14-0.144463-1.08110.142152
150.0835170.6250.267259
16-0.059798-0.44750.328124
17-0.018946-0.14180.443881
180.0624340.46720.32108
19-0.075827-0.56740.286342
200.1199090.89730.186695
21-0.065066-0.48690.314112
22-0.128275-0.95990.170611
23-0.020927-0.15660.438059
240.2048761.53320.065435
25-0.032081-0.24010.405575
26-0.142709-1.06790.145066
270.0371480.2780.391022
280.033910.25380.400305
29-0.024027-0.17980.428978
300.0671520.50250.308635
310.0052040.03890.484537
320.0017380.0130.494834
330.0163970.12270.451389
34-0.049908-0.37350.355102
35-0.085124-0.6370.263356
360.1860091.3920.084719
370.0040520.03030.48796
38-0.153795-1.15090.127333
390.079360.59390.277494
400.0265190.19850.421705
41-0.100204-0.74990.228239
420.0698860.5230.301527
430.0413340.30930.379115
44-0.07217-0.54010.295645
450.0442060.33080.371013
460.0091490.06850.47283
47-0.123561-0.92460.179559
480.1323080.99010.163191
490.0266690.19960.421268
50-0.122058-0.91340.182475
510.0889990.6660.25407
52-0.00349-0.02610.489628
53-0.067966-0.50860.306511
540.0462090.34580.365395
55-0.003569-0.02670.489394
56NANANA
57NANANA
58NANANA
59NANANA
60NANANA


Partial Autocorrelation Function
Time lag kPACF(k)T-STATP-value
1-0.356656-2.6690.004968
2-0.383879-2.87270.002869
30.0927120.69380.24534
4-0.055016-0.41170.341064
5-0.00651-0.04870.480659
60.2048151.53270.065491
7-0.009253-0.06920.472522
80.1255120.93920.17582
90.0040640.03040.487924
10-0.17344-1.29790.09982
11-0.489885-3.6660.000275
120.1617691.21060.115573
130.0626750.4690.320439
140.0259710.19440.423302
15-0.2075-1.55280.063054
16-0.030218-0.22610.410962
170.0354140.2650.395985
18-0.102466-0.76680.223215
19-0.012398-0.09280.463205
200.0096390.07210.471377
21-0.034191-0.25590.399498
22-0.117445-0.87890.191612
23-0.06061-0.45360.325947
24-0.07046-0.52730.300043
250.0052880.03960.484289
26-0.134287-1.00490.15963
27-0.042132-0.31530.376857
28-0.063886-0.47810.317227
290.0201940.15110.440213
300.1118470.8370.20308
310.0994870.74450.229845
32-0.109082-0.81630.208895
33-0.079443-0.59450.277286
340.042330.31680.376297
35-0.130432-0.97610.166615
36-0.114448-0.85650.197699
37-0.126987-0.95030.173025
380.0123860.09270.46324
390.0072740.05440.478391
400.0932850.69810.244007
41-0.018119-0.13560.446315
42-0.091338-0.68350.248552
430.0048420.03620.485612
44-0.022299-0.16690.434036
45-0.033925-0.25390.400263
46-0.005511-0.04120.483625
470.0022080.01650.493438
48-0.073901-0.5530.291223
49-0.09393-0.70290.242513
50-0.047117-0.35260.36286
510.0506930.37940.352931
52-0.022128-0.16560.434539
530.0104920.07850.468848
54-0.040259-0.30130.382161
55-0.031491-0.23570.407278
56NANANA
57NANANA
58NANANA
59NANANA
60NANANA

\begin{tabular}{lllllllll}
\hline
Partial Autocorrelation Function \tabularnewline
Time lag k & PACF(k) & T-STAT & P-value \tabularnewline
1 & -0.356656 & -2.669 & 0.004968 \tabularnewline
2 & -0.383879 & -2.8727 & 0.002869 \tabularnewline
3 & 0.092712 & 0.6938 & 0.24534 \tabularnewline
4 & -0.055016 & -0.4117 & 0.341064 \tabularnewline
5 & -0.00651 & -0.0487 & 0.480659 \tabularnewline
6 & 0.204815 & 1.5327 & 0.065491 \tabularnewline
7 & -0.009253 & -0.0692 & 0.472522 \tabularnewline
8 & 0.125512 & 0.9392 & 0.17582 \tabularnewline
9 & 0.004064 & 0.0304 & 0.487924 \tabularnewline
10 & -0.17344 & -1.2979 & 0.09982 \tabularnewline
11 & -0.489885 & -3.666 & 0.000275 \tabularnewline
12 & 0.161769 & 1.2106 & 0.115573 \tabularnewline
13 & 0.062675 & 0.469 & 0.320439 \tabularnewline
14 & 0.025971 & 0.1944 & 0.423302 \tabularnewline
15 & -0.2075 & -1.5528 & 0.063054 \tabularnewline
16 & -0.030218 & -0.2261 & 0.410962 \tabularnewline
17 & 0.035414 & 0.265 & 0.395985 \tabularnewline
18 & -0.102466 & -0.7668 & 0.223215 \tabularnewline
19 & -0.012398 & -0.0928 & 0.463205 \tabularnewline
20 & 0.009639 & 0.0721 & 0.471377 \tabularnewline
21 & -0.034191 & -0.2559 & 0.399498 \tabularnewline
22 & -0.117445 & -0.8789 & 0.191612 \tabularnewline
23 & -0.06061 & -0.4536 & 0.325947 \tabularnewline
24 & -0.07046 & -0.5273 & 0.300043 \tabularnewline
25 & 0.005288 & 0.0396 & 0.484289 \tabularnewline
26 & -0.134287 & -1.0049 & 0.15963 \tabularnewline
27 & -0.042132 & -0.3153 & 0.376857 \tabularnewline
28 & -0.063886 & -0.4781 & 0.317227 \tabularnewline
29 & 0.020194 & 0.1511 & 0.440213 \tabularnewline
30 & 0.111847 & 0.837 & 0.20308 \tabularnewline
31 & 0.099487 & 0.7445 & 0.229845 \tabularnewline
32 & -0.109082 & -0.8163 & 0.208895 \tabularnewline
33 & -0.079443 & -0.5945 & 0.277286 \tabularnewline
34 & 0.04233 & 0.3168 & 0.376297 \tabularnewline
35 & -0.130432 & -0.9761 & 0.166615 \tabularnewline
36 & -0.114448 & -0.8565 & 0.197699 \tabularnewline
37 & -0.126987 & -0.9503 & 0.173025 \tabularnewline
38 & 0.012386 & 0.0927 & 0.46324 \tabularnewline
39 & 0.007274 & 0.0544 & 0.478391 \tabularnewline
40 & 0.093285 & 0.6981 & 0.244007 \tabularnewline
41 & -0.018119 & -0.1356 & 0.446315 \tabularnewline
42 & -0.091338 & -0.6835 & 0.248552 \tabularnewline
43 & 0.004842 & 0.0362 & 0.485612 \tabularnewline
44 & -0.022299 & -0.1669 & 0.434036 \tabularnewline
45 & -0.033925 & -0.2539 & 0.400263 \tabularnewline
46 & -0.005511 & -0.0412 & 0.483625 \tabularnewline
47 & 0.002208 & 0.0165 & 0.493438 \tabularnewline
48 & -0.073901 & -0.553 & 0.291223 \tabularnewline
49 & -0.09393 & -0.7029 & 0.242513 \tabularnewline
50 & -0.047117 & -0.3526 & 0.36286 \tabularnewline
51 & 0.050693 & 0.3794 & 0.352931 \tabularnewline
52 & -0.022128 & -0.1656 & 0.434539 \tabularnewline
53 & 0.010492 & 0.0785 & 0.468848 \tabularnewline
54 & -0.040259 & -0.3013 & 0.382161 \tabularnewline
55 & -0.031491 & -0.2357 & 0.407278 \tabularnewline
56 & NA & NA & NA \tabularnewline
57 & NA & NA & NA \tabularnewline
58 & NA & NA & NA \tabularnewline
59 & NA & NA & NA \tabularnewline
60 & NA & NA & NA \tabularnewline
\hline
\end{tabular}
%Source: https://freestatistics.org/blog/index.php?pk=115551&T=2

[TABLE]
[ROW][C]Partial Autocorrelation Function[/C][/ROW]
[ROW][C]Time lag k[/C][C]PACF(k)[/C][C]T-STAT[/C][C]P-value[/C][/ROW]
[ROW][C]1[/C][C]-0.356656[/C][C]-2.669[/C][C]0.004968[/C][/ROW]
[ROW][C]2[/C][C]-0.383879[/C][C]-2.8727[/C][C]0.002869[/C][/ROW]
[ROW][C]3[/C][C]0.092712[/C][C]0.6938[/C][C]0.24534[/C][/ROW]
[ROW][C]4[/C][C]-0.055016[/C][C]-0.4117[/C][C]0.341064[/C][/ROW]
[ROW][C]5[/C][C]-0.00651[/C][C]-0.0487[/C][C]0.480659[/C][/ROW]
[ROW][C]6[/C][C]0.204815[/C][C]1.5327[/C][C]0.065491[/C][/ROW]
[ROW][C]7[/C][C]-0.009253[/C][C]-0.0692[/C][C]0.472522[/C][/ROW]
[ROW][C]8[/C][C]0.125512[/C][C]0.9392[/C][C]0.17582[/C][/ROW]
[ROW][C]9[/C][C]0.004064[/C][C]0.0304[/C][C]0.487924[/C][/ROW]
[ROW][C]10[/C][C]-0.17344[/C][C]-1.2979[/C][C]0.09982[/C][/ROW]
[ROW][C]11[/C][C]-0.489885[/C][C]-3.666[/C][C]0.000275[/C][/ROW]
[ROW][C]12[/C][C]0.161769[/C][C]1.2106[/C][C]0.115573[/C][/ROW]
[ROW][C]13[/C][C]0.062675[/C][C]0.469[/C][C]0.320439[/C][/ROW]
[ROW][C]14[/C][C]0.025971[/C][C]0.1944[/C][C]0.423302[/C][/ROW]
[ROW][C]15[/C][C]-0.2075[/C][C]-1.5528[/C][C]0.063054[/C][/ROW]
[ROW][C]16[/C][C]-0.030218[/C][C]-0.2261[/C][C]0.410962[/C][/ROW]
[ROW][C]17[/C][C]0.035414[/C][C]0.265[/C][C]0.395985[/C][/ROW]
[ROW][C]18[/C][C]-0.102466[/C][C]-0.7668[/C][C]0.223215[/C][/ROW]
[ROW][C]19[/C][C]-0.012398[/C][C]-0.0928[/C][C]0.463205[/C][/ROW]
[ROW][C]20[/C][C]0.009639[/C][C]0.0721[/C][C]0.471377[/C][/ROW]
[ROW][C]21[/C][C]-0.034191[/C][C]-0.2559[/C][C]0.399498[/C][/ROW]
[ROW][C]22[/C][C]-0.117445[/C][C]-0.8789[/C][C]0.191612[/C][/ROW]
[ROW][C]23[/C][C]-0.06061[/C][C]-0.4536[/C][C]0.325947[/C][/ROW]
[ROW][C]24[/C][C]-0.07046[/C][C]-0.5273[/C][C]0.300043[/C][/ROW]
[ROW][C]25[/C][C]0.005288[/C][C]0.0396[/C][C]0.484289[/C][/ROW]
[ROW][C]26[/C][C]-0.134287[/C][C]-1.0049[/C][C]0.15963[/C][/ROW]
[ROW][C]27[/C][C]-0.042132[/C][C]-0.3153[/C][C]0.376857[/C][/ROW]
[ROW][C]28[/C][C]-0.063886[/C][C]-0.4781[/C][C]0.317227[/C][/ROW]
[ROW][C]29[/C][C]0.020194[/C][C]0.1511[/C][C]0.440213[/C][/ROW]
[ROW][C]30[/C][C]0.111847[/C][C]0.837[/C][C]0.20308[/C][/ROW]
[ROW][C]31[/C][C]0.099487[/C][C]0.7445[/C][C]0.229845[/C][/ROW]
[ROW][C]32[/C][C]-0.109082[/C][C]-0.8163[/C][C]0.208895[/C][/ROW]
[ROW][C]33[/C][C]-0.079443[/C][C]-0.5945[/C][C]0.277286[/C][/ROW]
[ROW][C]34[/C][C]0.04233[/C][C]0.3168[/C][C]0.376297[/C][/ROW]
[ROW][C]35[/C][C]-0.130432[/C][C]-0.9761[/C][C]0.166615[/C][/ROW]
[ROW][C]36[/C][C]-0.114448[/C][C]-0.8565[/C][C]0.197699[/C][/ROW]
[ROW][C]37[/C][C]-0.126987[/C][C]-0.9503[/C][C]0.173025[/C][/ROW]
[ROW][C]38[/C][C]0.012386[/C][C]0.0927[/C][C]0.46324[/C][/ROW]
[ROW][C]39[/C][C]0.007274[/C][C]0.0544[/C][C]0.478391[/C][/ROW]
[ROW][C]40[/C][C]0.093285[/C][C]0.6981[/C][C]0.244007[/C][/ROW]
[ROW][C]41[/C][C]-0.018119[/C][C]-0.1356[/C][C]0.446315[/C][/ROW]
[ROW][C]42[/C][C]-0.091338[/C][C]-0.6835[/C][C]0.248552[/C][/ROW]
[ROW][C]43[/C][C]0.004842[/C][C]0.0362[/C][C]0.485612[/C][/ROW]
[ROW][C]44[/C][C]-0.022299[/C][C]-0.1669[/C][C]0.434036[/C][/ROW]
[ROW][C]45[/C][C]-0.033925[/C][C]-0.2539[/C][C]0.400263[/C][/ROW]
[ROW][C]46[/C][C]-0.005511[/C][C]-0.0412[/C][C]0.483625[/C][/ROW]
[ROW][C]47[/C][C]0.002208[/C][C]0.0165[/C][C]0.493438[/C][/ROW]
[ROW][C]48[/C][C]-0.073901[/C][C]-0.553[/C][C]0.291223[/C][/ROW]
[ROW][C]49[/C][C]-0.09393[/C][C]-0.7029[/C][C]0.242513[/C][/ROW]
[ROW][C]50[/C][C]-0.047117[/C][C]-0.3526[/C][C]0.36286[/C][/ROW]
[ROW][C]51[/C][C]0.050693[/C][C]0.3794[/C][C]0.352931[/C][/ROW]
[ROW][C]52[/C][C]-0.022128[/C][C]-0.1656[/C][C]0.434539[/C][/ROW]
[ROW][C]53[/C][C]0.010492[/C][C]0.0785[/C][C]0.468848[/C][/ROW]
[ROW][C]54[/C][C]-0.040259[/C][C]-0.3013[/C][C]0.382161[/C][/ROW]
[ROW][C]55[/C][C]-0.031491[/C][C]-0.2357[/C][C]0.407278[/C][/ROW]
[ROW][C]56[/C][C]NA[/C][C]NA[/C][C]NA[/C][/ROW]
[ROW][C]57[/C][C]NA[/C][C]NA[/C][C]NA[/C][/ROW]
[ROW][C]58[/C][C]NA[/C][C]NA[/C][C]NA[/C][/ROW]
[ROW][C]59[/C][C]NA[/C][C]NA[/C][C]NA[/C][/ROW]
[ROW][C]60[/C][C]NA[/C][C]NA[/C][C]NA[/C][/ROW]
[/TABLE]
Source: https://freestatistics.org/blog/index.php?pk=115551&T=2

Globally Unique Identifier (entire table): ba.freestatistics.org/blog/index.php?pk=115551&T=2

As an alternative you can also use a QR Code:  

The GUIDs for individual cells are displayed in the table below:

Partial Autocorrelation Function
Time lag kPACF(k)T-STATP-value
1-0.356656-2.6690.004968
2-0.383879-2.87270.002869
30.0927120.69380.24534
4-0.055016-0.41170.341064
5-0.00651-0.04870.480659
60.2048151.53270.065491
7-0.009253-0.06920.472522
80.1255120.93920.17582
90.0040640.03040.487924
10-0.17344-1.29790.09982
11-0.489885-3.6660.000275
120.1617691.21060.115573
130.0626750.4690.320439
140.0259710.19440.423302
15-0.2075-1.55280.063054
16-0.030218-0.22610.410962
170.0354140.2650.395985
18-0.102466-0.76680.223215
19-0.012398-0.09280.463205
200.0096390.07210.471377
21-0.034191-0.25590.399498
22-0.117445-0.87890.191612
23-0.06061-0.45360.325947
24-0.07046-0.52730.300043
250.0052880.03960.484289
26-0.134287-1.00490.15963
27-0.042132-0.31530.376857
28-0.063886-0.47810.317227
290.0201940.15110.440213
300.1118470.8370.20308
310.0994870.74450.229845
32-0.109082-0.81630.208895
33-0.079443-0.59450.277286
340.042330.31680.376297
35-0.130432-0.97610.166615
36-0.114448-0.85650.197699
37-0.126987-0.95030.173025
380.0123860.09270.46324
390.0072740.05440.478391
400.0932850.69810.244007
41-0.018119-0.13560.446315
42-0.091338-0.68350.248552
430.0048420.03620.485612
44-0.022299-0.16690.434036
45-0.033925-0.25390.400263
46-0.005511-0.04120.483625
470.0022080.01650.493438
48-0.073901-0.5530.291223
49-0.09393-0.70290.242513
50-0.047117-0.35260.36286
510.0506930.37940.352931
52-0.022128-0.16560.434539
530.0104920.07850.468848
54-0.040259-0.30130.382161
55-0.031491-0.23570.407278
56NANANA
57NANANA
58NANANA
59NANANA
60NANANA


Parameters (Session):
par1 = 60 ; par2 = 1 ; par3 = 1 ; par4 = 0 ; par5 = 12 ; par6 = White Noise ; par7 = 0.95 ;
Parameters (R input):
par1 = 60 ; par2 = 1 ; par3 = 1 ; par4 = 0 ; par5 = 12 ; par6 = White Noise ; par7 = 0.95 ; par8 = ;
R code (references can be found in the software module):
if (par1 == 'Default') {
par1 = 10*log10(length(x))
} else {
par1 <- as.numeric(par1)
}
par2 <- as.numeric(par2)
par3 <- as.numeric(par3)
par4 <- as.numeric(par4)
par5 <- as.numeric(par5)
if (par6 == 'White Noise') par6 <- 'white' else par6 <- 'ma'
par7 <- as.numeric(par7)
if (par8 != '') par8 <- as.numeric(par8)
ox <- x
if (par8 == '') {
if (par2 == 0) {
x <- log(x)
} else {
x <- (x ^ par2 - 1) / par2
}
} else {
x <- log(x,base=par8)
}
if (par3 > 0) x <- diff(x,lag=1,difference=par3)
if (par4 > 0) x <- diff(x,lag=par5,difference=par4)
bitmap(file='picts.png')
op <- par(mfrow=c(2,1))
plot(ox,type='l',main='Original Time Series',xlab='time',ylab='value')
if (par8=='') {
mytitle <- paste('Working Time Series (lambda=',par2,', d=',par3,', D=',par4,')',sep='')
mysub <- paste('(lambda=',par2,', d=',par3,', D=',par4,', CI=', par7, ', CI type=',par6,')',sep='')
} else {
mytitle <- paste('Working Time Series (base=',par8,', d=',par3,', D=',par4,')',sep='')
mysub <- paste('(base=',par8,', d=',par3,', D=',par4,', CI=', par7, ', CI type=',par6,')',sep='')
}
plot(x,type='l', main=mytitle,xlab='time',ylab='value')
par(op)
dev.off()
bitmap(file='pic1.png')
racf <- acf(x, par1, main='Autocorrelation', xlab='time lag', ylab='ACF', ci.type=par6, ci=par7, sub=mysub)
dev.off()
bitmap(file='pic2.png')
rpacf <- pacf(x,par1,main='Partial Autocorrelation',xlab='lags',ylab='PACF',sub=mysub)
dev.off()
(myacf <- c(racf$acf))
(mypacf <- c(rpacf$acf))
lengthx <- length(x)
sqrtn <- sqrt(lengthx)
load(file='createtable')
a<-table.start()
a<-table.row.start(a)
a<-table.element(a,'Autocorrelation Function',4,TRUE)
a<-table.row.end(a)
a<-table.row.start(a)
a<-table.element(a,'Time lag k',header=TRUE)
a<-table.element(a,hyperlink('basics.htm','ACF(k)','click here for more information about the Autocorrelation Function'),header=TRUE)
a<-table.element(a,'T-STAT',header=TRUE)
a<-table.element(a,'P-value',header=TRUE)
a<-table.row.end(a)
for (i in 2:(par1+1)) {
a<-table.row.start(a)
a<-table.element(a,i-1,header=TRUE)
a<-table.element(a,round(myacf[i],6))
mytstat <- myacf[i]*sqrtn
a<-table.element(a,round(mytstat,4))
a<-table.element(a,round(1-pt(abs(mytstat),lengthx),6))
a<-table.row.end(a)
}
a<-table.end(a)
table.save(a,file='mytable.tab')
a<-table.start()
a<-table.row.start(a)
a<-table.element(a,'Partial Autocorrelation Function',4,TRUE)
a<-table.row.end(a)
a<-table.row.start(a)
a<-table.element(a,'Time lag k',header=TRUE)
a<-table.element(a,hyperlink('basics.htm','PACF(k)','click here for more information about the Partial Autocorrelation Function'),header=TRUE)
a<-table.element(a,'T-STAT',header=TRUE)
a<-table.element(a,'P-value',header=TRUE)
a<-table.row.end(a)
for (i in 1:par1) {
a<-table.row.start(a)
a<-table.element(a,i,header=TRUE)
a<-table.element(a,round(mypacf[i],6))
mytstat <- mypacf[i]*sqrtn
a<-table.element(a,round(mytstat,4))
a<-table.element(a,round(1-pt(abs(mytstat),lengthx),6))
a<-table.row.end(a)
}
a<-table.end(a)
table.save(a,file='mytable1.tab')