Free Statistics

of Irreproducible Research!

Author's title

Author*The author of this computation has been verified*
R Software Modulerwasp_autocorrelation.wasp
Title produced by software(Partial) Autocorrelation Function
Date of computationSun, 26 Dec 2010 11:39:04 +0000
Cite this page as followsStatistical Computations at FreeStatistics.org, Office for Research Development and Education, URL https://freestatistics.org/blog/index.php?v=date/2010/Dec/26/t1293363522vgschr77wsoi931.htm/, Retrieved Mon, 06 May 2024 16:30:05 +0000
Statistical Computations at FreeStatistics.org, Office for Research Development and Education, URL https://freestatistics.org/blog/index.php?pk=115545, Retrieved Mon, 06 May 2024 16:30:05 +0000
QR Codes:

Original text written by user:
IsPrivate?No (this computation is public)
User-defined keywordsd=0 D=0
Estimated Impact182
Family? (F = Feedback message, R = changed R code, M = changed R Module, P = changed Parameters, D = changed Data)
-     [Univariate Data Series] [] [2008-12-08 19:22:39] [d2d412c7f4d35ffbf5ee5ee89db327d4]
- RMPD    [(Partial) Autocorrelation Function] [autocorrelatie fu...] [2010-12-26 11:39:04] [ea05999e24dc6223e14cc730e7a15b1e] [Current]
-   PD      [(Partial) Autocorrelation Function] [autocorrelatie fu...] [2010-12-27 08:37:45] [d4d7f64064e581afd5f11cb27d8ab03c]
Feedback Forum

Post a new message
Dataseries X:
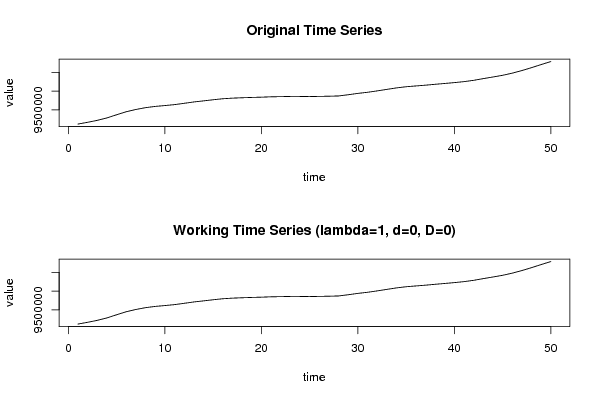
9119000
9166000
9218000
9283000
9367000
9448000
9508000
9557000
9590000
9613000
9638000
9673000
9709000
9738000
9768000
9795000
9811000
9822000
9830000
9837000
9847000
9852000
9856000
9856000
9853000
9858000
9862000
9870000
9902000
9938000
9967400
10004500
10045000
10084500
10115600
10136800
10157000
10181000
10203000
10226000
10252000
10287000
10333000
10376080,14
10421120,61
10478650
10547958
10625700
10708433
10788760


Summary of computational transaction
Raw Inputview raw input (R code)
Raw Outputview raw output of R engine
Computing time2 seconds
R Server'Sir Ronald Aylmer Fisher' @ 193.190.124.24

\begin{tabular}{lllllllll}
\hline
Summary of computational transaction \tabularnewline
Raw Input & view raw input (R code)  \tabularnewline
Raw Output & view raw output of R engine  \tabularnewline
Computing time & 2 seconds \tabularnewline
R Server & 'Sir Ronald Aylmer Fisher' @ 193.190.124.24 \tabularnewline
\hline
\end{tabular}
%Source: https://freestatistics.org/blog/index.php?pk=115545&T=0

[TABLE]
[ROW][C]Summary of computational transaction[/C][/ROW]
[ROW][C]Raw Input[/C][C]view raw input (R code) [/C][/ROW]
[ROW][C]Raw Output[/C][C]view raw output of R engine [/C][/ROW]
[ROW][C]Computing time[/C][C]2 seconds[/C][/ROW]
[ROW][C]R Server[/C][C]'Sir Ronald Aylmer Fisher' @ 193.190.124.24[/C][/ROW]
[/TABLE]
Source: https://freestatistics.org/blog/index.php?pk=115545&T=0

Globally Unique Identifier (entire table): ba.freestatistics.org/blog/index.php?pk=115545&T=0

As an alternative you can also use a QR Code:  

The GUIDs for individual cells are displayed in the table below:

Summary of computational transaction
Raw Inputview raw input (R code)
Raw Outputview raw output of R engine
Computing time2 seconds
R Server'Sir Ronald Aylmer Fisher' @ 193.190.124.24


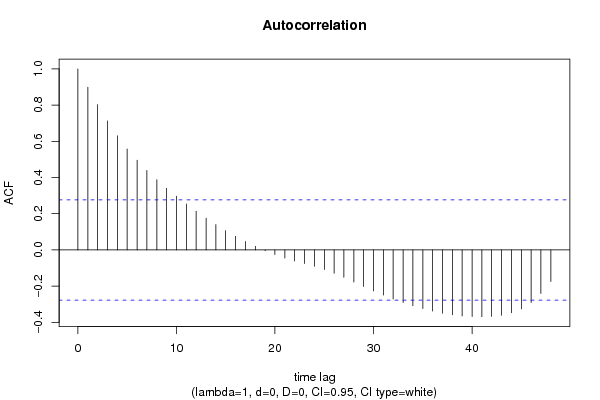
Autocorrelation Function
Time lag kACF(k)T-STATP-value
10.8994886.36030
20.8030735.67860
30.7126785.03943e-06
40.6302554.45662.4e-05
50.5580443.9460.000124
60.4952823.50220.000491
70.4388213.10290.001575
80.3877062.74150.004231
90.340932.41070.009819
100.2963682.09560.020599
110.2533911.79170.039613
120.2129771.5060.069183
130.1753251.23970.11043
140.1400070.990.163471
150.1067430.75480.226959
160.0754230.53330.298086
170.0461390.32630.372798
180.0195460.13820.445314
19-0.004261-0.03010.488042
20-0.025494-0.18030.428835
21-0.044537-0.31490.377065
22-0.060965-0.43110.334128
23-0.075243-0.5320.298524
24-0.09086-0.64250.26175
25-0.10895-0.77040.222346
26-0.128782-0.91060.18343
27-0.151745-1.0730.144212
28-0.177316-1.25380.10787
29-0.202441-1.43150.079258
30-0.226527-1.60180.057751
31-0.249659-1.76540.041805
32-0.271314-1.91850.030384
33-0.290995-2.05760.022429
34-0.308482-2.18130.016946
35-0.324174-2.29230.013068
36-0.337899-2.38930.010347
37-0.349452-2.4710.008463
38-0.358585-2.53560.007199
39-0.364684-2.57870.006454
40-0.367769-2.60050.006104
41-0.368854-2.60820.005985
42-0.367371-2.59770.006148
43-0.360938-2.55220.006903
44-0.347792-2.45930.008713
45-0.326038-2.30540.012664
46-0.291106-2.05840.022389
47-0.24051-1.70070.04761
48-0.174869-1.23650.111023

\begin{tabular}{lllllllll}
\hline
Autocorrelation Function \tabularnewline
Time lag k & ACF(k) & T-STAT & P-value \tabularnewline
1 & 0.899488 & 6.3603 & 0 \tabularnewline
2 & 0.803073 & 5.6786 & 0 \tabularnewline
3 & 0.712678 & 5.0394 & 3e-06 \tabularnewline
4 & 0.630255 & 4.4566 & 2.4e-05 \tabularnewline
5 & 0.558044 & 3.946 & 0.000124 \tabularnewline
6 & 0.495282 & 3.5022 & 0.000491 \tabularnewline
7 & 0.438821 & 3.1029 & 0.001575 \tabularnewline
8 & 0.387706 & 2.7415 & 0.004231 \tabularnewline
9 & 0.34093 & 2.4107 & 0.009819 \tabularnewline
10 & 0.296368 & 2.0956 & 0.020599 \tabularnewline
11 & 0.253391 & 1.7917 & 0.039613 \tabularnewline
12 & 0.212977 & 1.506 & 0.069183 \tabularnewline
13 & 0.175325 & 1.2397 & 0.11043 \tabularnewline
14 & 0.140007 & 0.99 & 0.163471 \tabularnewline
15 & 0.106743 & 0.7548 & 0.226959 \tabularnewline
16 & 0.075423 & 0.5333 & 0.298086 \tabularnewline
17 & 0.046139 & 0.3263 & 0.372798 \tabularnewline
18 & 0.019546 & 0.1382 & 0.445314 \tabularnewline
19 & -0.004261 & -0.0301 & 0.488042 \tabularnewline
20 & -0.025494 & -0.1803 & 0.428835 \tabularnewline
21 & -0.044537 & -0.3149 & 0.377065 \tabularnewline
22 & -0.060965 & -0.4311 & 0.334128 \tabularnewline
23 & -0.075243 & -0.532 & 0.298524 \tabularnewline
24 & -0.09086 & -0.6425 & 0.26175 \tabularnewline
25 & -0.10895 & -0.7704 & 0.222346 \tabularnewline
26 & -0.128782 & -0.9106 & 0.18343 \tabularnewline
27 & -0.151745 & -1.073 & 0.144212 \tabularnewline
28 & -0.177316 & -1.2538 & 0.10787 \tabularnewline
29 & -0.202441 & -1.4315 & 0.079258 \tabularnewline
30 & -0.226527 & -1.6018 & 0.057751 \tabularnewline
31 & -0.249659 & -1.7654 & 0.041805 \tabularnewline
32 & -0.271314 & -1.9185 & 0.030384 \tabularnewline
33 & -0.290995 & -2.0576 & 0.022429 \tabularnewline
34 & -0.308482 & -2.1813 & 0.016946 \tabularnewline
35 & -0.324174 & -2.2923 & 0.013068 \tabularnewline
36 & -0.337899 & -2.3893 & 0.010347 \tabularnewline
37 & -0.349452 & -2.471 & 0.008463 \tabularnewline
38 & -0.358585 & -2.5356 & 0.007199 \tabularnewline
39 & -0.364684 & -2.5787 & 0.006454 \tabularnewline
40 & -0.367769 & -2.6005 & 0.006104 \tabularnewline
41 & -0.368854 & -2.6082 & 0.005985 \tabularnewline
42 & -0.367371 & -2.5977 & 0.006148 \tabularnewline
43 & -0.360938 & -2.5522 & 0.006903 \tabularnewline
44 & -0.347792 & -2.4593 & 0.008713 \tabularnewline
45 & -0.326038 & -2.3054 & 0.012664 \tabularnewline
46 & -0.291106 & -2.0584 & 0.022389 \tabularnewline
47 & -0.24051 & -1.7007 & 0.04761 \tabularnewline
48 & -0.174869 & -1.2365 & 0.111023 \tabularnewline
\hline
\end{tabular}
%Source: https://freestatistics.org/blog/index.php?pk=115545&T=1

[TABLE]
[ROW][C]Autocorrelation Function[/C][/ROW]
[ROW][C]Time lag k[/C][C]ACF(k)[/C][C]T-STAT[/C][C]P-value[/C][/ROW]
[ROW][C]1[/C][C]0.899488[/C][C]6.3603[/C][C]0[/C][/ROW]
[ROW][C]2[/C][C]0.803073[/C][C]5.6786[/C][C]0[/C][/ROW]
[ROW][C]3[/C][C]0.712678[/C][C]5.0394[/C][C]3e-06[/C][/ROW]
[ROW][C]4[/C][C]0.630255[/C][C]4.4566[/C][C]2.4e-05[/C][/ROW]
[ROW][C]5[/C][C]0.558044[/C][C]3.946[/C][C]0.000124[/C][/ROW]
[ROW][C]6[/C][C]0.495282[/C][C]3.5022[/C][C]0.000491[/C][/ROW]
[ROW][C]7[/C][C]0.438821[/C][C]3.1029[/C][C]0.001575[/C][/ROW]
[ROW][C]8[/C][C]0.387706[/C][C]2.7415[/C][C]0.004231[/C][/ROW]
[ROW][C]9[/C][C]0.34093[/C][C]2.4107[/C][C]0.009819[/C][/ROW]
[ROW][C]10[/C][C]0.296368[/C][C]2.0956[/C][C]0.020599[/C][/ROW]
[ROW][C]11[/C][C]0.253391[/C][C]1.7917[/C][C]0.039613[/C][/ROW]
[ROW][C]12[/C][C]0.212977[/C][C]1.506[/C][C]0.069183[/C][/ROW]
[ROW][C]13[/C][C]0.175325[/C][C]1.2397[/C][C]0.11043[/C][/ROW]
[ROW][C]14[/C][C]0.140007[/C][C]0.99[/C][C]0.163471[/C][/ROW]
[ROW][C]15[/C][C]0.106743[/C][C]0.7548[/C][C]0.226959[/C][/ROW]
[ROW][C]16[/C][C]0.075423[/C][C]0.5333[/C][C]0.298086[/C][/ROW]
[ROW][C]17[/C][C]0.046139[/C][C]0.3263[/C][C]0.372798[/C][/ROW]
[ROW][C]18[/C][C]0.019546[/C][C]0.1382[/C][C]0.445314[/C][/ROW]
[ROW][C]19[/C][C]-0.004261[/C][C]-0.0301[/C][C]0.488042[/C][/ROW]
[ROW][C]20[/C][C]-0.025494[/C][C]-0.1803[/C][C]0.428835[/C][/ROW]
[ROW][C]21[/C][C]-0.044537[/C][C]-0.3149[/C][C]0.377065[/C][/ROW]
[ROW][C]22[/C][C]-0.060965[/C][C]-0.4311[/C][C]0.334128[/C][/ROW]
[ROW][C]23[/C][C]-0.075243[/C][C]-0.532[/C][C]0.298524[/C][/ROW]
[ROW][C]24[/C][C]-0.09086[/C][C]-0.6425[/C][C]0.26175[/C][/ROW]
[ROW][C]25[/C][C]-0.10895[/C][C]-0.7704[/C][C]0.222346[/C][/ROW]
[ROW][C]26[/C][C]-0.128782[/C][C]-0.9106[/C][C]0.18343[/C][/ROW]
[ROW][C]27[/C][C]-0.151745[/C][C]-1.073[/C][C]0.144212[/C][/ROW]
[ROW][C]28[/C][C]-0.177316[/C][C]-1.2538[/C][C]0.10787[/C][/ROW]
[ROW][C]29[/C][C]-0.202441[/C][C]-1.4315[/C][C]0.079258[/C][/ROW]
[ROW][C]30[/C][C]-0.226527[/C][C]-1.6018[/C][C]0.057751[/C][/ROW]
[ROW][C]31[/C][C]-0.249659[/C][C]-1.7654[/C][C]0.041805[/C][/ROW]
[ROW][C]32[/C][C]-0.271314[/C][C]-1.9185[/C][C]0.030384[/C][/ROW]
[ROW][C]33[/C][C]-0.290995[/C][C]-2.0576[/C][C]0.022429[/C][/ROW]
[ROW][C]34[/C][C]-0.308482[/C][C]-2.1813[/C][C]0.016946[/C][/ROW]
[ROW][C]35[/C][C]-0.324174[/C][C]-2.2923[/C][C]0.013068[/C][/ROW]
[ROW][C]36[/C][C]-0.337899[/C][C]-2.3893[/C][C]0.010347[/C][/ROW]
[ROW][C]37[/C][C]-0.349452[/C][C]-2.471[/C][C]0.008463[/C][/ROW]
[ROW][C]38[/C][C]-0.358585[/C][C]-2.5356[/C][C]0.007199[/C][/ROW]
[ROW][C]39[/C][C]-0.364684[/C][C]-2.5787[/C][C]0.006454[/C][/ROW]
[ROW][C]40[/C][C]-0.367769[/C][C]-2.6005[/C][C]0.006104[/C][/ROW]
[ROW][C]41[/C][C]-0.368854[/C][C]-2.6082[/C][C]0.005985[/C][/ROW]
[ROW][C]42[/C][C]-0.367371[/C][C]-2.5977[/C][C]0.006148[/C][/ROW]
[ROW][C]43[/C][C]-0.360938[/C][C]-2.5522[/C][C]0.006903[/C][/ROW]
[ROW][C]44[/C][C]-0.347792[/C][C]-2.4593[/C][C]0.008713[/C][/ROW]
[ROW][C]45[/C][C]-0.326038[/C][C]-2.3054[/C][C]0.012664[/C][/ROW]
[ROW][C]46[/C][C]-0.291106[/C][C]-2.0584[/C][C]0.022389[/C][/ROW]
[ROW][C]47[/C][C]-0.24051[/C][C]-1.7007[/C][C]0.04761[/C][/ROW]
[ROW][C]48[/C][C]-0.174869[/C][C]-1.2365[/C][C]0.111023[/C][/ROW]
[/TABLE]
Source: https://freestatistics.org/blog/index.php?pk=115545&T=1

Globally Unique Identifier (entire table): ba.freestatistics.org/blog/index.php?pk=115545&T=1

As an alternative you can also use a QR Code:  

The GUIDs for individual cells are displayed in the table below:

Autocorrelation Function
Time lag kACF(k)T-STATP-value
10.8994886.36030
20.8030735.67860
30.7126785.03943e-06
40.6302554.45662.4e-05
50.5580443.9460.000124
60.4952823.50220.000491
70.4388213.10290.001575
80.3877062.74150.004231
90.340932.41070.009819
100.2963682.09560.020599
110.2533911.79170.039613
120.2129771.5060.069183
130.1753251.23970.11043
140.1400070.990.163471
150.1067430.75480.226959
160.0754230.53330.298086
170.0461390.32630.372798
180.0195460.13820.445314
19-0.004261-0.03010.488042
20-0.025494-0.18030.428835
21-0.044537-0.31490.377065
22-0.060965-0.43110.334128
23-0.075243-0.5320.298524
24-0.09086-0.64250.26175
25-0.10895-0.77040.222346
26-0.128782-0.91060.18343
27-0.151745-1.0730.144212
28-0.177316-1.25380.10787
29-0.202441-1.43150.079258
30-0.226527-1.60180.057751
31-0.249659-1.76540.041805
32-0.271314-1.91850.030384
33-0.290995-2.05760.022429
34-0.308482-2.18130.016946
35-0.324174-2.29230.013068
36-0.337899-2.38930.010347
37-0.349452-2.4710.008463
38-0.358585-2.53560.007199
39-0.364684-2.57870.006454
40-0.367769-2.60050.006104
41-0.368854-2.60820.005985
42-0.367371-2.59770.006148
43-0.360938-2.55220.006903
44-0.347792-2.45930.008713
45-0.326038-2.30540.012664
46-0.291106-2.05840.022389
47-0.24051-1.70070.04761
48-0.174869-1.23650.111023


Partial Autocorrelation Function
Time lag kPACF(k)T-STATP-value
10.8994886.36030
2-0.031459-0.22250.412434
3-0.021518-0.15220.439839
4-0.009903-0.070.472226
50.0049940.03530.485985
60.0063670.0450.482136
7-0.00459-0.03250.48712
8-0.005788-0.04090.483758
9-0.007888-0.05580.47787
10-0.016778-0.11860.453018
11-0.019796-0.140.44462
12-0.015136-0.1070.457597
13-0.013969-0.09880.460857
14-0.016023-0.11330.455124
15-0.017393-0.1230.451304
16-0.017653-0.12480.45058
17-0.016802-0.11880.452953
18-0.012986-0.09180.463603
19-0.011517-0.08140.46771
20-0.011334-0.08010.468221
21-0.012051-0.08520.466216
22-0.008636-0.06110.475775
23-0.00945-0.06680.473496
24-0.026478-0.18720.42612
25-0.033911-0.23980.405737
26-0.032918-0.23280.408446
27-0.043307-0.30620.380351
28-0.045651-0.32280.374095
29-0.034657-0.24510.403705
30-0.033949-0.24010.405635
31-0.036145-0.25560.399661
32-0.034828-0.24630.40324
33-0.032227-0.22790.410335
34-0.030339-0.21450.415505
35-0.031847-0.22520.411375
36-0.030537-0.21590.414962
37-0.028708-0.2030.419981
38-0.026692-0.18870.42553
39-0.022533-0.15930.437024
40-0.020863-0.14750.441656
41-0.024282-0.17170.432183
42-0.020141-0.14240.443662
43-0.005616-0.03970.484242
440.0081770.05780.477062
450.0249130.17620.43044
460.0591140.4180.338869
470.0891550.63040.265644
480.1084320.76670.223423

\begin{tabular}{lllllllll}
\hline
Partial Autocorrelation Function \tabularnewline
Time lag k & PACF(k) & T-STAT & P-value \tabularnewline
1 & 0.899488 & 6.3603 & 0 \tabularnewline
2 & -0.031459 & -0.2225 & 0.412434 \tabularnewline
3 & -0.021518 & -0.1522 & 0.439839 \tabularnewline
4 & -0.009903 & -0.07 & 0.472226 \tabularnewline
5 & 0.004994 & 0.0353 & 0.485985 \tabularnewline
6 & 0.006367 & 0.045 & 0.482136 \tabularnewline
7 & -0.00459 & -0.0325 & 0.48712 \tabularnewline
8 & -0.005788 & -0.0409 & 0.483758 \tabularnewline
9 & -0.007888 & -0.0558 & 0.47787 \tabularnewline
10 & -0.016778 & -0.1186 & 0.453018 \tabularnewline
11 & -0.019796 & -0.14 & 0.44462 \tabularnewline
12 & -0.015136 & -0.107 & 0.457597 \tabularnewline
13 & -0.013969 & -0.0988 & 0.460857 \tabularnewline
14 & -0.016023 & -0.1133 & 0.455124 \tabularnewline
15 & -0.017393 & -0.123 & 0.451304 \tabularnewline
16 & -0.017653 & -0.1248 & 0.45058 \tabularnewline
17 & -0.016802 & -0.1188 & 0.452953 \tabularnewline
18 & -0.012986 & -0.0918 & 0.463603 \tabularnewline
19 & -0.011517 & -0.0814 & 0.46771 \tabularnewline
20 & -0.011334 & -0.0801 & 0.468221 \tabularnewline
21 & -0.012051 & -0.0852 & 0.466216 \tabularnewline
22 & -0.008636 & -0.0611 & 0.475775 \tabularnewline
23 & -0.00945 & -0.0668 & 0.473496 \tabularnewline
24 & -0.026478 & -0.1872 & 0.42612 \tabularnewline
25 & -0.033911 & -0.2398 & 0.405737 \tabularnewline
26 & -0.032918 & -0.2328 & 0.408446 \tabularnewline
27 & -0.043307 & -0.3062 & 0.380351 \tabularnewline
28 & -0.045651 & -0.3228 & 0.374095 \tabularnewline
29 & -0.034657 & -0.2451 & 0.403705 \tabularnewline
30 & -0.033949 & -0.2401 & 0.405635 \tabularnewline
31 & -0.036145 & -0.2556 & 0.399661 \tabularnewline
32 & -0.034828 & -0.2463 & 0.40324 \tabularnewline
33 & -0.032227 & -0.2279 & 0.410335 \tabularnewline
34 & -0.030339 & -0.2145 & 0.415505 \tabularnewline
35 & -0.031847 & -0.2252 & 0.411375 \tabularnewline
36 & -0.030537 & -0.2159 & 0.414962 \tabularnewline
37 & -0.028708 & -0.203 & 0.419981 \tabularnewline
38 & -0.026692 & -0.1887 & 0.42553 \tabularnewline
39 & -0.022533 & -0.1593 & 0.437024 \tabularnewline
40 & -0.020863 & -0.1475 & 0.441656 \tabularnewline
41 & -0.024282 & -0.1717 & 0.432183 \tabularnewline
42 & -0.020141 & -0.1424 & 0.443662 \tabularnewline
43 & -0.005616 & -0.0397 & 0.484242 \tabularnewline
44 & 0.008177 & 0.0578 & 0.477062 \tabularnewline
45 & 0.024913 & 0.1762 & 0.43044 \tabularnewline
46 & 0.059114 & 0.418 & 0.338869 \tabularnewline
47 & 0.089155 & 0.6304 & 0.265644 \tabularnewline
48 & 0.108432 & 0.7667 & 0.223423 \tabularnewline
\hline
\end{tabular}
%Source: https://freestatistics.org/blog/index.php?pk=115545&T=2

[TABLE]
[ROW][C]Partial Autocorrelation Function[/C][/ROW]
[ROW][C]Time lag k[/C][C]PACF(k)[/C][C]T-STAT[/C][C]P-value[/C][/ROW]
[ROW][C]1[/C][C]0.899488[/C][C]6.3603[/C][C]0[/C][/ROW]
[ROW][C]2[/C][C]-0.031459[/C][C]-0.2225[/C][C]0.412434[/C][/ROW]
[ROW][C]3[/C][C]-0.021518[/C][C]-0.1522[/C][C]0.439839[/C][/ROW]
[ROW][C]4[/C][C]-0.009903[/C][C]-0.07[/C][C]0.472226[/C][/ROW]
[ROW][C]5[/C][C]0.004994[/C][C]0.0353[/C][C]0.485985[/C][/ROW]
[ROW][C]6[/C][C]0.006367[/C][C]0.045[/C][C]0.482136[/C][/ROW]
[ROW][C]7[/C][C]-0.00459[/C][C]-0.0325[/C][C]0.48712[/C][/ROW]
[ROW][C]8[/C][C]-0.005788[/C][C]-0.0409[/C][C]0.483758[/C][/ROW]
[ROW][C]9[/C][C]-0.007888[/C][C]-0.0558[/C][C]0.47787[/C][/ROW]
[ROW][C]10[/C][C]-0.016778[/C][C]-0.1186[/C][C]0.453018[/C][/ROW]
[ROW][C]11[/C][C]-0.019796[/C][C]-0.14[/C][C]0.44462[/C][/ROW]
[ROW][C]12[/C][C]-0.015136[/C][C]-0.107[/C][C]0.457597[/C][/ROW]
[ROW][C]13[/C][C]-0.013969[/C][C]-0.0988[/C][C]0.460857[/C][/ROW]
[ROW][C]14[/C][C]-0.016023[/C][C]-0.1133[/C][C]0.455124[/C][/ROW]
[ROW][C]15[/C][C]-0.017393[/C][C]-0.123[/C][C]0.451304[/C][/ROW]
[ROW][C]16[/C][C]-0.017653[/C][C]-0.1248[/C][C]0.45058[/C][/ROW]
[ROW][C]17[/C][C]-0.016802[/C][C]-0.1188[/C][C]0.452953[/C][/ROW]
[ROW][C]18[/C][C]-0.012986[/C][C]-0.0918[/C][C]0.463603[/C][/ROW]
[ROW][C]19[/C][C]-0.011517[/C][C]-0.0814[/C][C]0.46771[/C][/ROW]
[ROW][C]20[/C][C]-0.011334[/C][C]-0.0801[/C][C]0.468221[/C][/ROW]
[ROW][C]21[/C][C]-0.012051[/C][C]-0.0852[/C][C]0.466216[/C][/ROW]
[ROW][C]22[/C][C]-0.008636[/C][C]-0.0611[/C][C]0.475775[/C][/ROW]
[ROW][C]23[/C][C]-0.00945[/C][C]-0.0668[/C][C]0.473496[/C][/ROW]
[ROW][C]24[/C][C]-0.026478[/C][C]-0.1872[/C][C]0.42612[/C][/ROW]
[ROW][C]25[/C][C]-0.033911[/C][C]-0.2398[/C][C]0.405737[/C][/ROW]
[ROW][C]26[/C][C]-0.032918[/C][C]-0.2328[/C][C]0.408446[/C][/ROW]
[ROW][C]27[/C][C]-0.043307[/C][C]-0.3062[/C][C]0.380351[/C][/ROW]
[ROW][C]28[/C][C]-0.045651[/C][C]-0.3228[/C][C]0.374095[/C][/ROW]
[ROW][C]29[/C][C]-0.034657[/C][C]-0.2451[/C][C]0.403705[/C][/ROW]
[ROW][C]30[/C][C]-0.033949[/C][C]-0.2401[/C][C]0.405635[/C][/ROW]
[ROW][C]31[/C][C]-0.036145[/C][C]-0.2556[/C][C]0.399661[/C][/ROW]
[ROW][C]32[/C][C]-0.034828[/C][C]-0.2463[/C][C]0.40324[/C][/ROW]
[ROW][C]33[/C][C]-0.032227[/C][C]-0.2279[/C][C]0.410335[/C][/ROW]
[ROW][C]34[/C][C]-0.030339[/C][C]-0.2145[/C][C]0.415505[/C][/ROW]
[ROW][C]35[/C][C]-0.031847[/C][C]-0.2252[/C][C]0.411375[/C][/ROW]
[ROW][C]36[/C][C]-0.030537[/C][C]-0.2159[/C][C]0.414962[/C][/ROW]
[ROW][C]37[/C][C]-0.028708[/C][C]-0.203[/C][C]0.419981[/C][/ROW]
[ROW][C]38[/C][C]-0.026692[/C][C]-0.1887[/C][C]0.42553[/C][/ROW]
[ROW][C]39[/C][C]-0.022533[/C][C]-0.1593[/C][C]0.437024[/C][/ROW]
[ROW][C]40[/C][C]-0.020863[/C][C]-0.1475[/C][C]0.441656[/C][/ROW]
[ROW][C]41[/C][C]-0.024282[/C][C]-0.1717[/C][C]0.432183[/C][/ROW]
[ROW][C]42[/C][C]-0.020141[/C][C]-0.1424[/C][C]0.443662[/C][/ROW]
[ROW][C]43[/C][C]-0.005616[/C][C]-0.0397[/C][C]0.484242[/C][/ROW]
[ROW][C]44[/C][C]0.008177[/C][C]0.0578[/C][C]0.477062[/C][/ROW]
[ROW][C]45[/C][C]0.024913[/C][C]0.1762[/C][C]0.43044[/C][/ROW]
[ROW][C]46[/C][C]0.059114[/C][C]0.418[/C][C]0.338869[/C][/ROW]
[ROW][C]47[/C][C]0.089155[/C][C]0.6304[/C][C]0.265644[/C][/ROW]
[ROW][C]48[/C][C]0.108432[/C][C]0.7667[/C][C]0.223423[/C][/ROW]
[/TABLE]
Source: https://freestatistics.org/blog/index.php?pk=115545&T=2

Globally Unique Identifier (entire table): ba.freestatistics.org/blog/index.php?pk=115545&T=2

As an alternative you can also use a QR Code:  

The GUIDs for individual cells are displayed in the table below:

Partial Autocorrelation Function
Time lag kPACF(k)T-STATP-value
10.8994886.36030
2-0.031459-0.22250.412434
3-0.021518-0.15220.439839
4-0.009903-0.070.472226
50.0049940.03530.485985
60.0063670.0450.482136
7-0.00459-0.03250.48712
8-0.005788-0.04090.483758
9-0.007888-0.05580.47787
10-0.016778-0.11860.453018
11-0.019796-0.140.44462
12-0.015136-0.1070.457597
13-0.013969-0.09880.460857
14-0.016023-0.11330.455124
15-0.017393-0.1230.451304
16-0.017653-0.12480.45058
17-0.016802-0.11880.452953
18-0.012986-0.09180.463603
19-0.011517-0.08140.46771
20-0.011334-0.08010.468221
21-0.012051-0.08520.466216
22-0.008636-0.06110.475775
23-0.00945-0.06680.473496
24-0.026478-0.18720.42612
25-0.033911-0.23980.405737
26-0.032918-0.23280.408446
27-0.043307-0.30620.380351
28-0.045651-0.32280.374095
29-0.034657-0.24510.403705
30-0.033949-0.24010.405635
31-0.036145-0.25560.399661
32-0.034828-0.24630.40324
33-0.032227-0.22790.410335
34-0.030339-0.21450.415505
35-0.031847-0.22520.411375
36-0.030537-0.21590.414962
37-0.028708-0.2030.419981
38-0.026692-0.18870.42553
39-0.022533-0.15930.437024
40-0.020863-0.14750.441656
41-0.024282-0.17170.432183
42-0.020141-0.14240.443662
43-0.005616-0.03970.484242
440.0081770.05780.477062
450.0249130.17620.43044
460.0591140.4180.338869
470.0891550.63040.265644
480.1084320.76670.223423


Parameters (Session):
par1 = 48 ; par2 = 1 ; par3 = 0 ; par4 = 0 ; par5 = 12 ; par6 = White Noise ; par7 = 0.95 ;
Parameters (R input):
par1 = 48 ; par2 = 1 ; par3 = 0 ; par4 = 0 ; par5 = 12 ; par6 = White Noise ; par7 = 0.95 ; par8 = ;
R code (references can be found in the software module):
if (par1 == 'Default') {
par1 = 10*log10(length(x))
} else {
par1 <- as.numeric(par1)
}
par2 <- as.numeric(par2)
par3 <- as.numeric(par3)
par4 <- as.numeric(par4)
par5 <- as.numeric(par5)
if (par6 == 'White Noise') par6 <- 'white' else par6 <- 'ma'
par7 <- as.numeric(par7)
if (par8 != '') par8 <- as.numeric(par8)
ox <- x
if (par8 == '') {
if (par2 == 0) {
x <- log(x)
} else {
x <- (x ^ par2 - 1) / par2
}
} else {
x <- log(x,base=par8)
}
if (par3 > 0) x <- diff(x,lag=1,difference=par3)
if (par4 > 0) x <- diff(x,lag=par5,difference=par4)
bitmap(file='picts.png')
op <- par(mfrow=c(2,1))
plot(ox,type='l',main='Original Time Series',xlab='time',ylab='value')
if (par8=='') {
mytitle <- paste('Working Time Series (lambda=',par2,', d=',par3,', D=',par4,')',sep='')
mysub <- paste('(lambda=',par2,', d=',par3,', D=',par4,', CI=', par7, ', CI type=',par6,')',sep='')
} else {
mytitle <- paste('Working Time Series (base=',par8,', d=',par3,', D=',par4,')',sep='')
mysub <- paste('(base=',par8,', d=',par3,', D=',par4,', CI=', par7, ', CI type=',par6,')',sep='')
}
plot(x,type='l', main=mytitle,xlab='time',ylab='value')
par(op)
dev.off()
bitmap(file='pic1.png')
racf <- acf(x, par1, main='Autocorrelation', xlab='time lag', ylab='ACF', ci.type=par6, ci=par7, sub=mysub)
dev.off()
bitmap(file='pic2.png')
rpacf <- pacf(x,par1,main='Partial Autocorrelation',xlab='lags',ylab='PACF',sub=mysub)
dev.off()
(myacf <- c(racf$acf))
(mypacf <- c(rpacf$acf))
lengthx <- length(x)
sqrtn <- sqrt(lengthx)
load(file='createtable')
a<-table.start()
a<-table.row.start(a)
a<-table.element(a,'Autocorrelation Function',4,TRUE)
a<-table.row.end(a)
a<-table.row.start(a)
a<-table.element(a,'Time lag k',header=TRUE)
a<-table.element(a,hyperlink('basics.htm','ACF(k)','click here for more information about the Autocorrelation Function'),header=TRUE)
a<-table.element(a,'T-STAT',header=TRUE)
a<-table.element(a,'P-value',header=TRUE)
a<-table.row.end(a)
for (i in 2:(par1+1)) {
a<-table.row.start(a)
a<-table.element(a,i-1,header=TRUE)
a<-table.element(a,round(myacf[i],6))
mytstat <- myacf[i]*sqrtn
a<-table.element(a,round(mytstat,4))
a<-table.element(a,round(1-pt(abs(mytstat),lengthx),6))
a<-table.row.end(a)
}
a<-table.end(a)
table.save(a,file='mytable.tab')
a<-table.start()
a<-table.row.start(a)
a<-table.element(a,'Partial Autocorrelation Function',4,TRUE)
a<-table.row.end(a)
a<-table.row.start(a)
a<-table.element(a,'Time lag k',header=TRUE)
a<-table.element(a,hyperlink('basics.htm','PACF(k)','click here for more information about the Partial Autocorrelation Function'),header=TRUE)
a<-table.element(a,'T-STAT',header=TRUE)
a<-table.element(a,'P-value',header=TRUE)
a<-table.row.end(a)
for (i in 1:par1) {
a<-table.row.start(a)
a<-table.element(a,i,header=TRUE)
a<-table.element(a,round(mypacf[i],6))
mytstat <- mypacf[i]*sqrtn
a<-table.element(a,round(mytstat,4))
a<-table.element(a,round(1-pt(abs(mytstat),lengthx),6))
a<-table.row.end(a)
}
a<-table.end(a)
table.save(a,file='mytable1.tab')