Free Statistics

of Irreproducible Research!

Author's title

Author*The author of this computation has been verified*
R Software Modulerwasp_arimabackwardselection.wasp
Title produced by softwareARIMA Backward Selection
Date of computationSun, 26 Dec 2010 11:01:32 +0000
Cite this page as followsStatistical Computations at FreeStatistics.org, Office for Research Development and Education, URL https://freestatistics.org/blog/index.php?v=date/2010/Dec/26/t1293361165bv8zhj733p1xz3f.htm/, Retrieved Mon, 06 May 2024 17:05:47 +0000
Statistical Computations at FreeStatistics.org, Office for Research Development and Education, URL https://freestatistics.org/blog/index.php?pk=115512, Retrieved Mon, 06 May 2024 17:05:47 +0000
QR Codes:

Original text written by user:
IsPrivate?No (this computation is public)
User-defined keywords
Estimated Impact161
Family? (F = Feedback message, R = changed R code, M = changed R Module, P = changed Parameters, D = changed Data)
-       [ARIMA Backward Selection] [tijdreeks bevolki...] [2010-12-26 11:01:32] [531024149246456e4f6d79ace2e85c12] [Current]
Feedback Forum

Post a new message
Dataseries X:
5140
4749
3635
4305
5805
4260
3869
7325
9280
6222
3272
7598
1345
1900
1480
1472
3823
4454
3357
5393
8329
4152
4042
7747
1451
911
-406
1387
2150
1577
2642
4273
8064
3243
1112
2280
505
744
-1369
-531
1041
2076
577
5080
6584
3761
294
5020
1141
3805
2127
2531
3682
3263
2798
5936
10568
5296
1870
4390
3707
5201
3748
5282
5349
6249
5517
8640
15767
8850
5582
6496
3255
6189
6452
5099
6833
7046
7739
10142
16054
7721
6182
6490
3704
6235
4655
5072
3640
5147
5703
11889
15603
9589


Summary of computational transaction
Raw Inputview raw input (R code)
Raw Outputview raw output of R engine
Computing time13 seconds
R Server'Sir Ronald Aylmer Fisher' @ 193.190.124.24

\begin{tabular}{lllllllll}
\hline
Summary of computational transaction \tabularnewline
Raw Input & view raw input (R code)  \tabularnewline
Raw Output & view raw output of R engine  \tabularnewline
Computing time & 13 seconds \tabularnewline
R Server & 'Sir Ronald Aylmer Fisher' @ 193.190.124.24 \tabularnewline
\hline
\end{tabular}
%Source: https://freestatistics.org/blog/index.php?pk=115512&T=0

[TABLE]
[ROW][C]Summary of computational transaction[/C][/ROW]
[ROW][C]Raw Input[/C][C]view raw input (R code) [/C][/ROW]
[ROW][C]Raw Output[/C][C]view raw output of R engine [/C][/ROW]
[ROW][C]Computing time[/C][C]13 seconds[/C][/ROW]
[ROW][C]R Server[/C][C]'Sir Ronald Aylmer Fisher' @ 193.190.124.24[/C][/ROW]
[/TABLE]
Source: https://freestatistics.org/blog/index.php?pk=115512&T=0

Globally Unique Identifier (entire table): ba.freestatistics.org/blog/index.php?pk=115512&T=0

As an alternative you can also use a QR Code:  

The GUIDs for individual cells are displayed in the table below:

Summary of computational transaction
Raw Inputview raw input (R code)
Raw Outputview raw output of R engine
Computing time13 seconds
R Server'Sir Ronald Aylmer Fisher' @ 193.190.124.24


ARIMA Parameter Estimation and Backward Selection
Iterationar1ar2ar3ma1sar1sar2sma1
Estimates ( 1 )-0.09620.0142-0.2898-0.40790.22620.1754-0.6828
(p-val)(0.7169 )(0.9307 )(0.0186 )(0.1328 )(0.7768 )(0.656 )(0.3896 )
Estimates ( 2 )-0.11190-0.2932-0.39130.25020.1858-0.7071
(p-val)(0.5643 )(NA )(0.0122 )(0.0355 )(0.7609 )(0.6495 )(0.3875 )
Estimates ( 3 )-0.11390-0.2895-0.386200.0775-0.4597
(p-val)(0.5603 )(NA )(0.0129 )(0.0386 )(NA )(0.5829 )(6e-04 )
Estimates ( 4 )-0.09670-0.293-0.403200-0.4487
(p-val)(0.6082 )(NA )(0.0119 )(0.0246 )(NA )(NA )(5e-04 )
Estimates ( 5 )00-0.2858-0.473900-0.4637
(p-val)(NA )(NA )(0.0165 )(0 )(NA )(NA )(2e-04 )
Estimates ( 6 )NANANANANANANA
(p-val)(NA )(NA )(NA )(NA )(NA )(NA )(NA )
Estimates ( 7 )NANANANANANANA
(p-val)(NA )(NA )(NA )(NA )(NA )(NA )(NA )
Estimates ( 8 )NANANANANANANA
(p-val)(NA )(NA )(NA )(NA )(NA )(NA )(NA )
Estimates ( 9 )NANANANANANANA
(p-val)(NA )(NA )(NA )(NA )(NA )(NA )(NA )
Estimates ( 10 )NANANANANANANA
(p-val)(NA )(NA )(NA )(NA )(NA )(NA )(NA )
Estimates ( 11 )NANANANANANANA
(p-val)(NA )(NA )(NA )(NA )(NA )(NA )(NA )
Estimates ( 12 )NANANANANANANA
(p-val)(NA )(NA )(NA )(NA )(NA )(NA )(NA )
Estimates ( 13 )NANANANANANANA
(p-val)(NA )(NA )(NA )(NA )(NA )(NA )(NA )

\begin{tabular}{lllllllll}
\hline
ARIMA Parameter Estimation and Backward Selection \tabularnewline
Iteration & ar1 & ar2 & ar3 & ma1 & sar1 & sar2 & sma1 \tabularnewline
Estimates ( 1 ) & -0.0962 & 0.0142 & -0.2898 & -0.4079 & 0.2262 & 0.1754 & -0.6828 \tabularnewline
(p-val) & (0.7169 ) & (0.9307 ) & (0.0186 ) & (0.1328 ) & (0.7768 ) & (0.656 ) & (0.3896 ) \tabularnewline
Estimates ( 2 ) & -0.1119 & 0 & -0.2932 & -0.3913 & 0.2502 & 0.1858 & -0.7071 \tabularnewline
(p-val) & (0.5643 ) & (NA ) & (0.0122 ) & (0.0355 ) & (0.7609 ) & (0.6495 ) & (0.3875 ) \tabularnewline
Estimates ( 3 ) & -0.1139 & 0 & -0.2895 & -0.3862 & 0 & 0.0775 & -0.4597 \tabularnewline
(p-val) & (0.5603 ) & (NA ) & (0.0129 ) & (0.0386 ) & (NA ) & (0.5829 ) & (6e-04 ) \tabularnewline
Estimates ( 4 ) & -0.0967 & 0 & -0.293 & -0.4032 & 0 & 0 & -0.4487 \tabularnewline
(p-val) & (0.6082 ) & (NA ) & (0.0119 ) & (0.0246 ) & (NA ) & (NA ) & (5e-04 ) \tabularnewline
Estimates ( 5 ) & 0 & 0 & -0.2858 & -0.4739 & 0 & 0 & -0.4637 \tabularnewline
(p-val) & (NA ) & (NA ) & (0.0165 ) & (0 ) & (NA ) & (NA ) & (2e-04 ) \tabularnewline
Estimates ( 6 ) & NA & NA & NA & NA & NA & NA & NA \tabularnewline
(p-val) & (NA ) & (NA ) & (NA ) & (NA ) & (NA ) & (NA ) & (NA ) \tabularnewline
Estimates ( 7 ) & NA & NA & NA & NA & NA & NA & NA \tabularnewline
(p-val) & (NA ) & (NA ) & (NA ) & (NA ) & (NA ) & (NA ) & (NA ) \tabularnewline
Estimates ( 8 ) & NA & NA & NA & NA & NA & NA & NA \tabularnewline
(p-val) & (NA ) & (NA ) & (NA ) & (NA ) & (NA ) & (NA ) & (NA ) \tabularnewline
Estimates ( 9 ) & NA & NA & NA & NA & NA & NA & NA \tabularnewline
(p-val) & (NA ) & (NA ) & (NA ) & (NA ) & (NA ) & (NA ) & (NA ) \tabularnewline
Estimates ( 10 ) & NA & NA & NA & NA & NA & NA & NA \tabularnewline
(p-val) & (NA ) & (NA ) & (NA ) & (NA ) & (NA ) & (NA ) & (NA ) \tabularnewline
Estimates ( 11 ) & NA & NA & NA & NA & NA & NA & NA \tabularnewline
(p-val) & (NA ) & (NA ) & (NA ) & (NA ) & (NA ) & (NA ) & (NA ) \tabularnewline
Estimates ( 12 ) & NA & NA & NA & NA & NA & NA & NA \tabularnewline
(p-val) & (NA ) & (NA ) & (NA ) & (NA ) & (NA ) & (NA ) & (NA ) \tabularnewline
Estimates ( 13 ) & NA & NA & NA & NA & NA & NA & NA \tabularnewline
(p-val) & (NA ) & (NA ) & (NA ) & (NA ) & (NA ) & (NA ) & (NA ) \tabularnewline
\hline
\end{tabular}
%Source: https://freestatistics.org/blog/index.php?pk=115512&T=1

[TABLE]
[ROW][C]ARIMA Parameter Estimation and Backward Selection[/C][/ROW]
[ROW][C]Iteration[/C][C]ar1[/C][C]ar2[/C][C]ar3[/C][C]ma1[/C][C]sar1[/C][C]sar2[/C][C]sma1[/C][/ROW]
[ROW][C]Estimates ( 1 )[/C][C]-0.0962[/C][C]0.0142[/C][C]-0.2898[/C][C]-0.4079[/C][C]0.2262[/C][C]0.1754[/C][C]-0.6828[/C][/ROW]
[ROW][C](p-val)[/C][C](0.7169 )[/C][C](0.9307 )[/C][C](0.0186 )[/C][C](0.1328 )[/C][C](0.7768 )[/C][C](0.656 )[/C][C](0.3896 )[/C][/ROW]
[ROW][C]Estimates ( 2 )[/C][C]-0.1119[/C][C]0[/C][C]-0.2932[/C][C]-0.3913[/C][C]0.2502[/C][C]0.1858[/C][C]-0.7071[/C][/ROW]
[ROW][C](p-val)[/C][C](0.5643 )[/C][C](NA )[/C][C](0.0122 )[/C][C](0.0355 )[/C][C](0.7609 )[/C][C](0.6495 )[/C][C](0.3875 )[/C][/ROW]
[ROW][C]Estimates ( 3 )[/C][C]-0.1139[/C][C]0[/C][C]-0.2895[/C][C]-0.3862[/C][C]0[/C][C]0.0775[/C][C]-0.4597[/C][/ROW]
[ROW][C](p-val)[/C][C](0.5603 )[/C][C](NA )[/C][C](0.0129 )[/C][C](0.0386 )[/C][C](NA )[/C][C](0.5829 )[/C][C](6e-04 )[/C][/ROW]
[ROW][C]Estimates ( 4 )[/C][C]-0.0967[/C][C]0[/C][C]-0.293[/C][C]-0.4032[/C][C]0[/C][C]0[/C][C]-0.4487[/C][/ROW]
[ROW][C](p-val)[/C][C](0.6082 )[/C][C](NA )[/C][C](0.0119 )[/C][C](0.0246 )[/C][C](NA )[/C][C](NA )[/C][C](5e-04 )[/C][/ROW]
[ROW][C]Estimates ( 5 )[/C][C]0[/C][C]0[/C][C]-0.2858[/C][C]-0.4739[/C][C]0[/C][C]0[/C][C]-0.4637[/C][/ROW]
[ROW][C](p-val)[/C][C](NA )[/C][C](NA )[/C][C](0.0165 )[/C][C](0 )[/C][C](NA )[/C][C](NA )[/C][C](2e-04 )[/C][/ROW]
[ROW][C]Estimates ( 6 )[/C][C]NA[/C][C]NA[/C][C]NA[/C][C]NA[/C][C]NA[/C][C]NA[/C][C]NA[/C][/ROW]
[ROW][C](p-val)[/C][C](NA )[/C][C](NA )[/C][C](NA )[/C][C](NA )[/C][C](NA )[/C][C](NA )[/C][C](NA )[/C][/ROW]
[ROW][C]Estimates ( 7 )[/C][C]NA[/C][C]NA[/C][C]NA[/C][C]NA[/C][C]NA[/C][C]NA[/C][C]NA[/C][/ROW]
[ROW][C](p-val)[/C][C](NA )[/C][C](NA )[/C][C](NA )[/C][C](NA )[/C][C](NA )[/C][C](NA )[/C][C](NA )[/C][/ROW]
[ROW][C]Estimates ( 8 )[/C][C]NA[/C][C]NA[/C][C]NA[/C][C]NA[/C][C]NA[/C][C]NA[/C][C]NA[/C][/ROW]
[ROW][C](p-val)[/C][C](NA )[/C][C](NA )[/C][C](NA )[/C][C](NA )[/C][C](NA )[/C][C](NA )[/C][C](NA )[/C][/ROW]
[ROW][C]Estimates ( 9 )[/C][C]NA[/C][C]NA[/C][C]NA[/C][C]NA[/C][C]NA[/C][C]NA[/C][C]NA[/C][/ROW]
[ROW][C](p-val)[/C][C](NA )[/C][C](NA )[/C][C](NA )[/C][C](NA )[/C][C](NA )[/C][C](NA )[/C][C](NA )[/C][/ROW]
[ROW][C]Estimates ( 10 )[/C][C]NA[/C][C]NA[/C][C]NA[/C][C]NA[/C][C]NA[/C][C]NA[/C][C]NA[/C][/ROW]
[ROW][C](p-val)[/C][C](NA )[/C][C](NA )[/C][C](NA )[/C][C](NA )[/C][C](NA )[/C][C](NA )[/C][C](NA )[/C][/ROW]
[ROW][C]Estimates ( 11 )[/C][C]NA[/C][C]NA[/C][C]NA[/C][C]NA[/C][C]NA[/C][C]NA[/C][C]NA[/C][/ROW]
[ROW][C](p-val)[/C][C](NA )[/C][C](NA )[/C][C](NA )[/C][C](NA )[/C][C](NA )[/C][C](NA )[/C][C](NA )[/C][/ROW]
[ROW][C]Estimates ( 12 )[/C][C]NA[/C][C]NA[/C][C]NA[/C][C]NA[/C][C]NA[/C][C]NA[/C][C]NA[/C][/ROW]
[ROW][C](p-val)[/C][C](NA )[/C][C](NA )[/C][C](NA )[/C][C](NA )[/C][C](NA )[/C][C](NA )[/C][C](NA )[/C][/ROW]
[ROW][C]Estimates ( 13 )[/C][C]NA[/C][C]NA[/C][C]NA[/C][C]NA[/C][C]NA[/C][C]NA[/C][C]NA[/C][/ROW]
[ROW][C](p-val)[/C][C](NA )[/C][C](NA )[/C][C](NA )[/C][C](NA )[/C][C](NA )[/C][C](NA )[/C][C](NA )[/C][/ROW]
[/TABLE]
Source: https://freestatistics.org/blog/index.php?pk=115512&T=1

Globally Unique Identifier (entire table): ba.freestatistics.org/blog/index.php?pk=115512&T=1

As an alternative you can also use a QR Code:  

The GUIDs for individual cells are displayed in the table below:

ARIMA Parameter Estimation and Backward Selection
Iterationar1ar2ar3ma1sar1sar2sma1
Estimates ( 1 )-0.09620.0142-0.2898-0.40790.22620.1754-0.6828
(p-val)(0.7169 )(0.9307 )(0.0186 )(0.1328 )(0.7768 )(0.656 )(0.3896 )
Estimates ( 2 )-0.11190-0.2932-0.39130.25020.1858-0.7071
(p-val)(0.5643 )(NA )(0.0122 )(0.0355 )(0.7609 )(0.6495 )(0.3875 )
Estimates ( 3 )-0.11390-0.2895-0.386200.0775-0.4597
(p-val)(0.5603 )(NA )(0.0129 )(0.0386 )(NA )(0.5829 )(6e-04 )
Estimates ( 4 )-0.09670-0.293-0.403200-0.4487
(p-val)(0.6082 )(NA )(0.0119 )(0.0246 )(NA )(NA )(5e-04 )
Estimates ( 5 )00-0.2858-0.473900-0.4637
(p-val)(NA )(NA )(0.0165 )(0 )(NA )(NA )(2e-04 )
Estimates ( 6 )NANANANANANANA
(p-val)(NA )(NA )(NA )(NA )(NA )(NA )(NA )
Estimates ( 7 )NANANANANANANA
(p-val)(NA )(NA )(NA )(NA )(NA )(NA )(NA )
Estimates ( 8 )NANANANANANANA
(p-val)(NA )(NA )(NA )(NA )(NA )(NA )(NA )
Estimates ( 9 )NANANANANANANA
(p-val)(NA )(NA )(NA )(NA )(NA )(NA )(NA )
Estimates ( 10 )NANANANANANANA
(p-val)(NA )(NA )(NA )(NA )(NA )(NA )(NA )
Estimates ( 11 )NANANANANANANA
(p-val)(NA )(NA )(NA )(NA )(NA )(NA )(NA )
Estimates ( 12 )NANANANANANANA
(p-val)(NA )(NA )(NA )(NA )(NA )(NA )(NA )
Estimates ( 13 )NANANANANANANA
(p-val)(NA )(NA )(NA )(NA )(NA )(NA )(NA )


Estimated ARIMA Residuals
Value
-35.3435133664127
735.779788488768
955.011310647343
-290.668576389876
845.457823089616
2579.47871164211
385.269211776245
-954.22831285084
977.665049671294
-670.378155454014
1783.68890831396
599.17768449382
-306.05575135961
-175.099428721379
-932.602211346187
1029.03976632086
-904.415557826226
-1053.26517432083
1844.18332299007
-356.379344546617
857.306750984881
-13.7451216698112
-1340.6211118758
-3017.55213999663
2583.68938236593
1622.93461861651
-1162.13194268864
407.836156293812
526.210290108706
1357.48624645898
-1134.23515025152
1911.24295353139
-323.116440790442
734.280771682742
-593.610171709216
1425.73598268279
1072.12838073572
2525.21279674917
1915.02265171032
153.925519723542
471.157995592958
-664.419962827784
-254.068981741514
-430.824418914287
1905.60967838185
-686.787415315728
-1271.35377048867
-1053.38854394804
2059.358210861
920.00641200783
238.966288268096
1906.27899023564
-365.317602349184
749.534328165537
500.112135309282
-303.997942417405
3689.33951047561
-646.446430765791
-712.027148497686
-1389.05653602710
-2641.65569443606
214.049382604967
1411.89687216002
-2089.18239774381
458.533202249733
564.32671176953
828.874902740321
13.7099192992408
229.730229724078
-1980.68471896011
379.831474433581
-1135.99041714126
-1410.43565983884
152.861165573394
-1403.13226387818
-33.5389414436732
-2542.6701473046
-407.327393927973
612.401990988205
2945.13446352319
-164.728983720217
1069.53207452312

\begin{tabular}{lllllllll}
\hline
Estimated ARIMA Residuals \tabularnewline
Value \tabularnewline
-35.3435133664127 \tabularnewline
735.779788488768 \tabularnewline
955.011310647343 \tabularnewline
-290.668576389876 \tabularnewline
845.457823089616 \tabularnewline
2579.47871164211 \tabularnewline
385.269211776245 \tabularnewline
-954.22831285084 \tabularnewline
977.665049671294 \tabularnewline
-670.378155454014 \tabularnewline
1783.68890831396 \tabularnewline
599.17768449382 \tabularnewline
-306.05575135961 \tabularnewline
-175.099428721379 \tabularnewline
-932.602211346187 \tabularnewline
1029.03976632086 \tabularnewline
-904.415557826226 \tabularnewline
-1053.26517432083 \tabularnewline
1844.18332299007 \tabularnewline
-356.379344546617 \tabularnewline
857.306750984881 \tabularnewline
-13.7451216698112 \tabularnewline
-1340.6211118758 \tabularnewline
-3017.55213999663 \tabularnewline
2583.68938236593 \tabularnewline
1622.93461861651 \tabularnewline
-1162.13194268864 \tabularnewline
407.836156293812 \tabularnewline
526.210290108706 \tabularnewline
1357.48624645898 \tabularnewline
-1134.23515025152 \tabularnewline
1911.24295353139 \tabularnewline
-323.116440790442 \tabularnewline
734.280771682742 \tabularnewline
-593.610171709216 \tabularnewline
1425.73598268279 \tabularnewline
1072.12838073572 \tabularnewline
2525.21279674917 \tabularnewline
1915.02265171032 \tabularnewline
153.925519723542 \tabularnewline
471.157995592958 \tabularnewline
-664.419962827784 \tabularnewline
-254.068981741514 \tabularnewline
-430.824418914287 \tabularnewline
1905.60967838185 \tabularnewline
-686.787415315728 \tabularnewline
-1271.35377048867 \tabularnewline
-1053.38854394804 \tabularnewline
2059.358210861 \tabularnewline
920.00641200783 \tabularnewline
238.966288268096 \tabularnewline
1906.27899023564 \tabularnewline
-365.317602349184 \tabularnewline
749.534328165537 \tabularnewline
500.112135309282 \tabularnewline
-303.997942417405 \tabularnewline
3689.33951047561 \tabularnewline
-646.446430765791 \tabularnewline
-712.027148497686 \tabularnewline
-1389.05653602710 \tabularnewline
-2641.65569443606 \tabularnewline
214.049382604967 \tabularnewline
1411.89687216002 \tabularnewline
-2089.18239774381 \tabularnewline
458.533202249733 \tabularnewline
564.32671176953 \tabularnewline
828.874902740321 \tabularnewline
13.7099192992408 \tabularnewline
229.730229724078 \tabularnewline
-1980.68471896011 \tabularnewline
379.831474433581 \tabularnewline
-1135.99041714126 \tabularnewline
-1410.43565983884 \tabularnewline
152.861165573394 \tabularnewline
-1403.13226387818 \tabularnewline
-33.5389414436732 \tabularnewline
-2542.6701473046 \tabularnewline
-407.327393927973 \tabularnewline
612.401990988205 \tabularnewline
2945.13446352319 \tabularnewline
-164.728983720217 \tabularnewline
1069.53207452312 \tabularnewline
\hline
\end{tabular}
%Source: https://freestatistics.org/blog/index.php?pk=115512&T=2

[TABLE]
[ROW][C]Estimated ARIMA Residuals[/C][/ROW]
[ROW][C]Value[/C][/ROW]
[ROW][C]-35.3435133664127[/C][/ROW]
[ROW][C]735.779788488768[/C][/ROW]
[ROW][C]955.011310647343[/C][/ROW]
[ROW][C]-290.668576389876[/C][/ROW]
[ROW][C]845.457823089616[/C][/ROW]
[ROW][C]2579.47871164211[/C][/ROW]
[ROW][C]385.269211776245[/C][/ROW]
[ROW][C]-954.22831285084[/C][/ROW]
[ROW][C]977.665049671294[/C][/ROW]
[ROW][C]-670.378155454014[/C][/ROW]
[ROW][C]1783.68890831396[/C][/ROW]
[ROW][C]599.17768449382[/C][/ROW]
[ROW][C]-306.05575135961[/C][/ROW]
[ROW][C]-175.099428721379[/C][/ROW]
[ROW][C]-932.602211346187[/C][/ROW]
[ROW][C]1029.03976632086[/C][/ROW]
[ROW][C]-904.415557826226[/C][/ROW]
[ROW][C]-1053.26517432083[/C][/ROW]
[ROW][C]1844.18332299007[/C][/ROW]
[ROW][C]-356.379344546617[/C][/ROW]
[ROW][C]857.306750984881[/C][/ROW]
[ROW][C]-13.7451216698112[/C][/ROW]
[ROW][C]-1340.6211118758[/C][/ROW]
[ROW][C]-3017.55213999663[/C][/ROW]
[ROW][C]2583.68938236593[/C][/ROW]
[ROW][C]1622.93461861651[/C][/ROW]
[ROW][C]-1162.13194268864[/C][/ROW]
[ROW][C]407.836156293812[/C][/ROW]
[ROW][C]526.210290108706[/C][/ROW]
[ROW][C]1357.48624645898[/C][/ROW]
[ROW][C]-1134.23515025152[/C][/ROW]
[ROW][C]1911.24295353139[/C][/ROW]
[ROW][C]-323.116440790442[/C][/ROW]
[ROW][C]734.280771682742[/C][/ROW]
[ROW][C]-593.610171709216[/C][/ROW]
[ROW][C]1425.73598268279[/C][/ROW]
[ROW][C]1072.12838073572[/C][/ROW]
[ROW][C]2525.21279674917[/C][/ROW]
[ROW][C]1915.02265171032[/C][/ROW]
[ROW][C]153.925519723542[/C][/ROW]
[ROW][C]471.157995592958[/C][/ROW]
[ROW][C]-664.419962827784[/C][/ROW]
[ROW][C]-254.068981741514[/C][/ROW]
[ROW][C]-430.824418914287[/C][/ROW]
[ROW][C]1905.60967838185[/C][/ROW]
[ROW][C]-686.787415315728[/C][/ROW]
[ROW][C]-1271.35377048867[/C][/ROW]
[ROW][C]-1053.38854394804[/C][/ROW]
[ROW][C]2059.358210861[/C][/ROW]
[ROW][C]920.00641200783[/C][/ROW]
[ROW][C]238.966288268096[/C][/ROW]
[ROW][C]1906.27899023564[/C][/ROW]
[ROW][C]-365.317602349184[/C][/ROW]
[ROW][C]749.534328165537[/C][/ROW]
[ROW][C]500.112135309282[/C][/ROW]
[ROW][C]-303.997942417405[/C][/ROW]
[ROW][C]3689.33951047561[/C][/ROW]
[ROW][C]-646.446430765791[/C][/ROW]
[ROW][C]-712.027148497686[/C][/ROW]
[ROW][C]-1389.05653602710[/C][/ROW]
[ROW][C]-2641.65569443606[/C][/ROW]
[ROW][C]214.049382604967[/C][/ROW]
[ROW][C]1411.89687216002[/C][/ROW]
[ROW][C]-2089.18239774381[/C][/ROW]
[ROW][C]458.533202249733[/C][/ROW]
[ROW][C]564.32671176953[/C][/ROW]
[ROW][C]828.874902740321[/C][/ROW]
[ROW][C]13.7099192992408[/C][/ROW]
[ROW][C]229.730229724078[/C][/ROW]
[ROW][C]-1980.68471896011[/C][/ROW]
[ROW][C]379.831474433581[/C][/ROW]
[ROW][C]-1135.99041714126[/C][/ROW]
[ROW][C]-1410.43565983884[/C][/ROW]
[ROW][C]152.861165573394[/C][/ROW]
[ROW][C]-1403.13226387818[/C][/ROW]
[ROW][C]-33.5389414436732[/C][/ROW]
[ROW][C]-2542.6701473046[/C][/ROW]
[ROW][C]-407.327393927973[/C][/ROW]
[ROW][C]612.401990988205[/C][/ROW]
[ROW][C]2945.13446352319[/C][/ROW]
[ROW][C]-164.728983720217[/C][/ROW]
[ROW][C]1069.53207452312[/C][/ROW]
[/TABLE]
Source: https://freestatistics.org/blog/index.php?pk=115512&T=2

Globally Unique Identifier (entire table): ba.freestatistics.org/blog/index.php?pk=115512&T=2

As an alternative you can also use a QR Code:  

The GUIDs for individual cells are displayed in the table below:

Estimated ARIMA Residuals
Value
-35.3435133664127
735.779788488768
955.011310647343
-290.668576389876
845.457823089616
2579.47871164211
385.269211776245
-954.22831285084
977.665049671294
-670.378155454014
1783.68890831396
599.17768449382
-306.05575135961
-175.099428721379
-932.602211346187
1029.03976632086
-904.415557826226
-1053.26517432083
1844.18332299007
-356.379344546617
857.306750984881
-13.7451216698112
-1340.6211118758
-3017.55213999663
2583.68938236593
1622.93461861651
-1162.13194268864
407.836156293812
526.210290108706
1357.48624645898
-1134.23515025152
1911.24295353139
-323.116440790442
734.280771682742
-593.610171709216
1425.73598268279
1072.12838073572
2525.21279674917
1915.02265171032
153.925519723542
471.157995592958
-664.419962827784
-254.068981741514
-430.824418914287
1905.60967838185
-686.787415315728
-1271.35377048867
-1053.38854394804
2059.358210861
920.00641200783
238.966288268096
1906.27899023564
-365.317602349184
749.534328165537
500.112135309282
-303.997942417405
3689.33951047561
-646.446430765791
-712.027148497686
-1389.05653602710
-2641.65569443606
214.049382604967
1411.89687216002
-2089.18239774381
458.533202249733
564.32671176953
828.874902740321
13.7099192992408
229.730229724078
-1980.68471896011
379.831474433581
-1135.99041714126
-1410.43565983884
152.861165573394
-1403.13226387818
-33.5389414436732
-2542.6701473046
-407.327393927973
612.401990988205
2945.13446352319
-164.728983720217
1069.53207452312


Parameters (Session):
par1 = FALSE ; par2 = 1 ; par3 = 1 ; par4 = 1 ; par5 = 12 ; par6 = 3 ; par7 = 1 ; par8 = 2 ; par9 = 1 ;
Parameters (R input):
par1 = FALSE ; par2 = 1 ; par3 = 1 ; par4 = 1 ; par5 = 12 ; par6 = 3 ; par7 = 1 ; par8 = 2 ; par9 = 1 ;
R code (references can be found in the software module):
library(lattice)
if (par1 == 'TRUE') par1 <- TRUE
if (par1 == 'FALSE') par1 <- FALSE
par2 <- as.numeric(par2) #Box-Cox lambda transformation parameter
par3 <- as.numeric(par3) #degree of non-seasonal differencing
par4 <- as.numeric(par4) #degree of seasonal differencing
par5 <- as.numeric(par5) #seasonal period
par6 <- as.numeric(par6) #degree (p) of the non-seasonal AR(p) polynomial
par7 <- as.numeric(par7) #degree (q) of the non-seasonal MA(q) polynomial
par8 <- as.numeric(par8) #degree (P) of the seasonal AR(P) polynomial
par9 <- as.numeric(par9) #degree (Q) of the seasonal MA(Q) polynomial
armaGR <- function(arima.out, names, n){
try1 <- arima.out$coef
try2 <- sqrt(diag(arima.out$var.coef))
try.data.frame <- data.frame(matrix(NA,ncol=4,nrow=length(names)))
dimnames(try.data.frame) <- list(names,c('coef','std','tstat','pv'))
try.data.frame[,1] <- try1
for(i in 1:length(try2)) try.data.frame[which(rownames(try.data.frame)==names(try2)[i]),2] <- try2[i]
try.data.frame[,3] <- try.data.frame[,1] / try.data.frame[,2]
try.data.frame[,4] <- round((1-pt(abs(try.data.frame[,3]),df=n-(length(try2)+1)))*2,5)
vector <- rep(NA,length(names))
vector[is.na(try.data.frame[,4])] <- 0
maxi <- which.max(try.data.frame[,4])
continue <- max(try.data.frame[,4],na.rm=TRUE) > .05
vector[maxi] <- 0
list(summary=try.data.frame,next.vector=vector,continue=continue)
}
arimaSelect <- function(series, order=c(13,0,0), seasonal=list(order=c(2,0,0),period=12), include.mean=F){
nrc <- order[1]+order[3]+seasonal$order[1]+seasonal$order[3]
coeff <- matrix(NA, nrow=nrc*2, ncol=nrc)
pval <- matrix(NA, nrow=nrc*2, ncol=nrc)
mylist <- rep(list(NULL), nrc)
names <- NULL
if(order[1] > 0) names <- paste('ar',1:order[1],sep='')
if(order[3] > 0) names <- c( names , paste('ma',1:order[3],sep='') )
if(seasonal$order[1] > 0) names <- c(names, paste('sar',1:seasonal$order[1],sep=''))
if(seasonal$order[3] > 0) names <- c(names, paste('sma',1:seasonal$order[3],sep=''))
arima.out <- arima(series, order=order, seasonal=seasonal, include.mean=include.mean, method='ML')
mylist[[1]] <- arima.out
last.arma <- armaGR(arima.out, names, length(series))
mystop <- FALSE
i <- 1
coeff[i,] <- last.arma[[1]][,1]
pval [i,] <- last.arma[[1]][,4]
i <- 2
aic <- arima.out$aic
while(!mystop){
mylist[[i]] <- arima.out
arima.out <- arima(series, order=order, seasonal=seasonal, include.mean=include.mean, method='ML', fixed=last.arma$next.vector)
aic <- c(aic, arima.out$aic)
last.arma <- armaGR(arima.out, names, length(series))
mystop <- !last.arma$continue
coeff[i,] <- last.arma[[1]][,1]
pval [i,] <- last.arma[[1]][,4]
i <- i+1
}
list(coeff, pval, mylist, aic=aic)
}
arimaSelectplot <- function(arimaSelect.out,noms,choix){
noms <- names(arimaSelect.out[[3]][[1]]$coef)
coeff <- arimaSelect.out[[1]]
k <- min(which(is.na(coeff[,1])))-1
coeff <- coeff[1:k,]
pval <- arimaSelect.out[[2]][1:k,]
aic <- arimaSelect.out$aic[1:k]
coeff[coeff==0] <- NA
n <- ncol(coeff)
if(missing(choix)) choix <- k
layout(matrix(c(1,1,1,2,
3,3,3,2,
3,3,3,4,
5,6,7,7),nr=4),
widths=c(10,35,45,15),
heights=c(30,30,15,15))
couleurs <- rainbow(75)[1:50]#(50)
ticks <- pretty(coeff)
par(mar=c(1,1,3,1))
plot(aic,k:1-.5,type='o',pch=21,bg='blue',cex=2,axes=F,lty=2,xpd=NA)
points(aic[choix],k-choix+.5,pch=21,cex=4,bg=2,xpd=NA)
title('aic',line=2)
par(mar=c(3,0,0,0))
plot(0,axes=F,xlab='',ylab='',xlim=range(ticks),ylim=c(.1,1))
rect(xleft = min(ticks) + (0:49)/50*(max(ticks)-min(ticks)),
xright = min(ticks) + (1:50)/50*(max(ticks)-min(ticks)),
ytop = rep(1,50),
ybottom= rep(0,50),col=couleurs,border=NA)
axis(1,ticks)
rect(xleft=min(ticks),xright=max(ticks),ytop=1,ybottom=0)
text(mean(coeff,na.rm=T),.5,'coefficients',cex=2,font=2)
par(mar=c(1,1,3,1))
image(1:n,1:k,t(coeff[k:1,]),axes=F,col=couleurs,zlim=range(ticks))
for(i in 1:n) for(j in 1:k) if(!is.na(coeff[j,i])) {
if(pval[j,i]<.01) symb = 'green'
else if( (pval[j,i]<.05) & (pval[j,i]>=.01)) symb = 'orange'
else if( (pval[j,i]<.1) & (pval[j,i]>=.05)) symb = 'red'
else symb = 'black'
polygon(c(i+.5 ,i+.2 ,i+.5 ,i+.5),
c(k-j+0.5,k-j+0.5,k-j+0.8,k-j+0.5),
col=symb)
if(j==choix) {
rect(xleft=i-.5,
xright=i+.5,
ybottom=k-j+1.5,
ytop=k-j+.5,
lwd=4)
text(i,
k-j+1,
round(coeff[j,i],2),
cex=1.2,
font=2)
}
else{
rect(xleft=i-.5,xright=i+.5,ybottom=k-j+1.5,ytop=k-j+.5)
text(i,k-j+1,round(coeff[j,i],2),cex=1.2,font=1)
}
}
axis(3,1:n,noms)
par(mar=c(0.5,0,0,0.5))
plot(0,axes=F,xlab='',ylab='',type='n',xlim=c(0,8),ylim=c(-.2,.8))
cols <- c('green','orange','red','black')
niv <- c('0','0.01','0.05','0.1')
for(i in 0:3){
polygon(c(1+2*i ,1+2*i ,1+2*i-.5 ,1+2*i),
c(.4 ,.7 , .4 , .4),
col=cols[i+1])
text(2*i,0.5,niv[i+1],cex=1.5)
}
text(8,.5,1,cex=1.5)
text(4,0,'p-value',cex=2)
box()
residus <- arimaSelect.out[[3]][[choix]]$res
par(mar=c(1,2,4,1))
acf(residus,main='')
title('acf',line=.5)
par(mar=c(1,2,4,1))
pacf(residus,main='')
title('pacf',line=.5)
par(mar=c(2,2,4,1))
qqnorm(residus,main='')
title('qq-norm',line=.5)
qqline(residus)
residus
}
if (par2 == 0) x <- log(x)
if (par2 != 0) x <- x^par2
(selection <- arimaSelect(x, order=c(par6,par3,par7), seasonal=list(order=c(par8,par4,par9), period=par5)))
bitmap(file='test1.png')
resid <- arimaSelectplot(selection)
dev.off()
resid
bitmap(file='test2.png')
acf(resid,length(resid)/2, main='Residual Autocorrelation Function')
dev.off()
bitmap(file='test3.png')
pacf(resid,length(resid)/2, main='Residual Partial Autocorrelation Function')
dev.off()
bitmap(file='test4.png')
cpgram(resid, main='Residual Cumulative Periodogram')
dev.off()
bitmap(file='test5.png')
hist(resid, main='Residual Histogram', xlab='values of Residuals')
dev.off()
bitmap(file='test6.png')
densityplot(~resid,col='black',main='Residual Density Plot', xlab='values of Residuals')
dev.off()
bitmap(file='test7.png')
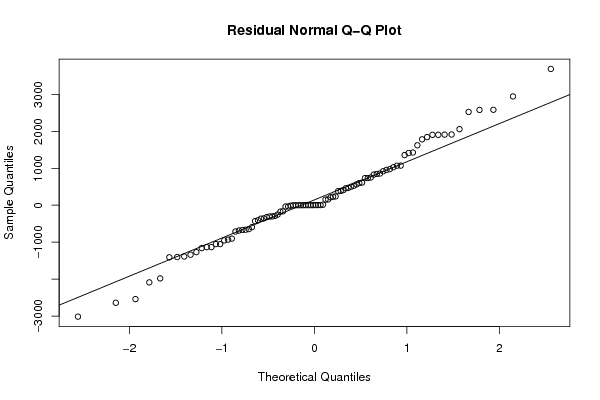
qqnorm(resid, main='Residual Normal Q-Q Plot')
qqline(resid)
dev.off()
ncols <- length(selection[[1]][1,])
nrows <- length(selection[[2]][,1])-1
load(file='createtable')
a<-table.start()
a<-table.row.start(a)
a<-table.element(a,'ARIMA Parameter Estimation and Backward Selection', ncols+1,TRUE)
a<-table.row.end(a)
a<-table.row.start(a)
a<-table.element(a,'Iteration', header=TRUE)
for (i in 1:ncols) {
a<-table.element(a,names(selection[[3]][[1]]$coef)[i],header=TRUE)
}
a<-table.row.end(a)
for (j in 1:nrows) {
a<-table.row.start(a)
mydum <- 'Estimates ('
mydum <- paste(mydum,j)
mydum <- paste(mydum,')')
a<-table.element(a,mydum, header=TRUE)
for (i in 1:ncols) {
a<-table.element(a,round(selection[[1]][j,i],4))
}
a<-table.row.end(a)
a<-table.row.start(a)
a<-table.element(a,'(p-val)', header=TRUE)
for (i in 1:ncols) {
mydum <- '('
mydum <- paste(mydum,round(selection[[2]][j,i],4),sep='')
mydum <- paste(mydum,')')
a<-table.element(a,mydum)
}
a<-table.row.end(a)
}
a<-table.end(a)
table.save(a,file='mytable.tab')
a<-table.start()
a<-table.row.start(a)
a<-table.element(a,'Estimated ARIMA Residuals', 1,TRUE)
a<-table.row.end(a)
a<-table.row.start(a)
a<-table.element(a,'Value', 1,TRUE)
a<-table.row.end(a)
for (i in (par4*par5+par3):length(resid)) {
a<-table.row.start(a)
a<-table.element(a,resid[i])
a<-table.row.end(a)
}
a<-table.end(a)
table.save(a,file='mytable1.tab')