Free Statistics

of Irreproducible Research!

Author's title

Author*The author of this computation has been verified*
R Software Modulerwasp_autocorrelation.wasp
Title produced by software(Partial) Autocorrelation Function
Date of computationSun, 26 Dec 2010 10:33:29 +0000
Cite this page as followsStatistical Computations at FreeStatistics.org, Office for Research Development and Education, URL https://freestatistics.org/blog/index.php?v=date/2010/Dec/26/t1293359489nw8dkkwkhoit8fu.htm/, Retrieved Mon, 06 May 2024 11:47:52 +0000
Statistical Computations at FreeStatistics.org, Office for Research Development and Education, URL https://freestatistics.org/blog/index.php?pk=115499, Retrieved Mon, 06 May 2024 11:47:52 +0000
QR Codes:

Original text written by user:
IsPrivate?No (this computation is public)
User-defined keywords
Estimated Impact148
Family? (F = Feedback message, R = changed R code, M = changed R Module, P = changed Parameters, D = changed Data)
-       [(Partial) Autocorrelation Function] [tijdreeks bevolki...] [2010-12-26 10:33:29] [531024149246456e4f6d79ace2e85c12] [Current]
Feedback Forum

Post a new message
Dataseries X:
5140
4749
3635
4305
5805
4260
3869
7325
9280
6222
3272
7598
1345
1900
1480
1472
3823
4454
3357
5393
8329
4152
4042
7747
1451
911
-406
1387
2150
1577
2642
4273
8064
3243
1112
2280
505
744
-1369
-531
1041
2076
577
5080
6584
3761
294
5020
1141
3805
2127
2531
3682
3263
2798
5936
10568
5296
1870
4390
3707
5201
3748
5282
5349
6249
5517
8640
15767
8850
5582
6496
3255
6189
6452
5099
6833
7046
7739
10142
16054
7721
6182
6490
3704
6235
4655
5072
3640
5147
5703
11889
15603
9589


Summary of computational transaction
Raw Inputview raw input (R code)
Raw Outputview raw output of R engine
Computing time2 seconds
R Server'RServer@AstonUniversity' @ vre.aston.ac.uk

\begin{tabular}{lllllllll}
\hline
Summary of computational transaction \tabularnewline
Raw Input & view raw input (R code)  \tabularnewline
Raw Output & view raw output of R engine  \tabularnewline
Computing time & 2 seconds \tabularnewline
R Server & 'RServer@AstonUniversity' @ vre.aston.ac.uk \tabularnewline
\hline
\end{tabular}
%Source: https://freestatistics.org/blog/index.php?pk=115499&T=0

[TABLE]
[ROW][C]Summary of computational transaction[/C][/ROW]
[ROW][C]Raw Input[/C][C]view raw input (R code) [/C][/ROW]
[ROW][C]Raw Output[/C][C]view raw output of R engine [/C][/ROW]
[ROW][C]Computing time[/C][C]2 seconds[/C][/ROW]
[ROW][C]R Server[/C][C]'RServer@AstonUniversity' @ vre.aston.ac.uk[/C][/ROW]
[/TABLE]
Source: https://freestatistics.org/blog/index.php?pk=115499&T=0

Globally Unique Identifier (entire table): ba.freestatistics.org/blog/index.php?pk=115499&T=0

As an alternative you can also use a QR Code:  

The GUIDs for individual cells are displayed in the table below:

Summary of computational transaction
Raw Inputview raw input (R code)
Raw Outputview raw output of R engine
Computing time2 seconds
R Server'RServer@AstonUniversity' @ vre.aston.ac.uk


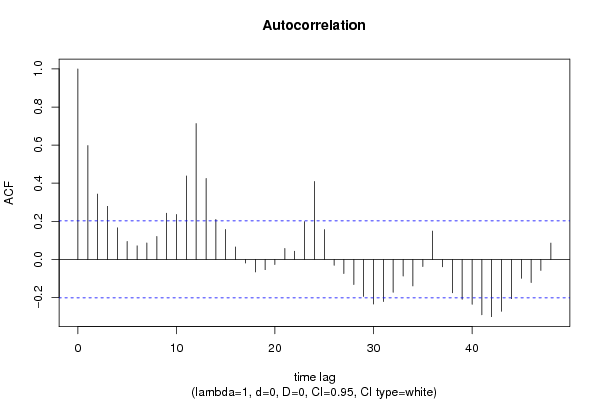
Autocorrelation Function
Time lag kACF(k)T-STATP-value
10.5975475.79340
20.3430893.32640.000628
30.2786792.70190.00409
40.165811.60760.055639
50.0938710.91010.182545
60.0712760.69110.245619
70.0863460.83720.202315
80.1203461.16680.123122
90.2430892.35680.010253
100.2360272.28840.012178
110.437934.24592.6e-05
120.7131966.91470
130.425524.12564e-05
140.2103082.0390.022129
150.1568841.5210.065803
160.0655910.63590.263184
17-0.018499-0.17940.429022
18-0.065457-0.63460.263605
19-0.053654-0.52020.302075
20-0.026818-0.260.397712
210.0576870.55930.288645
220.0436480.42320.336565
230.1987691.92710.028491
240.4093763.9697.1e-05
250.1567751.520.065935
26-0.031106-0.30160.381818
27-0.073484-0.71250.238975
28-0.1319-1.27880.102055
29-0.194203-1.88290.031405
30-0.234196-2.27060.012727
31-0.221322-2.14580.017232
32-0.172545-1.67290.048837
33-0.086909-0.84260.200791
34-0.138838-1.34610.090756
35-0.036729-0.35610.361281
360.1489441.44410.076023
37-0.038602-0.37430.354528
38-0.175386-1.70040.046178
39-0.209423-2.03040.022569
40-0.235504-2.28330.012333
41-0.290379-2.81530.002968
42-0.300339-2.91190.002243
43-0.272209-2.63920.004865
44-0.205881-1.99610.024409
45-0.098968-0.95950.169877
46-0.121373-1.17680.121131
47-0.057523-0.55770.289185
480.0857750.83160.203867

\begin{tabular}{lllllllll}
\hline
Autocorrelation Function \tabularnewline
Time lag k & ACF(k) & T-STAT & P-value \tabularnewline
1 & 0.597547 & 5.7934 & 0 \tabularnewline
2 & 0.343089 & 3.3264 & 0.000628 \tabularnewline
3 & 0.278679 & 2.7019 & 0.00409 \tabularnewline
4 & 0.16581 & 1.6076 & 0.055639 \tabularnewline
5 & 0.093871 & 0.9101 & 0.182545 \tabularnewline
6 & 0.071276 & 0.6911 & 0.245619 \tabularnewline
7 & 0.086346 & 0.8372 & 0.202315 \tabularnewline
8 & 0.120346 & 1.1668 & 0.123122 \tabularnewline
9 & 0.243089 & 2.3568 & 0.010253 \tabularnewline
10 & 0.236027 & 2.2884 & 0.012178 \tabularnewline
11 & 0.43793 & 4.2459 & 2.6e-05 \tabularnewline
12 & 0.713196 & 6.9147 & 0 \tabularnewline
13 & 0.42552 & 4.1256 & 4e-05 \tabularnewline
14 & 0.210308 & 2.039 & 0.022129 \tabularnewline
15 & 0.156884 & 1.521 & 0.065803 \tabularnewline
16 & 0.065591 & 0.6359 & 0.263184 \tabularnewline
17 & -0.018499 & -0.1794 & 0.429022 \tabularnewline
18 & -0.065457 & -0.6346 & 0.263605 \tabularnewline
19 & -0.053654 & -0.5202 & 0.302075 \tabularnewline
20 & -0.026818 & -0.26 & 0.397712 \tabularnewline
21 & 0.057687 & 0.5593 & 0.288645 \tabularnewline
22 & 0.043648 & 0.4232 & 0.336565 \tabularnewline
23 & 0.198769 & 1.9271 & 0.028491 \tabularnewline
24 & 0.409376 & 3.969 & 7.1e-05 \tabularnewline
25 & 0.156775 & 1.52 & 0.065935 \tabularnewline
26 & -0.031106 & -0.3016 & 0.381818 \tabularnewline
27 & -0.073484 & -0.7125 & 0.238975 \tabularnewline
28 & -0.1319 & -1.2788 & 0.102055 \tabularnewline
29 & -0.194203 & -1.8829 & 0.031405 \tabularnewline
30 & -0.234196 & -2.2706 & 0.012727 \tabularnewline
31 & -0.221322 & -2.1458 & 0.017232 \tabularnewline
32 & -0.172545 & -1.6729 & 0.048837 \tabularnewline
33 & -0.086909 & -0.8426 & 0.200791 \tabularnewline
34 & -0.138838 & -1.3461 & 0.090756 \tabularnewline
35 & -0.036729 & -0.3561 & 0.361281 \tabularnewline
36 & 0.148944 & 1.4441 & 0.076023 \tabularnewline
37 & -0.038602 & -0.3743 & 0.354528 \tabularnewline
38 & -0.175386 & -1.7004 & 0.046178 \tabularnewline
39 & -0.209423 & -2.0304 & 0.022569 \tabularnewline
40 & -0.235504 & -2.2833 & 0.012333 \tabularnewline
41 & -0.290379 & -2.8153 & 0.002968 \tabularnewline
42 & -0.300339 & -2.9119 & 0.002243 \tabularnewline
43 & -0.272209 & -2.6392 & 0.004865 \tabularnewline
44 & -0.205881 & -1.9961 & 0.024409 \tabularnewline
45 & -0.098968 & -0.9595 & 0.169877 \tabularnewline
46 & -0.121373 & -1.1768 & 0.121131 \tabularnewline
47 & -0.057523 & -0.5577 & 0.289185 \tabularnewline
48 & 0.085775 & 0.8316 & 0.203867 \tabularnewline
\hline
\end{tabular}
%Source: https://freestatistics.org/blog/index.php?pk=115499&T=1

[TABLE]
[ROW][C]Autocorrelation Function[/C][/ROW]
[ROW][C]Time lag k[/C][C]ACF(k)[/C][C]T-STAT[/C][C]P-value[/C][/ROW]
[ROW][C]1[/C][C]0.597547[/C][C]5.7934[/C][C]0[/C][/ROW]
[ROW][C]2[/C][C]0.343089[/C][C]3.3264[/C][C]0.000628[/C][/ROW]
[ROW][C]3[/C][C]0.278679[/C][C]2.7019[/C][C]0.00409[/C][/ROW]
[ROW][C]4[/C][C]0.16581[/C][C]1.6076[/C][C]0.055639[/C][/ROW]
[ROW][C]5[/C][C]0.093871[/C][C]0.9101[/C][C]0.182545[/C][/ROW]
[ROW][C]6[/C][C]0.071276[/C][C]0.6911[/C][C]0.245619[/C][/ROW]
[ROW][C]7[/C][C]0.086346[/C][C]0.8372[/C][C]0.202315[/C][/ROW]
[ROW][C]8[/C][C]0.120346[/C][C]1.1668[/C][C]0.123122[/C][/ROW]
[ROW][C]9[/C][C]0.243089[/C][C]2.3568[/C][C]0.010253[/C][/ROW]
[ROW][C]10[/C][C]0.236027[/C][C]2.2884[/C][C]0.012178[/C][/ROW]
[ROW][C]11[/C][C]0.43793[/C][C]4.2459[/C][C]2.6e-05[/C][/ROW]
[ROW][C]12[/C][C]0.713196[/C][C]6.9147[/C][C]0[/C][/ROW]
[ROW][C]13[/C][C]0.42552[/C][C]4.1256[/C][C]4e-05[/C][/ROW]
[ROW][C]14[/C][C]0.210308[/C][C]2.039[/C][C]0.022129[/C][/ROW]
[ROW][C]15[/C][C]0.156884[/C][C]1.521[/C][C]0.065803[/C][/ROW]
[ROW][C]16[/C][C]0.065591[/C][C]0.6359[/C][C]0.263184[/C][/ROW]
[ROW][C]17[/C][C]-0.018499[/C][C]-0.1794[/C][C]0.429022[/C][/ROW]
[ROW][C]18[/C][C]-0.065457[/C][C]-0.6346[/C][C]0.263605[/C][/ROW]
[ROW][C]19[/C][C]-0.053654[/C][C]-0.5202[/C][C]0.302075[/C][/ROW]
[ROW][C]20[/C][C]-0.026818[/C][C]-0.26[/C][C]0.397712[/C][/ROW]
[ROW][C]21[/C][C]0.057687[/C][C]0.5593[/C][C]0.288645[/C][/ROW]
[ROW][C]22[/C][C]0.043648[/C][C]0.4232[/C][C]0.336565[/C][/ROW]
[ROW][C]23[/C][C]0.198769[/C][C]1.9271[/C][C]0.028491[/C][/ROW]
[ROW][C]24[/C][C]0.409376[/C][C]3.969[/C][C]7.1e-05[/C][/ROW]
[ROW][C]25[/C][C]0.156775[/C][C]1.52[/C][C]0.065935[/C][/ROW]
[ROW][C]26[/C][C]-0.031106[/C][C]-0.3016[/C][C]0.381818[/C][/ROW]
[ROW][C]27[/C][C]-0.073484[/C][C]-0.7125[/C][C]0.238975[/C][/ROW]
[ROW][C]28[/C][C]-0.1319[/C][C]-1.2788[/C][C]0.102055[/C][/ROW]
[ROW][C]29[/C][C]-0.194203[/C][C]-1.8829[/C][C]0.031405[/C][/ROW]
[ROW][C]30[/C][C]-0.234196[/C][C]-2.2706[/C][C]0.012727[/C][/ROW]
[ROW][C]31[/C][C]-0.221322[/C][C]-2.1458[/C][C]0.017232[/C][/ROW]
[ROW][C]32[/C][C]-0.172545[/C][C]-1.6729[/C][C]0.048837[/C][/ROW]
[ROW][C]33[/C][C]-0.086909[/C][C]-0.8426[/C][C]0.200791[/C][/ROW]
[ROW][C]34[/C][C]-0.138838[/C][C]-1.3461[/C][C]0.090756[/C][/ROW]
[ROW][C]35[/C][C]-0.036729[/C][C]-0.3561[/C][C]0.361281[/C][/ROW]
[ROW][C]36[/C][C]0.148944[/C][C]1.4441[/C][C]0.076023[/C][/ROW]
[ROW][C]37[/C][C]-0.038602[/C][C]-0.3743[/C][C]0.354528[/C][/ROW]
[ROW][C]38[/C][C]-0.175386[/C][C]-1.7004[/C][C]0.046178[/C][/ROW]
[ROW][C]39[/C][C]-0.209423[/C][C]-2.0304[/C][C]0.022569[/C][/ROW]
[ROW][C]40[/C][C]-0.235504[/C][C]-2.2833[/C][C]0.012333[/C][/ROW]
[ROW][C]41[/C][C]-0.290379[/C][C]-2.8153[/C][C]0.002968[/C][/ROW]
[ROW][C]42[/C][C]-0.300339[/C][C]-2.9119[/C][C]0.002243[/C][/ROW]
[ROW][C]43[/C][C]-0.272209[/C][C]-2.6392[/C][C]0.004865[/C][/ROW]
[ROW][C]44[/C][C]-0.205881[/C][C]-1.9961[/C][C]0.024409[/C][/ROW]
[ROW][C]45[/C][C]-0.098968[/C][C]-0.9595[/C][C]0.169877[/C][/ROW]
[ROW][C]46[/C][C]-0.121373[/C][C]-1.1768[/C][C]0.121131[/C][/ROW]
[ROW][C]47[/C][C]-0.057523[/C][C]-0.5577[/C][C]0.289185[/C][/ROW]
[ROW][C]48[/C][C]0.085775[/C][C]0.8316[/C][C]0.203867[/C][/ROW]
[/TABLE]
Source: https://freestatistics.org/blog/index.php?pk=115499&T=1

Globally Unique Identifier (entire table): ba.freestatistics.org/blog/index.php?pk=115499&T=1

As an alternative you can also use a QR Code:  

The GUIDs for individual cells are displayed in the table below:

Autocorrelation Function
Time lag kACF(k)T-STATP-value
10.5975475.79340
20.3430893.32640.000628
30.2786792.70190.00409
40.165811.60760.055639
50.0938710.91010.182545
60.0712760.69110.245619
70.0863460.83720.202315
80.1203461.16680.123122
90.2430892.35680.010253
100.2360272.28840.012178
110.437934.24592.6e-05
120.7131966.91470
130.425524.12564e-05
140.2103082.0390.022129
150.1568841.5210.065803
160.0655910.63590.263184
17-0.018499-0.17940.429022
18-0.065457-0.63460.263605
19-0.053654-0.52020.302075
20-0.026818-0.260.397712
210.0576870.55930.288645
220.0436480.42320.336565
230.1987691.92710.028491
240.4093763.9697.1e-05
250.1567751.520.065935
26-0.031106-0.30160.381818
27-0.073484-0.71250.238975
28-0.1319-1.27880.102055
29-0.194203-1.88290.031405
30-0.234196-2.27060.012727
31-0.221322-2.14580.017232
32-0.172545-1.67290.048837
33-0.086909-0.84260.200791
34-0.138838-1.34610.090756
35-0.036729-0.35610.361281
360.1489441.44410.076023
37-0.038602-0.37430.354528
38-0.175386-1.70040.046178
39-0.209423-2.03040.022569
40-0.235504-2.28330.012333
41-0.290379-2.81530.002968
42-0.300339-2.91190.002243
43-0.272209-2.63920.004865
44-0.205881-1.99610.024409
45-0.098968-0.95950.169877
46-0.121373-1.17680.121131
47-0.057523-0.55770.289185
480.0857750.83160.203867


Partial Autocorrelation Function
Time lag kPACF(k)T-STATP-value
10.5975475.79340
2-0.021734-0.21070.416783
30.1279081.24010.10901
4-0.07481-0.72530.235031
50.0088590.08590.465869
60.0069350.06720.473268
70.0632820.61350.270499
80.0682280.66150.254958
90.2123232.05860.021152
10-0.026577-0.25770.398612
110.4362144.22922.7e-05
120.4819634.67285e-06
13-0.406655-3.94277.8e-05
14-0.10552-1.02310.154455
15-0.017018-0.1650.434652
16-0.088783-0.86080.195775
17-0.043125-0.41810.338409
18-0.165848-1.6080.0556
190.0038170.0370.485278
20-0.060187-0.58350.280464
21-0.143849-1.39470.083202
220.0250390.24280.404361
23-0.063572-0.61640.269576
24-0.000922-0.00890.496442
25-0.194072-1.88160.031492
26-0.096492-0.93550.175957
27-0.009427-0.09140.463685
28-0.076067-0.73750.231329
290.013690.13270.447346
30-0.020778-0.20150.420391
31-0.052649-0.51050.305464
320.0868720.84230.200892
33-0.004497-0.04360.482659
34-0.09164-0.88850.188276
35-0.078188-0.75810.225155
360.0548990.53230.297898
370.0493630.47860.31667
380.0288340.27960.390215
39-0.038019-0.36860.356623
400.056540.54820.292436
41-0.033813-0.32780.371887
420.0651750.63190.264495
430.0324880.3150.376737
440.0304610.29530.384195
450.0887070.860.195977
460.1412121.36910.087114
47-0.026806-0.25990.397758
480.0357810.34690.364719

\begin{tabular}{lllllllll}
\hline
Partial Autocorrelation Function \tabularnewline
Time lag k & PACF(k) & T-STAT & P-value \tabularnewline
1 & 0.597547 & 5.7934 & 0 \tabularnewline
2 & -0.021734 & -0.2107 & 0.416783 \tabularnewline
3 & 0.127908 & 1.2401 & 0.10901 \tabularnewline
4 & -0.07481 & -0.7253 & 0.235031 \tabularnewline
5 & 0.008859 & 0.0859 & 0.465869 \tabularnewline
6 & 0.006935 & 0.0672 & 0.473268 \tabularnewline
7 & 0.063282 & 0.6135 & 0.270499 \tabularnewline
8 & 0.068228 & 0.6615 & 0.254958 \tabularnewline
9 & 0.212323 & 2.0586 & 0.021152 \tabularnewline
10 & -0.026577 & -0.2577 & 0.398612 \tabularnewline
11 & 0.436214 & 4.2292 & 2.7e-05 \tabularnewline
12 & 0.481963 & 4.6728 & 5e-06 \tabularnewline
13 & -0.406655 & -3.9427 & 7.8e-05 \tabularnewline
14 & -0.10552 & -1.0231 & 0.154455 \tabularnewline
15 & -0.017018 & -0.165 & 0.434652 \tabularnewline
16 & -0.088783 & -0.8608 & 0.195775 \tabularnewline
17 & -0.043125 & -0.4181 & 0.338409 \tabularnewline
18 & -0.165848 & -1.608 & 0.0556 \tabularnewline
19 & 0.003817 & 0.037 & 0.485278 \tabularnewline
20 & -0.060187 & -0.5835 & 0.280464 \tabularnewline
21 & -0.143849 & -1.3947 & 0.083202 \tabularnewline
22 & 0.025039 & 0.2428 & 0.404361 \tabularnewline
23 & -0.063572 & -0.6164 & 0.269576 \tabularnewline
24 & -0.000922 & -0.0089 & 0.496442 \tabularnewline
25 & -0.194072 & -1.8816 & 0.031492 \tabularnewline
26 & -0.096492 & -0.9355 & 0.175957 \tabularnewline
27 & -0.009427 & -0.0914 & 0.463685 \tabularnewline
28 & -0.076067 & -0.7375 & 0.231329 \tabularnewline
29 & 0.01369 & 0.1327 & 0.447346 \tabularnewline
30 & -0.020778 & -0.2015 & 0.420391 \tabularnewline
31 & -0.052649 & -0.5105 & 0.305464 \tabularnewline
32 & 0.086872 & 0.8423 & 0.200892 \tabularnewline
33 & -0.004497 & -0.0436 & 0.482659 \tabularnewline
34 & -0.09164 & -0.8885 & 0.188276 \tabularnewline
35 & -0.078188 & -0.7581 & 0.225155 \tabularnewline
36 & 0.054899 & 0.5323 & 0.297898 \tabularnewline
37 & 0.049363 & 0.4786 & 0.31667 \tabularnewline
38 & 0.028834 & 0.2796 & 0.390215 \tabularnewline
39 & -0.038019 & -0.3686 & 0.356623 \tabularnewline
40 & 0.05654 & 0.5482 & 0.292436 \tabularnewline
41 & -0.033813 & -0.3278 & 0.371887 \tabularnewline
42 & 0.065175 & 0.6319 & 0.264495 \tabularnewline
43 & 0.032488 & 0.315 & 0.376737 \tabularnewline
44 & 0.030461 & 0.2953 & 0.384195 \tabularnewline
45 & 0.088707 & 0.86 & 0.195977 \tabularnewline
46 & 0.141212 & 1.3691 & 0.087114 \tabularnewline
47 & -0.026806 & -0.2599 & 0.397758 \tabularnewline
48 & 0.035781 & 0.3469 & 0.364719 \tabularnewline
\hline
\end{tabular}
%Source: https://freestatistics.org/blog/index.php?pk=115499&T=2

[TABLE]
[ROW][C]Partial Autocorrelation Function[/C][/ROW]
[ROW][C]Time lag k[/C][C]PACF(k)[/C][C]T-STAT[/C][C]P-value[/C][/ROW]
[ROW][C]1[/C][C]0.597547[/C][C]5.7934[/C][C]0[/C][/ROW]
[ROW][C]2[/C][C]-0.021734[/C][C]-0.2107[/C][C]0.416783[/C][/ROW]
[ROW][C]3[/C][C]0.127908[/C][C]1.2401[/C][C]0.10901[/C][/ROW]
[ROW][C]4[/C][C]-0.07481[/C][C]-0.7253[/C][C]0.235031[/C][/ROW]
[ROW][C]5[/C][C]0.008859[/C][C]0.0859[/C][C]0.465869[/C][/ROW]
[ROW][C]6[/C][C]0.006935[/C][C]0.0672[/C][C]0.473268[/C][/ROW]
[ROW][C]7[/C][C]0.063282[/C][C]0.6135[/C][C]0.270499[/C][/ROW]
[ROW][C]8[/C][C]0.068228[/C][C]0.6615[/C][C]0.254958[/C][/ROW]
[ROW][C]9[/C][C]0.212323[/C][C]2.0586[/C][C]0.021152[/C][/ROW]
[ROW][C]10[/C][C]-0.026577[/C][C]-0.2577[/C][C]0.398612[/C][/ROW]
[ROW][C]11[/C][C]0.436214[/C][C]4.2292[/C][C]2.7e-05[/C][/ROW]
[ROW][C]12[/C][C]0.481963[/C][C]4.6728[/C][C]5e-06[/C][/ROW]
[ROW][C]13[/C][C]-0.406655[/C][C]-3.9427[/C][C]7.8e-05[/C][/ROW]
[ROW][C]14[/C][C]-0.10552[/C][C]-1.0231[/C][C]0.154455[/C][/ROW]
[ROW][C]15[/C][C]-0.017018[/C][C]-0.165[/C][C]0.434652[/C][/ROW]
[ROW][C]16[/C][C]-0.088783[/C][C]-0.8608[/C][C]0.195775[/C][/ROW]
[ROW][C]17[/C][C]-0.043125[/C][C]-0.4181[/C][C]0.338409[/C][/ROW]
[ROW][C]18[/C][C]-0.165848[/C][C]-1.608[/C][C]0.0556[/C][/ROW]
[ROW][C]19[/C][C]0.003817[/C][C]0.037[/C][C]0.485278[/C][/ROW]
[ROW][C]20[/C][C]-0.060187[/C][C]-0.5835[/C][C]0.280464[/C][/ROW]
[ROW][C]21[/C][C]-0.143849[/C][C]-1.3947[/C][C]0.083202[/C][/ROW]
[ROW][C]22[/C][C]0.025039[/C][C]0.2428[/C][C]0.404361[/C][/ROW]
[ROW][C]23[/C][C]-0.063572[/C][C]-0.6164[/C][C]0.269576[/C][/ROW]
[ROW][C]24[/C][C]-0.000922[/C][C]-0.0089[/C][C]0.496442[/C][/ROW]
[ROW][C]25[/C][C]-0.194072[/C][C]-1.8816[/C][C]0.031492[/C][/ROW]
[ROW][C]26[/C][C]-0.096492[/C][C]-0.9355[/C][C]0.175957[/C][/ROW]
[ROW][C]27[/C][C]-0.009427[/C][C]-0.0914[/C][C]0.463685[/C][/ROW]
[ROW][C]28[/C][C]-0.076067[/C][C]-0.7375[/C][C]0.231329[/C][/ROW]
[ROW][C]29[/C][C]0.01369[/C][C]0.1327[/C][C]0.447346[/C][/ROW]
[ROW][C]30[/C][C]-0.020778[/C][C]-0.2015[/C][C]0.420391[/C][/ROW]
[ROW][C]31[/C][C]-0.052649[/C][C]-0.5105[/C][C]0.305464[/C][/ROW]
[ROW][C]32[/C][C]0.086872[/C][C]0.8423[/C][C]0.200892[/C][/ROW]
[ROW][C]33[/C][C]-0.004497[/C][C]-0.0436[/C][C]0.482659[/C][/ROW]
[ROW][C]34[/C][C]-0.09164[/C][C]-0.8885[/C][C]0.188276[/C][/ROW]
[ROW][C]35[/C][C]-0.078188[/C][C]-0.7581[/C][C]0.225155[/C][/ROW]
[ROW][C]36[/C][C]0.054899[/C][C]0.5323[/C][C]0.297898[/C][/ROW]
[ROW][C]37[/C][C]0.049363[/C][C]0.4786[/C][C]0.31667[/C][/ROW]
[ROW][C]38[/C][C]0.028834[/C][C]0.2796[/C][C]0.390215[/C][/ROW]
[ROW][C]39[/C][C]-0.038019[/C][C]-0.3686[/C][C]0.356623[/C][/ROW]
[ROW][C]40[/C][C]0.05654[/C][C]0.5482[/C][C]0.292436[/C][/ROW]
[ROW][C]41[/C][C]-0.033813[/C][C]-0.3278[/C][C]0.371887[/C][/ROW]
[ROW][C]42[/C][C]0.065175[/C][C]0.6319[/C][C]0.264495[/C][/ROW]
[ROW][C]43[/C][C]0.032488[/C][C]0.315[/C][C]0.376737[/C][/ROW]
[ROW][C]44[/C][C]0.030461[/C][C]0.2953[/C][C]0.384195[/C][/ROW]
[ROW][C]45[/C][C]0.088707[/C][C]0.86[/C][C]0.195977[/C][/ROW]
[ROW][C]46[/C][C]0.141212[/C][C]1.3691[/C][C]0.087114[/C][/ROW]
[ROW][C]47[/C][C]-0.026806[/C][C]-0.2599[/C][C]0.397758[/C][/ROW]
[ROW][C]48[/C][C]0.035781[/C][C]0.3469[/C][C]0.364719[/C][/ROW]
[/TABLE]
Source: https://freestatistics.org/blog/index.php?pk=115499&T=2

Globally Unique Identifier (entire table): ba.freestatistics.org/blog/index.php?pk=115499&T=2

As an alternative you can also use a QR Code:  

The GUIDs for individual cells are displayed in the table below:

Partial Autocorrelation Function
Time lag kPACF(k)T-STATP-value
10.5975475.79340
2-0.021734-0.21070.416783
30.1279081.24010.10901
4-0.07481-0.72530.235031
50.0088590.08590.465869
60.0069350.06720.473268
70.0632820.61350.270499
80.0682280.66150.254958
90.2123232.05860.021152
10-0.026577-0.25770.398612
110.4362144.22922.7e-05
120.4819634.67285e-06
13-0.406655-3.94277.8e-05
14-0.10552-1.02310.154455
15-0.017018-0.1650.434652
16-0.088783-0.86080.195775
17-0.043125-0.41810.338409
18-0.165848-1.6080.0556
190.0038170.0370.485278
20-0.060187-0.58350.280464
21-0.143849-1.39470.083202
220.0250390.24280.404361
23-0.063572-0.61640.269576
24-0.000922-0.00890.496442
25-0.194072-1.88160.031492
26-0.096492-0.93550.175957
27-0.009427-0.09140.463685
28-0.076067-0.73750.231329
290.013690.13270.447346
30-0.020778-0.20150.420391
31-0.052649-0.51050.305464
320.0868720.84230.200892
33-0.004497-0.04360.482659
34-0.09164-0.88850.188276
35-0.078188-0.75810.225155
360.0548990.53230.297898
370.0493630.47860.31667
380.0288340.27960.390215
39-0.038019-0.36860.356623
400.056540.54820.292436
41-0.033813-0.32780.371887
420.0651750.63190.264495
430.0324880.3150.376737
440.0304610.29530.384195
450.0887070.860.195977
460.1412121.36910.087114
47-0.026806-0.25990.397758
480.0357810.34690.364719


Parameters (Session):
par1 = 48 ; par2 = 1 ; par3 = 0 ; par4 = 0 ; par5 = 12 ; par6 = White Noise ; par7 = 0.95 ;
Parameters (R input):
par1 = 48 ; par2 = 1 ; par3 = 0 ; par4 = 0 ; par5 = 12 ; par6 = White Noise ; par7 = 0.95 ; par8 = ;
R code (references can be found in the software module):
if (par1 == 'Default') {
par1 = 10*log10(length(x))
} else {
par1 <- as.numeric(par1)
}
par2 <- as.numeric(par2)
par3 <- as.numeric(par3)
par4 <- as.numeric(par4)
par5 <- as.numeric(par5)
if (par6 == 'White Noise') par6 <- 'white' else par6 <- 'ma'
par7 <- as.numeric(par7)
if (par8 != '') par8 <- as.numeric(par8)
ox <- x
if (par8 == '') {
if (par2 == 0) {
x <- log(x)
} else {
x <- (x ^ par2 - 1) / par2
}
} else {
x <- log(x,base=par8)
}
if (par3 > 0) x <- diff(x,lag=1,difference=par3)
if (par4 > 0) x <- diff(x,lag=par5,difference=par4)
bitmap(file='picts.png')
op <- par(mfrow=c(2,1))
plot(ox,type='l',main='Original Time Series',xlab='time',ylab='value')
if (par8=='') {
mytitle <- paste('Working Time Series (lambda=',par2,', d=',par3,', D=',par4,')',sep='')
mysub <- paste('(lambda=',par2,', d=',par3,', D=',par4,', CI=', par7, ', CI type=',par6,')',sep='')
} else {
mytitle <- paste('Working Time Series (base=',par8,', d=',par3,', D=',par4,')',sep='')
mysub <- paste('(base=',par8,', d=',par3,', D=',par4,', CI=', par7, ', CI type=',par6,')',sep='')
}
plot(x,type='l', main=mytitle,xlab='time',ylab='value')
par(op)
dev.off()
bitmap(file='pic1.png')
racf <- acf(x, par1, main='Autocorrelation', xlab='time lag', ylab='ACF', ci.type=par6, ci=par7, sub=mysub)
dev.off()
bitmap(file='pic2.png')
rpacf <- pacf(x,par1,main='Partial Autocorrelation',xlab='lags',ylab='PACF',sub=mysub)
dev.off()
(myacf <- c(racf$acf))
(mypacf <- c(rpacf$acf))
lengthx <- length(x)
sqrtn <- sqrt(lengthx)
load(file='createtable')
a<-table.start()
a<-table.row.start(a)
a<-table.element(a,'Autocorrelation Function',4,TRUE)
a<-table.row.end(a)
a<-table.row.start(a)
a<-table.element(a,'Time lag k',header=TRUE)
a<-table.element(a,hyperlink('basics.htm','ACF(k)','click here for more information about the Autocorrelation Function'),header=TRUE)
a<-table.element(a,'T-STAT',header=TRUE)
a<-table.element(a,'P-value',header=TRUE)
a<-table.row.end(a)
for (i in 2:(par1+1)) {
a<-table.row.start(a)
a<-table.element(a,i-1,header=TRUE)
a<-table.element(a,round(myacf[i],6))
mytstat <- myacf[i]*sqrtn
a<-table.element(a,round(mytstat,4))
a<-table.element(a,round(1-pt(abs(mytstat),lengthx),6))
a<-table.row.end(a)
}
a<-table.end(a)
table.save(a,file='mytable.tab')
a<-table.start()
a<-table.row.start(a)
a<-table.element(a,'Partial Autocorrelation Function',4,TRUE)
a<-table.row.end(a)
a<-table.row.start(a)
a<-table.element(a,'Time lag k',header=TRUE)
a<-table.element(a,hyperlink('basics.htm','PACF(k)','click here for more information about the Partial Autocorrelation Function'),header=TRUE)
a<-table.element(a,'T-STAT',header=TRUE)
a<-table.element(a,'P-value',header=TRUE)
a<-table.row.end(a)
for (i in 1:par1) {
a<-table.row.start(a)
a<-table.element(a,i,header=TRUE)
a<-table.element(a,round(mypacf[i],6))
mytstat <- mypacf[i]*sqrtn
a<-table.element(a,round(mytstat,4))
a<-table.element(a,round(1-pt(abs(mytstat),lengthx),6))
a<-table.row.end(a)
}
a<-table.end(a)
table.save(a,file='mytable1.tab')