Free Statistics

of Irreproducible Research!

Author's title

Author*The author of this computation has been verified*
R Software Modulerwasp_edabi.wasp
Title produced by softwareBivariate Explorative Data Analysis
Date of computationSun, 26 Dec 2010 09:33:15 +0000
Cite this page as followsStatistical Computations at FreeStatistics.org, Office for Research Development and Education, URL https://freestatistics.org/blog/index.php?v=date/2010/Dec/26/t12933559510mvc6r4tlwg65fw.htm/, Retrieved Mon, 06 May 2024 16:39:00 +0000
Statistical Computations at FreeStatistics.org, Office for Research Development and Education, URL https://freestatistics.org/blog/index.php?pk=115489, Retrieved Mon, 06 May 2024 16:39:00 +0000
QR Codes:

Original text written by user:
IsPrivate?No (this computation is public)
User-defined keywordsRegressierechte
Estimated Impact162
Family? (F = Feedback message, R = changed R code, M = changed R Module, P = changed Parameters, D = changed Data)
-     [Box-Cox Linearity Plot] [3/11/2009] [2009-11-02 21:47:57] [b98453cac15ba1066b407e146608df68]
- RMPD  [Bivariate Explorative Data Analysis] [] [2009-11-10 17:19:37] [b7349fb284cae6f1172638396d27b11f]
-   PD      [Bivariate Explorative Data Analysis] [Paper] [2010-12-26 09:33:15] [e247a0a17f1c9a5b89239760575ef468] [Current]
Feedback Forum

Post a new message
Dataseries X:
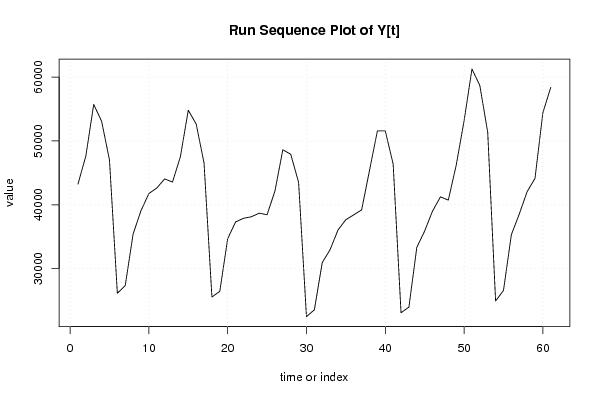
268606
276444
289742
303725
298305
266795
259497
266148
271037
276239
279681
277509
271115
275902
287224
300713
293860
264221
256167
262572
263276
264291
263903
260376
255603
261076
270976
285257
280445
250741
243803
253158
255542
262522
268381
267153
266424
276427
286994
303598
296806
263290
264981
272566
276475
284678
291542
291413
295916
309119
327616
335083
329765
301631
298423
298989
302963
309664
313218
314485
313927
Dataseries Y:
43237
47637
55718
53091
47034
26149
27356
35438
39086
41761
42622
44051
43565
47534
54807
52653
46562
25565
26450
34689
37310
37886
38124
38692
38444
42169
48621
47913
43528
22487
23558
30953
32986
36055
37676
38433
39215
45390
51579
51588
46390
23099
23988
33335
35907
39032
41248
40744
46211
53145
61271
58672
51349
24935
26599
35324
38546
42065
44148
54424
58397


Summary of computational transaction
Raw Inputview raw input (R code)
Raw Outputview raw output of R engine
Computing time7 seconds
R Server'George Udny Yule' @ 72.249.76.132

\begin{tabular}{lllllllll}
\hline
Summary of computational transaction \tabularnewline
Raw Input & view raw input (R code)  \tabularnewline
Raw Output & view raw output of R engine  \tabularnewline
Computing time & 7 seconds \tabularnewline
R Server & 'George Udny Yule' @ 72.249.76.132 \tabularnewline
\hline
\end{tabular}
%Source: https://freestatistics.org/blog/index.php?pk=115489&T=0

[TABLE]
[ROW][C]Summary of computational transaction[/C][/ROW]
[ROW][C]Raw Input[/C][C]view raw input (R code) [/C][/ROW]
[ROW][C]Raw Output[/C][C]view raw output of R engine [/C][/ROW]
[ROW][C]Computing time[/C][C]7 seconds[/C][/ROW]
[ROW][C]R Server[/C][C]'George Udny Yule' @ 72.249.76.132[/C][/ROW]
[/TABLE]
Source: https://freestatistics.org/blog/index.php?pk=115489&T=0

Globally Unique Identifier (entire table): ba.freestatistics.org/blog/index.php?pk=115489&T=0

As an alternative you can also use a QR Code:  

The GUIDs for individual cells are displayed in the table below:

Summary of computational transaction
Raw Inputview raw input (R code)
Raw Outputview raw output of R engine
Computing time7 seconds
R Server'George Udny Yule' @ 72.249.76.132


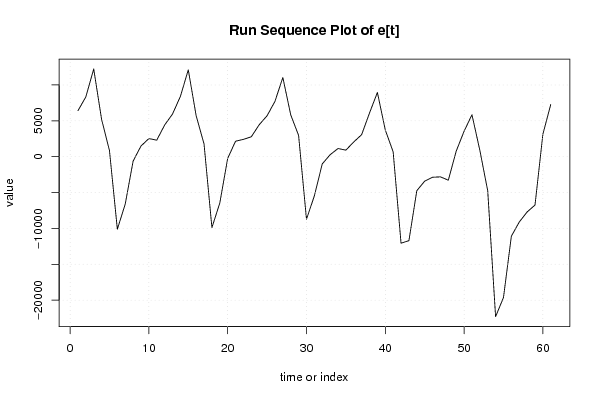
Model: Y[t] = c + b X[t] + e[t]
c-47790.3137541473
b0.315033808887566

\begin{tabular}{lllllllll}
\hline
Model: Y[t] = c + b X[t] + e[t] \tabularnewline
c & -47790.3137541473 \tabularnewline
b & 0.315033808887566 \tabularnewline
\hline
\end{tabular}
%Source: https://freestatistics.org/blog/index.php?pk=115489&T=1

[TABLE]
[ROW][C]Model: Y[t] = c + b X[t] + e[t][/C][/ROW]
[ROW][C]c[/C][C]-47790.3137541473[/C][/ROW]
[ROW][C]b[/C][C]0.315033808887566[/C][/ROW]
[/TABLE]
Source: https://freestatistics.org/blog/index.php?pk=115489&T=1

Globally Unique Identifier (entire table): ba.freestatistics.org/blog/index.php?pk=115489&T=1

As an alternative you can also use a QR Code:  

The GUIDs for individual cells are displayed in the table below:

Model: Y[t] = c + b X[t] + e[t]
c-47790.3137541473
b0.315033808887566


Descriptive Statistics about e[t]
# observations61
minimum-22298.6490544180
Q1-4742.19139910093
median1490.49529468816
mean9.62727165747087e-14
Q35197.67014977141
maximum12229.7878994462

\begin{tabular}{lllllllll}
\hline
Descriptive Statistics about e[t] \tabularnewline
# observations & 61 \tabularnewline
minimum & -22298.6490544180 \tabularnewline
Q1 & -4742.19139910093 \tabularnewline
median & 1490.49529468816 \tabularnewline
mean & 9.62727165747087e-14 \tabularnewline
Q3 & 5197.67014977141 \tabularnewline
maximum & 12229.7878994462 \tabularnewline
\hline
\end{tabular}
%Source: https://freestatistics.org/blog/index.php?pk=115489&T=2

[TABLE]
[ROW][C]Descriptive Statistics about e[t][/C][/ROW]
[ROW][C]# observations[/C][C]61[/C][/ROW]
[ROW][C]minimum[/C][C]-22298.6490544180[/C][/ROW]
[ROW][C]Q1[/C][C]-4742.19139910093[/C][/ROW]
[ROW][C]median[/C][C]1490.49529468816[/C][/ROW]
[ROW][C]mean[/C][C]9.62727165747087e-14[/C][/ROW]
[ROW][C]Q3[/C][C]5197.67014977141[/C][/ROW]
[ROW][C]maximum[/C][C]12229.7878994462[/C][/ROW]
[/TABLE]
Source: https://freestatistics.org/blog/index.php?pk=115489&T=2

Globally Unique Identifier (entire table): ba.freestatistics.org/blog/index.php?pk=115489&T=2

As an alternative you can also use a QR Code:  

The GUIDs for individual cells are displayed in the table below:

Descriptive Statistics about e[t]
# observations61
minimum-22298.6490544180
Q1-4742.19139910093
median1490.49529468816
mean9.62727165747087e-14
Q35197.67014977141
maximum12229.7878994462


Parameters (Session):
par1 = 0 ; par2 = 36 ;
Parameters (R input):
par1 = 0 ; par2 = 36 ;
R code (references can be found in the software module):
par1 <- as.numeric(par1)
par2 <- as.numeric(par2)
x <- as.ts(x)
y <- as.ts(y)
mylm <- lm(y~x)
cbind(mylm$resid)
library(lattice)
bitmap(file='pic1.png')
plot(y,type='l',main='Run Sequence Plot of Y[t]',xlab='time or index',ylab='value')
grid()
dev.off()
bitmap(file='pic1a.png')
plot(x,type='l',main='Run Sequence Plot of X[t]',xlab='time or index',ylab='value')
grid()
dev.off()
bitmap(file='pic1b.png')
plot(x,y,main='Scatter Plot',xlab='X[t]',ylab='Y[t]')
grid()
dev.off()
bitmap(file='pic1c.png')
plot(mylm$resid,type='l',main='Run Sequence Plot of e[t]',xlab='time or index',ylab='value')
grid()
dev.off()
bitmap(file='pic2.png')
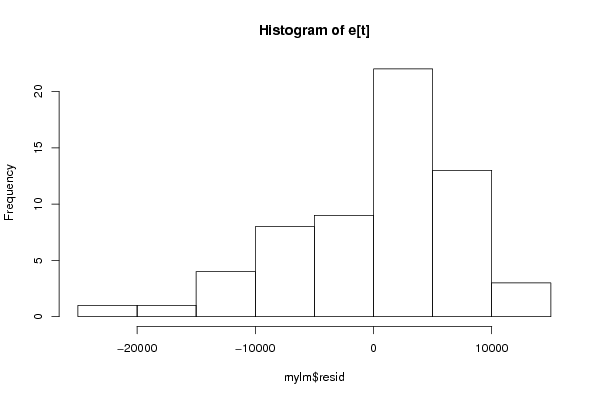
hist(mylm$resid,main='Histogram of e[t]')
dev.off()
bitmap(file='pic3.png')
if (par1 > 0)
{
densityplot(~mylm$resid,col='black',main=paste('Density Plot of e[t] bw = ',par1),bw=par1)
} else {
densityplot(~mylm$resid,col='black',main='Density Plot of e[t]')
}
dev.off()
bitmap(file='pic4.png')
qqnorm(mylm$resid,main='QQ plot of e[t]')
qqline(mylm$resid)
grid()
dev.off()
if (par2 > 0)
{
bitmap(file='pic5.png')
acf(mylm$resid,lag.max=par2,main='Residual Autocorrelation Function')
grid()
dev.off()
}
summary(x)
load(file='createtable')
a<-table.start()
a<-table.row.start(a)
a<-table.element(a,'Model: Y[t] = c + b X[t] + e[t]',2,TRUE)
a<-table.row.end(a)
a<-table.row.start(a)
a<-table.element(a,'c',1,TRUE)
a<-table.element(a,mylm$coeff[[1]])
a<-table.row.end(a)
a<-table.row.start(a)
a<-table.element(a,'b',1,TRUE)
a<-table.element(a,mylm$coeff[[2]])
a<-table.row.end(a)
a<-table.end(a)
table.save(a,file='mytable.tab')
a<-table.start()
a<-table.row.start(a)
a<-table.element(a,'Descriptive Statistics about e[t]',2,TRUE)
a<-table.row.end(a)
a<-table.row.start(a)
a<-table.element(a,'# observations',header=TRUE)
a<-table.element(a,length(mylm$resid))
a<-table.row.end(a)
a<-table.row.start(a)
a<-table.element(a,'minimum',header=TRUE)
a<-table.element(a,min(mylm$resid))
a<-table.row.end(a)
a<-table.row.start(a)
a<-table.element(a,'Q1',header=TRUE)
a<-table.element(a,quantile(mylm$resid,0.25))
a<-table.row.end(a)
a<-table.row.start(a)
a<-table.element(a,'median',header=TRUE)
a<-table.element(a,median(mylm$resid))
a<-table.row.end(a)
a<-table.row.start(a)
a<-table.element(a,'mean',header=TRUE)
a<-table.element(a,mean(mylm$resid))
a<-table.row.end(a)
a<-table.row.start(a)
a<-table.element(a,'Q3',header=TRUE)
a<-table.element(a,quantile(mylm$resid,0.75))
a<-table.row.end(a)
a<-table.row.start(a)
a<-table.element(a,'maximum',header=TRUE)
a<-table.element(a,max(mylm$resid))
a<-table.row.end(a)
a<-table.end(a)
table.save(a,file='mytable.tab')