| Multiple Linear Regression - Estimated Regression Equation |
| GemiddeldeTemperatuur[t] = -1.68681067708564 + 0.0516575621816613UrenZonneschijn[t] + 0.152185240873800Neerslagdagen[t] + 0.279003835025269Onweersdagen[t] -0.391768728279492Sneeuwdagen[t] + 0.330848013568777Maand[t] + e[t] |
| Multiple Linear Regression - Ordinary Least Squares | |||||
| Variable | Parameter | S.D. | T-STAT H0: parameter = 0 | 2-tail p-value | 1-tail p-value |
| (Intercept) | -1.68681067708564 | 2.733139 | -0.6172 | 0.539923 | 0.269962 |
| UrenZonneschijn | 0.0516575621816613 | 0.009481 | 5.4487 | 2e-06 | 1e-06 |
| Neerslagdagen | 0.152185240873800 | 0.106599 | 1.4276 | 0.159609 | 0.079805 |
| Onweersdagen | 0.279003835025269 | 0.089398 | 3.1209 | 0.002993 | 0.001496 |
| Sneeuwdagen | -0.391768728279492 | 0.145934 | -2.6846 | 0.009825 | 0.004913 |
| Maand | 0.330848013568777 | 0.107591 | 3.0751 | 0.003407 | 0.001703 |
| Multiple Linear Regression - Regression Statistics | |
| Multiple R | 0.911599239034732 |
| R-squared | 0.831013172608702 |
| Adjusted R-squared | 0.814114489869572 |
| F-TEST (value) | 49.1762100891121 |
| F-TEST (DF numerator) | 5 |
| F-TEST (DF denominator) | 50 |
| p-value | 0 |
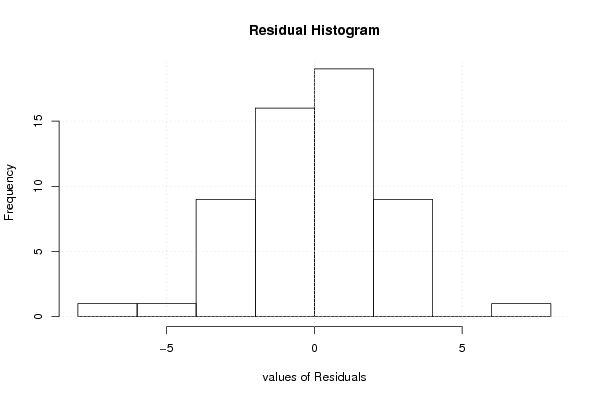
| Multiple Linear Regression - Residual Statistics | |
| Residual Standard Deviation | 2.41751035472080 |
| Sum Squared Residuals | 292.217815759115 |
| Multiple Linear Regression - Actuals, Interpolation, and Residuals | |||
| Time or Index | Actuals | Interpolation Forecast | Residuals Prediction Error |
| 1 | 9.3 | 8.28690341097968 | 1.01309658902032 |
| 2 | 14.2 | 15.6166393654456 | -1.41663936544557 |
| 3 | 17.3 | 17.4193804074355 | -0.119380407435529 |
| 4 | 23 | 21.9938515843986 | 1.00614841560142 |
| 5 | 16.3 | 16.0384277727039 | 0.261572227296069 |
| 6 | 18.4 | 11.7890009824985 | 6.6109990175015 |
| 7 | 14.2 | 11.4618582792278 | 2.73814172077223 |
| 8 | 9.1 | 9.6351773720487 | -0.535177372048698 |
| 9 | 5.9 | 6.97623741548032 | -1.07623741548032 |
| 10 | 7.2 | 4.74134615910219 | 2.45865384089781 |
| 11 | 6.8 | 4.57791811622382 | 2.22208188377618 |
| 12 | 8 | 11.2882779210808 | -3.28827792108076 |
| 13 | 14.3 | 15.1443405418571 | -0.844340541857081 |
| 14 | 14.6 | 15.6933985781281 | -1.09339857812807 |
| 15 | 17.5 | 14.6483452599748 | 2.85165474002523 |
| 16 | 17.2 | 16.4695595123137 | 0.730440487686317 |
| 17 | 17.2 | 13.4770542403259 | 3.72294575967413 |
| 18 | 14.1 | 11.0511986110838 | 3.04880138891618 |
| 19 | 10.4 | 10.1457118504794 | 0.254288149520584 |
| 20 | 6.8 | 7.82236354940502 | -1.02236354940502 |
| 21 | 4.1 | 10.4649374252098 | -6.3649374252098 |
| 22 | 6.5 | 4.48015442998137 | 2.01984557001863 |
| 23 | 6.1 | 7.71578350460358 | -1.61578350460358 |
| 24 | 6.3 | 5.96054295519058 | 0.339457044809423 |
| 25 | 9.3 | 11.5309839941996 | -2.23098399419964 |
| 26 | 16.4 | 17.2014137596623 | -0.801413759662306 |
| 27 | 16.1 | 15.2321138530417 | 0.867886146958343 |
| 28 | 18 | 16.9289026806063 | 1.07109731939373 |
| 29 | 17.6 | 14.6072864444645 | 2.99271355553546 |
| 30 | 14 | 12.9529621703731 | 1.04703782962694 |
| 31 | 10.5 | 11.7058971749596 | -1.20589717495965 |
| 32 | 6.9 | 9.31136455254512 | -2.41136455254512 |
| 33 | 2.8 | 6.06370650101517 | -3.26370650101517 |
| 34 | 0.7 | 4.22495495984021 | -3.52495495984021 |
| 35 | 3.6 | 1.81792012664211 | 1.78207987335789 |
| 36 | 6.7 | 9.66962418751898 | -2.96962418751898 |
| 37 | 12.5 | 14.8342805281548 | -2.33428052815478 |
| 38 | 14.4 | 16.8645181985975 | -2.4645181985975 |
| 39 | 16.5 | 17.5013202351664 | -1.00132023516638 |
| 40 | 18.7 | 19.6979600105205 | -0.997960010520506 |
| 41 | 19.4 | 18.4473299924501 | 0.952670007549915 |
| 42 | 15.8 | 12.2662727292369 | 3.53372727076314 |
| 43 | 11.3 | 10.2530183249326 | 1.0469816750674 |
| 44 | 9.7 | 10.1897383239125 | -0.489738323912547 |
| 45 | 2.9 | 5.36675949479241 | -2.46675949479241 |
| 46 | 0.1 | -1.57016997679994 | 1.67016997679994 |
| 47 | 2.5 | 1.32372849159746 | 1.17627150840254 |
| 48 | 6.7 | 8.54922322103403 | -1.84922322103403 |
| 49 | 10.3 | 14.3013598691449 | -4.00135986914489 |
| 50 | 11.2 | 12.6571464683888 | -1.45714646838881 |
| 51 | 17.4 | 15.8842646823173 | 1.51573531768269 |
| 52 | 20.5 | 18.9732852393371 | 1.52671476066292 |
| 53 | 17 | 15.6707199536470 | 1.32928004635304 |
| 54 | 14.2 | 13.6492178529415 | 0.55078214705852 |
| 55 | 10.6 | 11.8779062223522 | -1.27790622235225 |
| 56 | 6.1 | 4.31658048822891 | 1.78341951177109 |
| Goldfeld-Quandt test for Heteroskedasticity | |||
| p-values | Alternative Hypothesis | ||
| breakpoint index | greater | 2-sided | less |
| 9 | 0.76738155768784 | 0.465236884624321 | 0.232618442312160 |
| 10 | 0.696936115787152 | 0.606127768425695 | 0.303063884212848 |
| 11 | 0.638546962504322 | 0.722906074991356 | 0.361453037495678 |
| 12 | 0.695322696738217 | 0.609354606523566 | 0.304677303261783 |
| 13 | 0.783469350351724 | 0.433061299296552 | 0.216530649648276 |
| 14 | 0.705402836065688 | 0.589194327868624 | 0.294597163934312 |
| 15 | 0.713470133485839 | 0.573059733028322 | 0.286529866514161 |
| 16 | 0.638554563071561 | 0.722890873856878 | 0.361445436928439 |
| 17 | 0.694279979315768 | 0.611440041368464 | 0.305720020684232 |
| 18 | 0.71100425218626 | 0.577991495627479 | 0.288995747813740 |
| 19 | 0.720693813896625 | 0.55861237220675 | 0.279306186103375 |
| 20 | 0.663372516173082 | 0.673254967653837 | 0.336627483826918 |
| 21 | 0.95771327270705 | 0.0845734545858994 | 0.0422867272929497 |
| 22 | 0.943847760634557 | 0.112304478730886 | 0.0561522393654428 |
| 23 | 0.951664472396928 | 0.0966710552061448 | 0.0483355276030724 |
| 24 | 0.925456651455265 | 0.149086697089471 | 0.0745433485447355 |
| 25 | 0.921459784432 | 0.157080431136000 | 0.0785402155680002 |
| 26 | 0.887814336028625 | 0.224371327942749 | 0.112185663971375 |
| 27 | 0.850332079772058 | 0.299335840455884 | 0.149667920227942 |
| 28 | 0.810400070218452 | 0.379199859563097 | 0.189599929781548 |
| 29 | 0.8734355769424 | 0.253128846115199 | 0.126564423057600 |
| 30 | 0.846293663655263 | 0.307412672689474 | 0.153706336344737 |
| 31 | 0.811260779512372 | 0.377478440975256 | 0.188739220487628 |
| 32 | 0.81006042812581 | 0.379879143748381 | 0.189939571874191 |
| 33 | 0.842056006767026 | 0.315887986465947 | 0.157943993232974 |
| 34 | 0.84437116385941 | 0.311257672281179 | 0.155628836140590 |
| 35 | 0.85767885344453 | 0.284642293110941 | 0.142321146555471 |
| 36 | 0.87153626970734 | 0.256927460585320 | 0.128463730292660 |
| 37 | 0.8600808315283 | 0.279838336943400 | 0.139919168471700 |
| 38 | 0.840711251086718 | 0.318577497826563 | 0.159288748913282 |
| 39 | 0.772885839712118 | 0.454228320575763 | 0.227114160287882 |
| 40 | 0.714282635351796 | 0.571434729296408 | 0.285717364648204 |
| 41 | 0.622967964971834 | 0.754064070056332 | 0.377032035028166 |
| 42 | 0.92331369926365 | 0.153372601472701 | 0.0766863007363506 |
| 43 | 0.952542243308912 | 0.094915513382175 | 0.0474577566910875 |
| 44 | 0.920989416618548 | 0.158021166762904 | 0.0790105833814518 |
| 45 | 0.98185686244306 | 0.0362862751138808 | 0.0181431375569404 |
| 46 | 0.951089879690267 | 0.0978202406194668 | 0.0489101203097334 |
| 47 | 0.950315251803516 | 0.0993694963929687 | 0.0496847481964844 |
| Meta Analysis of Goldfeld-Quandt test for Heteroskedasticity | |||
| Description | # significant tests | % significant tests | OK/NOK |
| 1% type I error level | 0 | 0 | OK |
| 5% type I error level | 1 | 0.0256410256410256 | OK |
| 10% type I error level | 6 | 0.153846153846154 | NOK |